Dissertation: Economic Recession and Customer Loyalty to Banks
Abstract
The purpose of the research is to find out the impact of economic recession on customer loyalty to banks in the UK. This aim has been reached using methods of statistical analysis and through investigation of primary and secondary data. The methods of analysis that were implemented in the research included regression and correlation analysis of variance as well as chi-square tests. The data has been analysed for the period from 2010 to 2015 and recommendations have been based on the findings from the analysis. The main results of the study have shown that customer loyalty decreased after the economic recession. This can be explained by changes in consumer behaviour and economic adaptations in households. However, customer loyalty was not found to be dependent on any demographic factors but solely on economic and company related issues. Therefore, it is recommended that the management of financial institutions should improve customer service, make online banking easier to use and more secure, expand the types of deposits available to consumers, increase the size of the bank offers to clients and provide benefits to the long term customers.
Chapter One: Introduction
Customer loyalty can be defined as the faithful behaviour of clients to a company or organisation. Customer loyalty implies that even if companies make minor errors or mistakes, customers are still willing to do business with them or maintain relations. The economic recession in the UK has changed consumer preferences, affected the income of households and changed the financial sector. In light of these changes, the question has arisen whether customers remain loyal to the banks they used before the recession.
In accordance with Cahill (2007:6), the concept of customer loyalty was given much attention at the beginning of the 1990s when this topic was especially popular with business and marketing researchers. That period was marked by a growing degree of rivalry in the global market when companies attempted to develop efficient methods and techniques aimed at customer retention.
Customer loyalty may be defined as “a consumer behaviour, built on positive experience and value, which leads to buying products, even when that may not appear to be the most rational decision” (Kincaid, 2003:10). Peppers and Rogers (2004:57) differentiated between two types of customer loyalty concepts, namely behaviouristic and neo-behaviouristic. The behaviouristic approach to customer loyalty implies viewing and analysing evident consumer behaviour and purchase intentions, whereas the neobehaviouristic approach implied greater focus on loyalty causes and customer attitudes to the provided goods and services (Peppers and Rogers, 2004:57).
As argued by Schweizer (2008:8), the understanding of customer loyalty incorporates two main dimensions of the concept, namely actual behaviour and customer intentions. Even though the topic has been widely studied in the past, relatively little attention has been paid to customer loyalty in the context of the banking industry after the economic recession of 2008-2009.
This period of economic recession followed the credit crunch in the banking industry. The crisis originated in the US mortgage sector but due to the financial integration of international economies, it quickly spread to the United Kingdom and Europe. As a result, many large banks in the UK became intoxicated with bad assets and underperforming investments. This led to a crisis in lending and declined profitability. In such difficult times, the consumers were suspicious of their banks, dissatisfied with the changes and services (Gritten, 2011:90). However, the Great Recession in the UK ended in 2009 (Sayani, 2015:351). As a result, customer loyalty in banks has been negatively affected by the economic recession. Nevertheless, some researchers report that there has been a substantial improvement in the favourability of public attitudes towards financial institutions (Keisidou et al., 2013:259). On the contrary, Bennett and Kottasz (2012:128) reported that most bank customers were less critical of the banking sector’s role in the crisis.
1.1. Aims and Objectives
The aim of the research is to examine how customer loyalty in the UK banking industry has changed in the post-crisis period. The objectives of the study are to:
- Discuss the theoretical frameworks of customer loyalty;
- Discuss the changes in the financial sector after the recession;
- Assess customer satisfaction within banks and loyalty;
- Assess how customer loyalty patterns have changed and provide a forecast based on the trends identified;
- Make recommendations for how banks can improve customer loyalty.
These aims and objectives are reached using the methods of statistical analysis and through investigation of primary and secondary data. The methods of analysis include regression, correlation, analysis of variance and chi-square tests. The data has been analysed for the period from 2010 to 2015 and recommendations have been based on the findings from the analysis. The scope of the dissertation is limited to retail banking operations of financial institutions in the United Kingdom.
The next chapter reviews the literature on customer loyalty. This is followed by a discussion regarding methods, an analysis of the findings and final conclusions.
Chapter Two: Literature Review
The present chapter raises and critically discusses relevant theoretical and empirical evidence on customer loyalty. The first part of the chapter concentrates on theoretical issues such as the Four C’s of Customer Loyalty, internal and external determinants of customer loyalty and customer loyalty strategies. The second part discusses the recent empirical research on customer loyalty in the banking sector and customer loyalty after economic recessions.
2.1. Theoretical Literature Review
2.1.1. Four C’s of Customer Loyalty
Rowley (2005:547) attempted to critically approach the classification of customer loyalty, which is more widely known as the Four C’s of Customer Loyalty. This categorisation was originally developed by such researchers as Dick and Basu (1994:99) who identified the following types of customer loyalty: captive, convenience seeker, contented and committed. It is argued that “the model proposed in the paper differentiates between those customers that are inertial in attitude and behaviour, and those that have a positive orientation” (Rowley, 2005:547). In accordance with the scholar’s segmentation of loyalty, captive and convenience-seeker are representatives of inertial consumer attitudes, whereas contented and committed are considered to be representatives of positive attitudes (Rowley, 2005:547).
It is argued that captive customers demonstrate loyalty by patronising a specific brand, but they only make repeat purchases because they are limited in their choice. In the majority of cases, such customers remain committed to the same brand because switching costs are too high. It is interesting to note that products and services, which require infrequent and rare purchase decisions, attract more captive customers (Peck et al., 1999:172). For instance, car buyers tend to remain captive to the same car brand since they do not have alternative experience in using other brands. However, there is empirical evidence that suggests that captive behaviour does not imply higher customer loyalty because it lacks the company related factors and consumers continue purchasing the product repeatedly because they have no other choice; not because they choose to do so (Dick and Basu, 1994:99). So, it may be argued that captive loyalty is the least stable form of loyalty as customers do not have real relationships with brands. This temporary commitment is explained by the absence of alternatives or unfamiliarity with the alternatives. In accordance with Knox (1998:729), captive loyalty is associated with neither positive nor negative behavioural attitudes.
In the case of the convenience-seeker form of customer loyalty, brand choice is determined by a variety of convenience factors such as opening hours, location, bank teller machines, package size, etc. Correspondingly, Birgelen et al. (1997:1255) differentiate between a number of convenience factors, namely convenience of access, convenience of product and convenience of service. These researchers argue that convenience factors play the leading role in the development of customer loyalty since customers will not shop in places that are inconvenient to them. However, it can be critically remarked that convenience-seeking customers do not have real and stable relationships with the chosen brands, with the exception of convenience associations that are temporary by nature. Furthermore, Hallowell (1996:27) has provided a contradictory argument that convenience factors are only temporary and cannot be viewed as the main determinants of customer loyalty.
It is possible to state that contented customers tend to demonstrate inertial consumer behaviour, with a positive attitude to products and services. It can be argued that “they continue as a customer, but do not extend their involvement with the brand by subscribing to additional services or expanding their expenditure on products or services associated with the brand” (Rowley, 2005:547). Contented customers have relationships with brands as they realise some specific merits and advantages of the products and services. Rowley (2005:547) also argues that companies can keep customers satisfied and loyal even by introducing extensions of the brands and innovations of the products. However, Kronich and Petty (1995:22) assert that brand extension may in fact shatter customer loyalty of contented consumers because it takes a long time to adapt to the changes and develop trust in the extended brand of product.
Finally, committed consumers demonstrate the maximum degree of customer loyalty, which means that they make repeat purchases in the long-term and are ready to give good product and service recommendations to their relatives and friends. This positive consumer behaviour is associated with adding value to brands and building strong and stable relationships (Foss and Stone, 2001:73). However, it should be taken into account that it is predominantly large companies selling well-known products and services that attract committed customers. New brands require a prolonged period of time to cultivate this type of customer loyalty (Peck et al., 1999:193).
2.1.2. External and Internal Factors that Influence Customer Loyalty
A number of scholars in the field have attempted to classify factors that may influence customer loyalty. For instance, Cahill (2007:15) differentiates between the three main groups of customer loyalty determinants, namely customer-related factors, relationshiprelated factors and company-related factors. It can be specified that customer-related determinants of loyalty are derived from individual consumer characteristics. Relationship-related determinants are closely associated with the interaction between sellers and buyers. They include factors such as previous experience, quality, trust, normative feelings and emotional closeness (Cahill, 2007:15). It is reported that the key company-related determinants are the company’s reputation, the price-quality ratio and the appropriate customer loyalty programmes.
In contrast, Duffy (2003:480) singles out two main groups of customer loyalty determinants, namely internal and external. It is explained that internal factors refer to the customer perspective of loyalty to specific brands and services. In turn, external factors refer to the suppliers of goods and services and their ability to cultivate and maintain customer loyalty. As it may be observed, the classifications provided by Duffy (2003:480) and Cahill (2007:15) are similar. Internal and customer-related determinants refer to the same category of factors. Similarly, external and company-related factors have identical meanings. In accordance with Duffy (2003:480), internal factors represent psychographics and demographics of individual consumers. It has been revealed that different age groups, social classes, genders and people with different educational backgrounds may differ in forms of consumer loyalty (Duffy, 2003:480). It is contrasted by another group of researchers that “external factors such as the defensive marketing tactics of competitors, and the activities of supply chain members, could also be explored to assess their effect on the structural relationship between service quality, relationship quality and customer loyalty” (Singh and Waddell, 2004:100).
Kracklauer et al. (2004:116) are convinced that customer loyalty should be viewed as a combination of customer satisfaction and customer trust. Furthermore, the researchers developed the model of persistent and long-term customer loyalty, which is determined by such factors as short-term loyalty and commitment. Hence, the role of satisfaction, trust and commitment is emphasised by Kracklauer et al. (2004:116). Stone et al. (2000:12) agree that commitment and customer satisfaction prove to be important determinants of customer loyalty. Nevertheless, the researchers account for a wider range of factors including service experience, information exchange, efficient relationship management, customer involvement and participation, importance of the product, company size, product size, personal attitudes and household income. As it may be seen, Stone et al. (2000:12) identified both internal and external factors influencing customer satisfaction and their loyalty. If efficient, relationship management is a company-related factor, whilst household income appears to be a customer-related characteristic. It can be critically remarked that organisations do not have absolute control and power over customer loyalty as a variety of factors do not depend on them.
Schweizer (2008:183) critically approaches the most powerful determinants of customer loyalty, which have been identified by the previous researchers in the field. The scholar does not classify them into internal and external, but rates them according to their importance. The identified determinants are purchase conditions, companies’ pricing policies, product quality, product availability, reputation and image, consumer trust, previous experience, positive recommendations, available customer loyalty programmes, customer commitment, customer involvement and participation, switching barriers, customer attributes, customer behaviour patterns, product importance, individual expectations, etc. Schweizer (2008:183) is convinced that customer loyalty is influenced by a combination of factors, which is always unique for different situations. It may be argued that “customer loyalty yields significant benefits when its pursuit is part of an overall business strategy” (Duffy, 2003:480). The major company-related benefits are cost efficiency, channel migration and greater consumer awareness.
2.1.3. Strategies of Customer Loyalty
Taking into consideration that stronger customer loyalty has a positive impact on the companies’ sales, organisations need to develop efficient strategies and programmes of customer loyalty in order to attract and retain more customers. Uncles et al. (2003:249) differentiate between individual perspective and market perspective on loyalty strategies. From an individual viewpoint, firms need to study consumer behaviour and attitudes prior to the formulation of loyalty strategies. In other words, all programmes should be developed on the basis of regular occurrences in customer behaviour. Alternatively, the market perspective implies that the developed loyalty strategies should rely on market tendencies, degree of rivalry in the market and the relationships between brands (Uncles et al., 2003:249).
In accordance with Reinartz and Kumar (2002:86), customer-driven loyalty strategies should take into consideration that the majority of customers tend to buy more than one brand in a product or service category. In this sense, the key aim of every customer loyalty strategy or programme is to achieve single-brand orientation. It is argued that the transition from multi-brand loyalty to single-brand loyalty is a complex process, which takes much time and efforts. Companies can implement strategies and programmes such as special discount cards, regular client cards and personal relationships with customers (Reinartz and Kumar, 2002:86). In the case of market- driven loyalty strategies, it should be taken into consideration that greater loyalty can be achieved by widening distribution channels, increasing perceived value and providing more occasions of purchase and usage. Kahn et al. (1988:384) accounts for such market-driven loyalty strategies as niche brands and fly-buys programmes. The niche brand strategy implies that the total number of customers is comparatively low, but they tend to make frequent purchases. It is argued that “this could be achieved by reducing the distribution coverage of the brand and using the money saved to better support/promote the brand to current customers” (Uncles et al., 2003:249).
Day and Moorman (2010:39) provide a number of principles for building efficient customer loyalty programmes and strategies. Firstly, it is argued by the researchers that staff loyalty should be achieved by organisations. Day and Moorman (2010:39) identify close relationship between stuff loyalty and customer loyalty. The management of the company should serve their employees so that they can serve customers. Secondly, service quality should be improved to the maximum degree. Thirdly, it is important to note than organisations should carefully analyse and respond to the complaints of customers. As reported by Day and Moorman (2010:39), only 10% of customer complaints are given appropriate attention by the management. Fourthly, efficient customer loyalty strategies consist in winning back lost customers. If companies remain focused on only new customers, consumer loyalty will not be achieved. Finally, a centralised customer database should be created and used by all departments and branches of companies (Day and Moorman, 2010:39).
Timm (2007:103) suggests a series of efficient customer loyalty strategies that can be practised in companies. First, the researchers emphasise the importance of high-quality corporate websites, which contribute to communication with customers and their loyalty. Second, all official statements and public speeches made by the management should start from customer evaluations, opinions and reviews (Timm, 2007:103). Third, customer profiles and target groups must be clearly recognised by companies. The fourth strategy, which can increase consumer loyalty, is sophisticated and makes use of social media platforms such as Facebook, Twitter, LinkedIn and YouTube. Finally, innovative and creative marketing campaigns are increasingly important for the growth of customer loyalty (Timm, 2007:103).
2.2. Empirical Literature Review
The following section provides empirical evidence on customer loyalty in the banking sector and customer loyalty during and after the recent economic recession.
2.2.1. Customer Loyalty in the Banking Sector
Baumann et al. (2011:247) pursued a study with the main purpose “to model both current behaviour (measured as share of wallet) and future intentions as measures of customer loyalty, to quantify the link between current and future behaviour” (Baumann et al., 2011:247). This investigation has direct reference to the banking industry. The methodological approach chosen by the researchers consisted of building a new hybrid model, which combined formative and reflective constructs and explained the phenomenon of customer loyalty. It is important to note that the hybrid model identifies three main determinants of customer loyalty, namely resistance to change, variety seeking and risk taking behaviour. The scholars come to the conclusion that the most important determinants of customer loyalty in the banking industry are resistance to change and variety seeking.
However, it may be argued that the empirical investigation pursued by Baumann et al. (2011:247) is associated with a number of limitations. First, the researchers attempted to view the problem exclusively from a customer perspective, having ignored companyrelated determinants of customer loyalty. Second the link between the future and current behaviour of bank customers is unclear. At the same time, the main strength of the investigation conducted by Baumann et al. (2011:247) is a unique model incorporating formative and reflective constructs.
Alternatively, Ganguli and Roy (2011:168) made an attempt to evaluate the role of company-related or external factors, which may influence customer loyalty of bank clients in India. The researchers implemented the methodology of exploratory factor analysis (EFA) and confirmatory factor analysis (CFA) to achieve the primary research aim of the investigation. In their study they found “four generic service quality dimensions in the technology-based banking services – customer service, technology security and information quality, technology convenience, and technology usage easiness and reliability” (Ganguli and Roy, 2011:168). The scholars are convinced that these dimensions should be viewed as the main company-related determinants of customer loyalty in financial institutions including commercial banks.
The researchers also estimated the role of technological factors influencing customer loyalty. Their study refers predominantly to online banking and e-payment technologies, which are gaining more and more popularity today. However, Ganguli and Roy (2011:168) failed to identify specific dimensions of service and information quality, which should be given particular attention. Finally, the outcomes of the empirical investigation are only limited to the country in question.
In another empirical research, Sangeetha and Mahalingam (2011:83) identified the most important factors having impact on consumer loyalty in Islamic financial institutions. The researchers implemented a complex methodology, which was two-fold. First of all, Sangeetha and Mahalingam (2011:83) developed as many as 14 service quality models, which can be applied to the banking sector. Secondly, primary data was collected from more than 500 respondents using the survey research strategy. The researchers arrive at the conclusion that the most significant determinants of customer loyalty with the reference to Islamic banking are; perceived quality of service, positive recommendations of friends and relatives, personal experience, security of online banking, customer involvement and efficient customer relationship management (Sangeetha and Mahalingam, 2011:83).
It may be critically remarked that the findings obtained by Sangeetha and Mahalingam (2011:83) are consistent with the theoretical statements of Kracklauer et al. (2004:116) and Stone et al. (2000:12). These researchers argued that customer loyalty is a result of a set of factors. At the same time, the obtained results are limited from the viewpoint of generalisation as they refer to Islamic banking only. In this sense, the importance of recommendations is overestimated by the researchers (Sangeetha and Mahalingam, 2011:83).
A more recent empirical investigation into the issue of customer loyalty in the banking sector was carried out by Sayani (2015:351). Speaking more precisely, the researcher attempted to identify the main determinants of consumer loyalty in both Islamic and conventional financial institutions. Similarly to this project, Sayani (2015:351) gathered primary data from more than 300 respondents by means of self-administered questionnaires. As mentioned by Hachicha and Amar (2015:349), similarly to any other aspect of business and social life in the Arab world, the Islamic finance system is regulated by Islamic law. Sayani (2015:351) found that in the context of Islamic finance, bank customers’ loyalty was significantly impacted by the Sharia Advisory Board, a number of bank branches and customer service quality.
At the same time, brand reputation was reported by Sayani (2015:351) to play an important role in customer loyalty in conventional banks. These findings are in keeping with Fraering and Minor (2013:334) who also acknowledged that the quality of customer service produced a strong impact on the extent to which an individual was loyal to his/her bank and satisfied with its services. It should be critically remarked that Sayani (2015:351) did not differentiate between functional quality and relational quality, which were reported by Baumann et al. (2011:247) as the key elements of service quality.
Alternatively to Sayani (2015:351), Keisidou et al. (2013:259) distinguished between functional and relational quality, making their empirical study more focused and detailed. Service quality is commonly viewed as the main factor for a successful business (Sangeetha and Mahalingam, 2011:83). This statement is especially relevant to the banking industry since the provision of financial services to customers is the key business activity undertaken by commercial banks (Kaura and Datta, 2012:38). In accordance with Day and Moorman (2010:39), service quality involves customers’ evaluations of the overall excellence of financial services provided to them by financial institutions. Importantly, this evaluation is based on the difference between consumers’ pre-consumption expectations and the post-consumption performance of an organisation (Schweizer, 2008:183).
Keisidou et al. (2013:259) arrived at the conclusion that the quality of customer-bank relations had strong predicting power over customer loyalty. On the contrary, the researchers failed to identify whether functional quality had any positive impact on customer loyalty in the banking sector of economy. These research findings can be explained by the fact that only bank customers were included in the sample. Functional quality “measures how efficiently the bank operates” (Keisidou et al., 2013:279). However, bank customers have no access to this information, meaning they are not capable of assessing the extent to which their bank operates in an efficient way. The inclusion of business insiders such as bank managers and owners in the sample could have allowed Keisidou et al. (2013:259) to arrive at more comprehensive conclusions.
2.2.2. Customer Loyalty during Economic Recession
Williams and Naumann (2011:20) conducted a significant empirical investigation, which studied the changes in customer loyalty during economic slowdowns and recessions. To be more specific, the scholars analysed consumer reactions, behaviour and attitudes to Fortune 100 companies during the recent economic recession. The collected secondary data was subjected to statistical analysis and evaluations. It is concluded that the overall degree of consumer loyalty to the world’s largest companies decreased during the economic recession in 2008 and 2009. It is explained by the fact that companies’ annual revenues, financial performance, market performance, stock prices and earnings per share decreased during the turbulent times. As a result, consumer trust and consumer satisfaction declined because fears arose among the customers. These fears were associated with the future solvency of the companies and hence the wellbeing of the stakeholders who are the customers of the financial institutions.
Williams and Naumann (2011:20) are convinced that the financial performance of companies determines customer loyalty to a considerable degree. However, it should be taken into account that economic recession is not only a company-related factor, but also a customer-related determinant. Indeed, the individual income of customers decreased during the economic slowdown, which led to the decrease in spending. Some products and services ceased to be affordable to consumers, which had a negative influence on consumer loyalty (Williams and Naumann, 2011:20). It is valid to argue that these findings are consistent with the theoretical statements of Stone et al. (2000:12) who argued that the income level and financial stability within countries influence customer loyalty.
In their study, Longbottom and Hilton (2011:39) demonstrated worsening customer loyalty to banks in the UK. The researchers had an objective to explore how minor failures and mistakes in the services of the banks in the United Kingdom affected customer loyalty to these banks. This objective was achieved by collecting primary data from over two thousand research participants who had been approached online. Questionnaires were emailed to them and an online survey has helped to assess the changes in customer loyalty to the banks. The main results of the study suggested that even minor failures and mistakes in the bank services can have a strong negative impact on customer loyalty. This worsening of customer loyalty can be explained by the wide choice of financial institutions which customers can bank with and the unwillingness of consumers to forgive failures in service.
The results produced by Longbottom and Hilton (2011:39) have practical implications for bank managers. During the period of the global economic crisis and recession, the customers can be expected to become even less loyal; especially if their bank is reported to have started experiencing financial problems. In order to retain customer loyalty, it is recommended that the banks’ managers should improve their service to customers since the latter were found to be very important in the determination of customer loyalty (Sangeetha and Mahalingam, 2011:83). It should be critically remarked, however, that Longbottom and Hilton (2011:39) analysed the issue of customer satisfaction and loyalty to banks during the crisis. Therefore, further investigation is needed in order to identify whether customer loyalty has changed after the economic recession in the UK banking sector of economy.
The identified limitation of Longbottom and Hilton’s (2011:39) project was overcome by Bennett and Kottasz (2012:128) who carried out a highly relevant research to this dissertation study. The researchers attempted to establish the main antecedents of shifts in public attitudes towards commercial banks following the recent global financial crisis and economic recession in the United Kingdom. Similarly to this project, Bennett and Kottasz (2012:128) gathered primary quantitative data from bank customers querying their attitudes towards the banking industry, knowledge of the crisis and recession and their loyalty to their current financial institution.
The analysis of the primary data gathered from more than 1,000 bank customers allowed Bennett and Kottasz (2012:128) to conclude that individuals who had been personally impacted by the crisis and recession tended to hold less favourable evaluations of the UK banking industry. Similar results were produced by Gritten (2011:90) according to whom persons who experienced a personal loss in consequence of the global financial crisis give closer attention to its details. As mentioned by Gritten (2011:99), “for those who had the rug pulled swiftly from under their feet, it will take the financial services institutions a long time to rebuild meaningful relationships with customers” (Gritten, 2011:99)
Another interesting research outcome reported by Bennett and Kottasz (2012:128) was that the overwhelming majority of the research participants demonstrated a general dissatisfaction with the banking industry in the post-crisis period. For example, the respondents’ perceptions of the level of banks’ reliability and competence declined significantly in the years following the Great Recession in the UK (Day and Moorman, 2010:39). These findings are in keeping with Sangeetha and Mahalingam (2011:83) according to whom the most recent crisis and recession have produced a strong negative effect on customers’ perceptions of the reputation of commercial banks. As a result, the level of their satisfaction with the services provided to them by financial institutions has declined (Kaura and Datta, 2012:38). These outcomes demonstrate that financial services institutions should invest heavily in their reputational management in order to add to their customers’ satisfaction and build stronger customer loyalty (Sangeetha and Mahalingam, 2011:83).
One of the key limitations of Bennett and Kottasz’s (2012:128) study is that the participants were required to comment only on their attitudes towards the financial services institutions. The researchers did not examine how the recent crisis and economic recession in the UK had impacted the link between consumers’ attitudes towards and perceptions of commercial banks and their banking behaviour. As mentioned by Ganguli and Roy (2011:168), behavioural changes and shifts could involve switching between banks and the extent of institution usage. This dissertation overcomes these limitations by examining whether the research participants consider changing their bank after the economic recession. By paying close attention to this issue, it is possible to identify the extent to which the respondents are loyal to their financial institution (Sangeetha and Mahalingam, 2011:83).
Customer satisfaction is commonly cited in the existing body of literature as one of the key factors of customer loyalty (Day and Moorman, 2010:39). The link between customer satisfaction and loyalty in the post-crisis period was examined by Fraering and Minor (2013:334). The researchers analysed the primary data collected from almost 400 bank customers and found that satisfaction was not the only contributor to higher levels of customer loyalty in the banking sector. Fraering and Minor (2013:334) reported that service quality and reliability and a bank’s market position were also among the factors that impacted the extent to which consumers were loyal to their financial services institution. Similar outcomes were reported by Ganguli and Roy (2011:168) according to whom commercial banks should reward customers who use services, which allow for establishing long-term relationships. By doing that, commercial banks are capable of contributing to higher levels of customer satisfaction and building stronger customer loyalty (Sangeetha and Mahalingam, 2011:83). It should be critically remarked that Fraering and Minor (2013:334) were focused on a single sector of the financial services industry. Hence, the produced research outcomes may not be applicable to other sectors.
Kaura et al. (2015:404) also examined how service quality affected customer satisfaction and loyalty in the banking sector of economy. Alternatively to Fraering and Minor (2013:334), Kaura et al. (2015:404) approached service quality as a set of dimensions such as employee behaviour, information technology (IT) and tangibility. Similarly to this dissertation, the researchers gathered primary data from the urban customers of retail banks by means of self-administered questionnaires. Kaura et al. (2015:404) arrived at the conclusion that employee behaviour and IT had the strongest impact on the extent to which the customers of commercial banks were satisfied with the financial services provided. These findings are in keeping with those produced by Kaura and Datta (2012:38) who also reported that employee behaviour helped in building stronger customer satisfaction and customer loyalty. On the contrary, tangibles were not acknowledged by Kaura et al. (2015:404) to have any significant impact on customer loyalty and satisfaction in the banking industry.
The significance of Kaura’s et al. (2015:404) and Kaura and Datta’s (2012:38) studies is that they were carried out in the post-crisis period, making them highly relevant to this dissertation. At the same time, these projects did not mention whether levels of customer satisfaction and customer loyalty had changed after the economic recession. Furthermore, both Kaura et al. (2015:404) and Kaura and Datta (2012:38) were focused exclusively on India, which can be viewed as a potential limitation to the generalisability of the achieved research outcomes. This dissertation makes an attempt to overcome these limitations by focusing on the largest UK-based commercial banks such as the Royal Bank of Scotland Group, Barclays, HSBC, the Lloyds Banking Group, Standard Chartered and Citigroup.
Chapter Three: Methodology
This chapter aims to discuss the methodological instruments and tools implemented in the study for reaching the aims and objectives. The chapter discusses issues such as the philosophical stance of the research, approach to the study, methods of data collection, strategy of the investigation and methods of data analysis.
3.1. Philosophy and Approach
The investigation has been approached using the positivist philosophical stance which uses a scientific form of research that would be able to test hypotheses with statistical methods and tools. This philosophy can be contrasted with the philosophies of interpretivism and realism, which are used in social studies and require a more flexible approach. Interpretivism and realism are also more associated with the inductive approach and grounded theory, which are used to create new theories and hypotheses (Saunders et al, 2009).
The choice of positivism in this research project can be justified by the need to test the available theories on consumer loyalty and support or to reject the research hypothesis using quantitative data. According to Bryman and Bell (2008) interpretivism will lead the research in a completely different direction since these types of philosophical stance and approach are more concerned with the exploration of the context of the problem rather than testing.
Deduction has also allowed for setting an initial hypothesis of the research, which is stated as follows:
H0: The economic recession in the UK has had a negative impact on the customer
loyalty to large financial institutions.
This hypothesis is tested using a case study strategy in combination with asurvey.
3.2. Strategy of Investigation
Case studies and surveys have been selected as the main strategies for the investigation. One of the strengths of case studies is that they focus on the context of the problem and enrich the research with qualitative information (Robson, 2002). However, it is valid to argue that the context can also be presented with quantitative data as well. In this study, the financial performance of the banks has created the context in which the customer loyalty was investigated.
Nevertheless, the case study alone would not have allowed for an effective exploration of customer loyalty, primary data is required to achieve this. According to Saunders et al (2009) and Bryman and Bell (2008) the survey is the most common and effective strategy for working with primary data. It implies that the data can be retrieved from respondents by means of interview, questionnaires or even observations.
The strength of the survey strategy is that a large number of responses can be generated with little effort. Questionnaires have been preferred to interviews because the former help to gather the information faster and in a standardised form that eases the process of quantification of the data. More detailed information on the data is discussed in the following section of the chapter.
3.3. Data
The research is based on the case studies of six largest banks in the UK, namely the Royal Bank of Scotland Group, Barclays, HSBC, the Lloyds Banking Group, Standard Chartered and Citigroup. The strategy of the case study approach triangulates data, i.e. collection of variables from multiple sources. Primary and secondary data have been used to provide triangulation. Secondary data has been collected form the annual reports of the banks. The data includes the following variables:
- Revenue of banks
- Net profit of banks
- Total amount of deposits
- Total amount of lending to customers.
- Total number of customers and annual changes
These indicators are analysed in the period from 2010 to 2015.
Primary data has been gathered using a survey of customers in each of the six banks. The respondents were randomly selected using social network websites such as Facebook. Snowball sampling has been used to attract people to participate in the survey. It started from asking friends and acquaintances to participate who were, in turn, asked to invite their friends. As a result of this sampling technique, 300 people joined the survey.
The form of the questionnaire that was spread amongst the bank customers is provided in the Appendix. The first part of the questionnaire aims to separate the respondents into several demographic groups in order to reveal the links between customer loyalty to banks after the recession and their demographic characteristics. The second part of the questionnaire is aimed at evaluating the loyalty of consumers to the banks that they use. The questionnaire uses a Likert scale that helps to rank the responses and respondents’ attitudes towards the statements (Saunders et al, 2009; Bryman and Bell, 2008).
3.4. Methods of Data Analysis
Several statistical tools in SPSS have been used to test the research hypothesis and reach the aim of the study. The tools include the chi-square test, ANOVA, regression analysis and correlation analysis. Firstly, the secondary data on the changes in financial performance of the banks in the period from 2010 to 2015 has been analysed using graphical methods that allowed for the identification of trends and patterns. Secondly, primary data has been quantified using the Likert scale and statistical instruments were implemented.
The data has been presented with frequency tables that showed a breakdown of responses and helped estimate the percentages. Cross tabulation and chi-square tests were used to assess whether there was a difference in customer loyalty to banks in different demographic groups. These groups were distinguished by gender, age, occupation education and experience in banking.
The ANOVA test helped to explore the relations between the number of different banks the customers bank with and their loyalty to one particular bank. This test is based on the hypothesis that the mean values of two groups of variables are statistically identical. Then F-test is applied to reject the hypothesis. If the p-value of the test is lower than 0.05, the hypothesis of equality of means is rejected.
In order to establish a degree of association between factors such as satisfaction with the services and customer loyalty, correlation coefficients have been estimated. These coefficients range from -1 to 1, where the extreme points reflect strong negative and positive correlation respectively and zero indicates no correlation at all.
Finally, the factors that are assumed to affect customer loyalty to banks have been included in the regression model as independent variables. The dependent variable was represented by the responses to Question 9. Statistical significance of the factors of customer loyalty has been assessed with t-statistic, which tests the null hypothesis that the regression coefficients are insignificant. The hypothesis is rejected at a 90% confidence level if the p-value of the t-test is lower than 0.1 and at a 95% level if the pvalue is lower than 0.05.
3.5. Limitations
The research project is limited by the number of customers that could be surveyed. It is valid to argue that 100% response ratio is very rare and often only a proportion of the people who are invited to take part in a survey would actually participate. From the 1,000 potential respondents that had been invited, only 300 agreed to participate. Hence, the response ratio is equal to 30%.
The next limitation concerns the number of banks that could be analysed. Besides the large financial institutions, there are smaller banks that could also be used in the study. However, increasing the sample would mean collecting data from banks for which not much information is available at present.
The next limitation is the quality of the responses. The research project has not been insured against the respondents’ bias and errors. Since a number of questions were constructed using a Likert scale, there is a chance that customers could overreact or under react to certain statements.
Finally, it is valid to mention the limitations that relate to the methods of data analysis. The regression had a low indicator of goodness of fit, which has threatened the viability of the results. The trends in consumer loyalty to banks was established using the method of historical extrapolation but this method does not guarantee that the actual changes in customer loyalty will be in line with the trend.
The ANOVA test is limited in its ability to compare customer loyalty of different groups of respondents. Its results are only based on the changes in the variance of responses and if these variances do not coincide, the statistics indicate the lack of association. Similarly, there are limitations with the t-test that was used in regression analysis. Its value may become inaccurate if there is a problem with serial correlation and multicollinearity. For this reason the Durbin Watson test was applied. It was needed to show the absence of serial correlation. The test indicates the absence of serial correlation when its value is approaching 2.
Chapter Four: Findings and Analysis
This chapter provides the analysis of the results. The analysis is conducted in SPSS using statistical tools and instruments. The analytical techniques used in the chapter include the analysis of variance (ANOVA), t-test, chi-square test, correlation analysis and regression analysis. ANOVA is used to find the differences in the customer loyalty between the different demographic groups of the respondents. Regression analysis is used to determine the factor that affected customer loyalty to banks after the economic recession in the UK.
4.1. Bank Performance after Recession
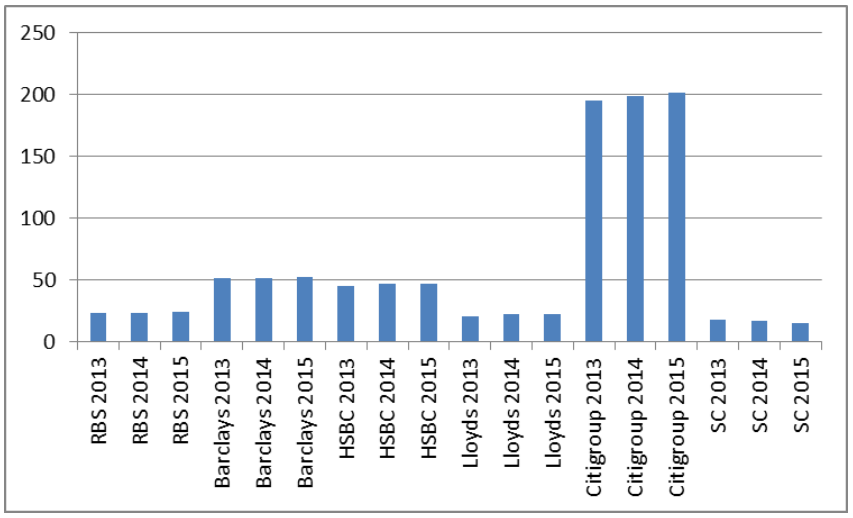
Customer loyalty to banks after the economic recession is likely to change because the crisis has had an impact on the performance of the major banks. The following figure reports that the revenue in several large banks such as the Royal Bank of Scotland, Barclays and HSBC declined in 2008.
Figure 1: Revenue of Banks
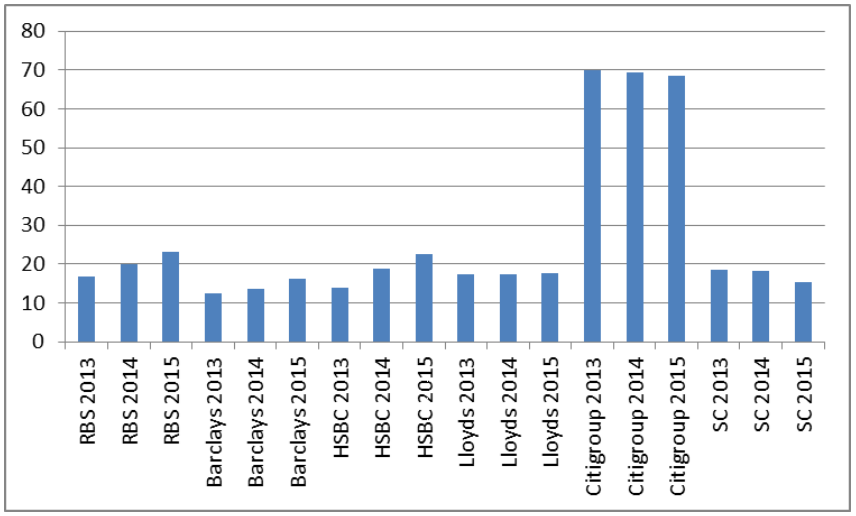
Source: Annual Reports of Banks
In Citigroup, the decline in total revenue was observed in 2014 and 2015. However, at the same time some banks such as the Lloyds did not see a decline in revenue in the post-crisis period. By 2015, other banks started showing signs of expansion as the figure above suggests.
However, revenue only demonstrates the size of the economic activity of the banks but it fails to reflect the financial performance of the institutions. This indicator has been captured with net profits for the period from 2013 to 2015 (Figure 2).
Figure 2: Net Profit of Banks
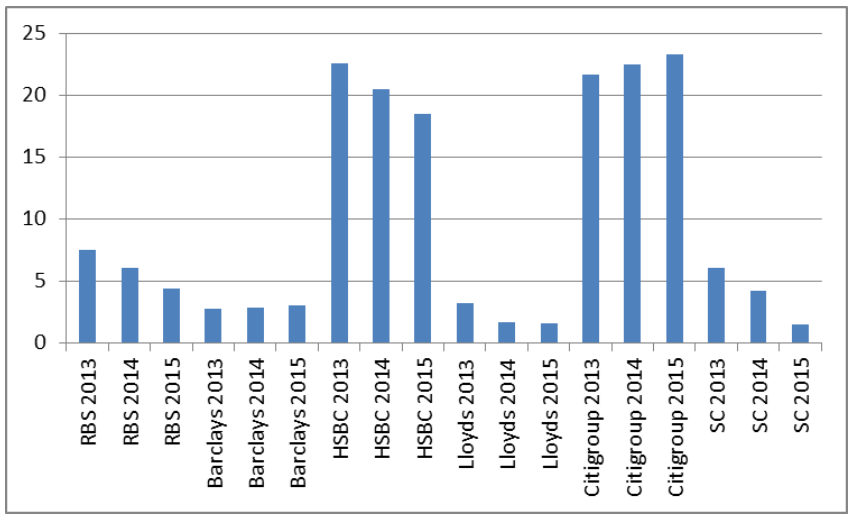
Source: Annual Reports of Banks
None of the six analysed banks have shown net losses after the periods of economic recession in the UK. HSBC and Citigroup reported the most considerable profits comparing to the remaining commercial banks in the post-crisis period. The core operations of the banks are represented by lending to customers and taking deposits (Figure 3 and Figure 4).
Figure 3: Deposits with Banks
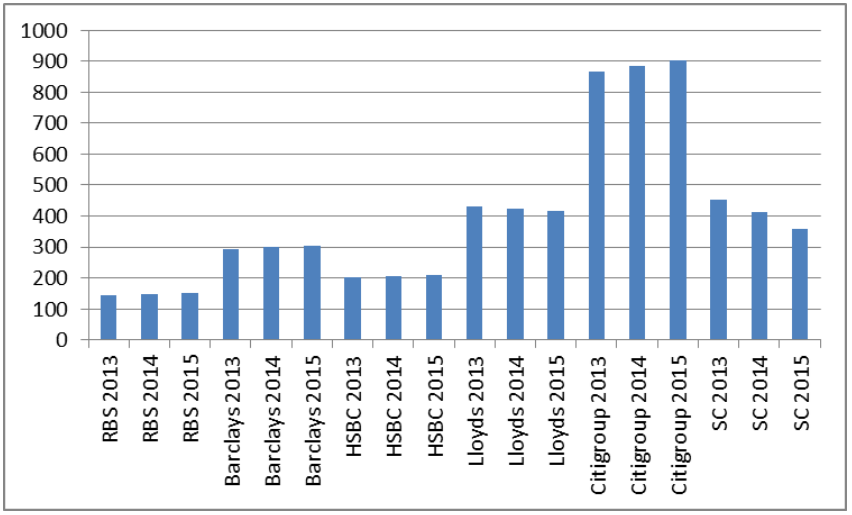
Source: Annual Reports of Banks
In some banks such as Citigroup, the core operations remained strong and the companies attracted more deposits from customers. However, others such as Barclays, Lloyds and Standard Chartered suffered a decline in the core operations as well. The credit crunch caused a negative impact on the availability of loans but a number of large banks continued demonstrating increasing values of total loans to customers (Figure 4).
Figure 4: Loans to Customers
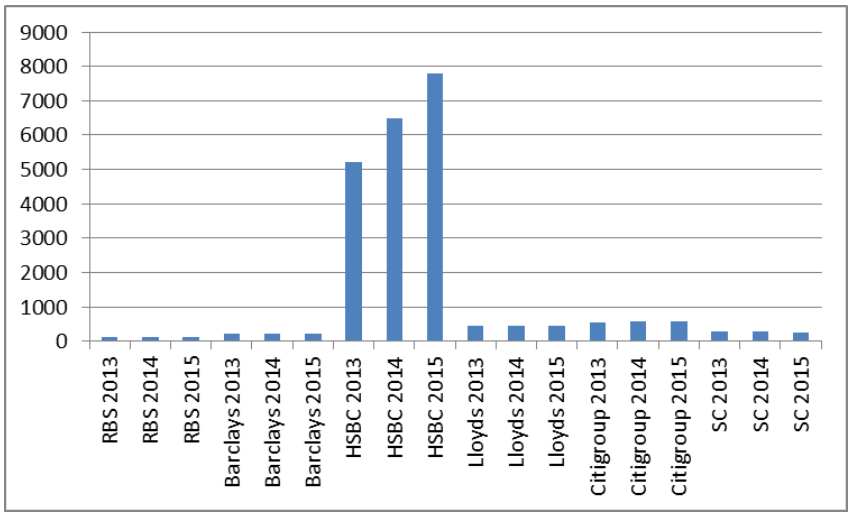
Source: Annual Reports of Banks
The number of customers, in spite of the economic recession, has been growing in most of the large banks.
Figure 5: Number of Customers
Source: Annual Reports of Banks
The largest bank in terms of the customers served is Citigroup. The figure above shows the approximate changes in the number of customers from 2010 to 2015 based on the estimates of the bank provided in the annual report. The Group saw a slight increase in the number of customers after the economic crisis. In HSBC, Lloyds and Standard Chartered, the number of customers has been increasing on average by 2.5% per annum. In Barclays, the number of customers has shown a positive change equal to 10% a year. Royal Bank of Scotland was another dynamically growing company, with their customer base increasing by approximately 11% a year.
It is valid to notice the lack of strong correlation between bank performance and the number of customers. In spite of the weak results demonstrated by the Royal Bank of Scotland and HSBC in 2014 and 2015, the number of customers at both banks increased. However, it may also be noticed that an increase in customers was also found in Lloyds who did relatively well during and after the recession. This evidence suggests that there is little correlation between the performance of financial institutions and the number of customers they attract.
4.2. Analysis of Customer Loyalty to Banks
Three hundred random customers in the UK have taken part in a survey that was aimed at finding the changes in customer loyalty to financial institutions after the economic recession. The sample has been divided into six groups differentiated by the primary bank. Each group was comprised of a sufficient number of customers to make the sample representative. The results are summarised in the following frequency table.
Table 1: Groups of Customers by Primary Bank
Primary Bank
| Frequency* | Percent | Valid Percent | Cumulative Percent | |
| RBS Barclays HSBC Citigroup Lloyds SC Total | 54 47 55 45 51 48 300 | 18.015.7 18.3 15.0 17.0 16.0 100.0 | 18.015.7 18.3 15.0 17.0 16.0 100.0 | 18.0 33.7 52.0 67.0 84.0 100.0 |
*Number of respondents
The largest subsample of respondents was comprised of the HSBC customers. However, other groups of customers were not that much smaller in size and the sample can be considered quite representative of the population.
The customers that were surveyed were also found to have different lengths of experience with their primary bank (Table 2).
Table 2: Experience as a Customer
How long have you been a customer of the bank?
| Frequency | Percent Valid | Percent | Cumulative Percent | |
| Less than a year 1-3 years 3-5 years More than 5 years Total | 65 83 71 81 300 | 21.727.7 23.7 27.0 100.0 | 21.727.7 23.7 27.0 100.0 | 21.7 49.3 73.0 100.0 |
The table reports that the largest customer group had 1 to 3 years’ worth of experience with their primary bank. These customers constituted almost thirty per cent of the sample. The smallest group had the shortest experience of less than a year.
The customers were represented by different age groups that were broadly divided into 18-21, 22-29, 30-40, 41-50 and older than 50 (Table 3).
Table 3: Age of Customers
Age
| Frequency | Percent Valid | Percent | Cumulative Percent | |
| 18-21 22-29 30-40 41-50 Above 50 Total | 74 55 50 69 52 300 | 24.718.3 16.7 23.0 17.3 100.0 | 24.718.3 16.7 23.0 17.3 100.0 | 24.7 43.0 59.7 82.7 100.0 |
The largest demographic group was comprised of young customers between eighteen and twenty one who constituted almost a quarter of the sample. This can be explained by more willingness of the young customers to participate in the survey in comparison to older demographic groups.
Male respondents were also found to be more active in the research as the following table suggests.
Table 4: Gender
Gender
| Frequency | Percent Valid | Percent | Cumulative Percent | |
| Male Female Total | 158 142 300 | 52.747.3 100.0 | 52.747.3 100.0 | 52.7 100.0 |
The sample is almost equally divided between males and females; however, the latter constitute 47% of the sample while the former comprise up to 53% of the sample. The customers were represented by different income groups. The average annual income of the two largest groups of respondents was from £25,000 to £34,999 and from £50,000 to £69,999 (Table 5).
Table 5: Annual Income
| Frequency | Percent Valid | Percent | Cumulative Percent | |
| Less than £25,000 £25,000 – £34,999 £35,000 – £49,999 £50,000 – £69,999 More than £70,000 Total | 55 65 56 65 59 300 | 18.321.7 18.7 21.7 19.7 100.0 | 18.321.7 18.7 21.7 19.7 100.0 | 18.3 40.0 58.7 80.3 100.0 |
In terms of education, the sample was almost equally divided among the respondents who only finished school, those who attended university but did not get a degree, those who got an undergraduate degree and those with a postgraduate degree.
Table 6: Education
Education
| Frequency | Percent Valid | Percent | Cumulative Percent | |
| High School College courses Undergraduate Postgraduate Total | 73 77 77 73 300 | 24.325.7 25.7 24.3 100.0 | 24.325.7 25.7 24.3 100.0 | 24.3 50.0 75.7 100.0 |
The analysis of the respondents’ occupation has shown that the majority of the people surveyed performed non-skilled manual labour.
Table 7: Job Position
| Frequency | Percent Valid | Percent | Cumulative Percent | |
| Non-skilled Skilled manual Skilled non-manual Manager Total | 87 74 67 72 300 | 29.024.7 22.3 24.0 100.0 | 29.024.7 22.3 24.0 100.0 | 29.0 53.7 76.0 100.0 |
Non-skilled labour force comprised almost thirty per cent of the total sample. The smallest group of respondents was represented by those who performed a skilled nonmanual labour, i.e. professionals such as engineers.
The customers were also asked how many banks they bank with. The breakdown of the responses is presented in the following table.
Table 8: Number of Banks Customer Bank with Number of Banks Customers Bank with
| Frequency | Percent Valid | Percent | Cumulative Percent | |
| 1 2 3 4 5 and more Total | 152 62 44 31 11 300 | 50.720.7 14.7 10.3 3.7 100.0 | 50.720.7 14.7 10.3 3.7 100.0 | 50.7 71.3 86.0 96.3 100.0 |
Over fifty per cent of the sample banked with predominantly one financial institution. More than twenty per cent of the respondents were found to be customers of two banks.
14.75 of the customers banked with three banks and 10% of the respondents had up to four banks. The respondents who were the customers of more than five banks comprised less than 4% of the total sample. The predominance of the population who bank with a single bank indicates rather strong customer loyalty towards the institutions.
The respondents have been asked to rate their satisfaction with their banks. The scale was from 1 (the lowest satisfaction) to 5 (the highest satisfaction). The results are summarised below.
Table 9: Customer Satisfaction with Bank Services
Satisfaction with Bank
Services
| Frequency | Percent Valid | Percent | Cumulative Percent | |
| 1.00 2.00 3.00 4.00 5.00 Total | 659 58 116 61 300 | 2.019.7 19.3 38.7 20.3 100.0 | 2.019.7 19.3 38.7 20.3 100.0 | 2.021.7 41.0 79.7 100.0 |
The majority of the customers (39% of the respondents) have agreed that they were satisfied with their primary banks. Up to 20% of the customers even strongly agreed with this statement. Hence, almost 60% of the banks’ customers were found to be mostly satisfied and unwilling to change their primary banks. However, almost twenty per cent of the respondents did not demonstrate any satisfaction with bank services and 19% of the customers could neither agree nor disagree.
The survey of the banks’ customers has revealed that there are many factors that can affect consumer loyalty to financial institutions. Among the multiple choices of answers, the respondents selected the following.
Table 10: Factors Determining Customer Loyalty to Banks
Factors of Customer Loyalty to Banks
| Frequency | Percent Valid | Percent | Cumulative Percent | |
| Good customer service Internet and mobile service Bank’s charges Account types and offers Location Total | 67 58 60 64 51 300 | 22.3 19.3 20.0 21.3 17.0 100.0 | 22.3 19.3 20.0 21.3 17.0 100.0 | 22.3 41.7 61.7 83.0 100.0 |
More than twenty per cent of the customers believed the good customer service produced loyalty to banks. This was the most popular answer in comparison to other choices. The least popular answer was that customer loyalty was determined by the location of the bank. However, for as many as 17% of the respondents, the location of the bank played an important role.
The customers in the banks were asked to share their thoughts on how the economic recession impacted on their behaviour and habits. The results are summarised below.
Table 11: Impact of Economic Recession on Consumer Behaviour
Impact of Economic Recession on Consumer Behaviour
| Frequency | Percent Valid | Percent | Cumulative Percent | |
| Less shopping and spending Changed Bank Increased Savings Has not Changed Total | 143 44 42 71 300 | 47.7 14.7 14.0 23.7 100.0 | 47.7 14.7 14.0 23.7 100.0 | 47.7 62.3 76.3 100.0 |
The majority of the respondents, which comprised almost 48% of the sample, stated that they reduced their spending and spent less time on shopping. Only 15% of the respondents indicated that they had to change their bank. This finding suggests that the majority of the customers still remained loyal to their primary banks in spite of the economic recession that overtook the United Kingdom. It is also interesting to note that almost 24% of the customers stated that their behaviour has not changed significantly. Only 14% of the respondents increased their savings, which speaks of the crisis in the savings rates especially during the economic recession.
4.3. The Impact of Economic Recession on Customer Loyalty to Banks
The impact of the economic recession on customer loyalty to banks has been measured by the regression of the variables that represented the willingness of customer to change their primary bank on a number of factors that relate to demographics and economics. This variable is represented by Question 9 from Appendix for which the chart is provided below.
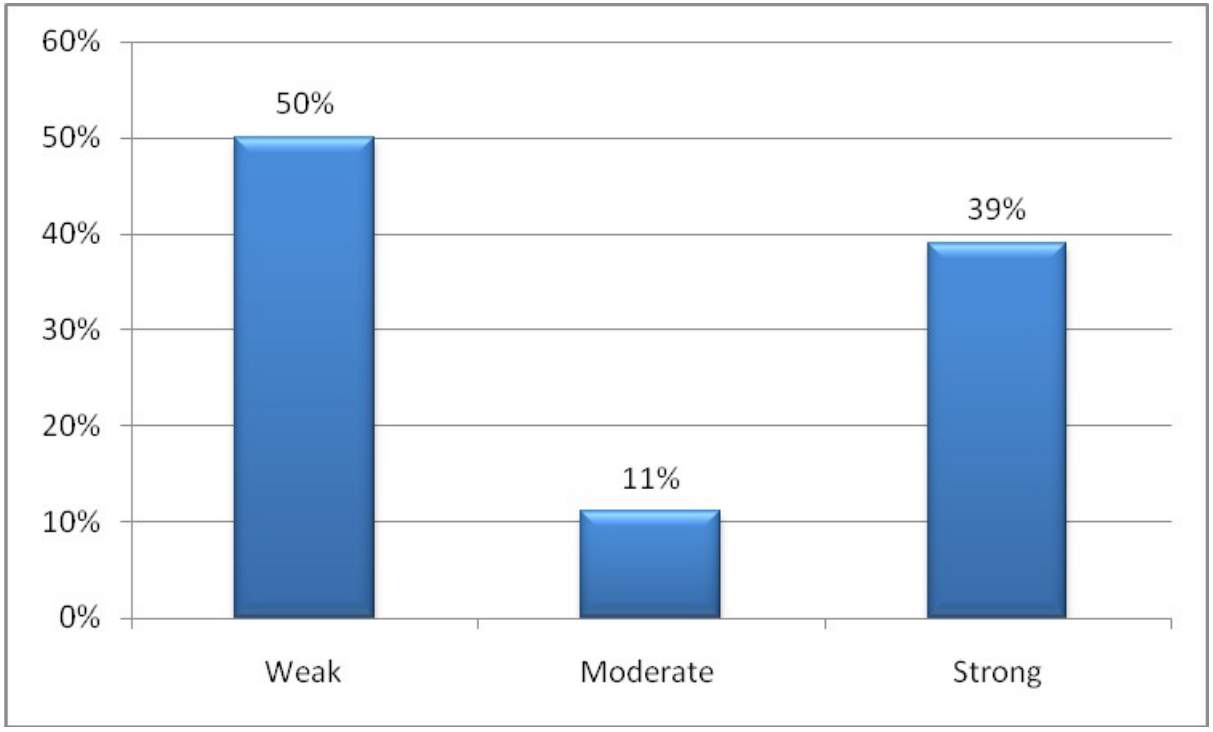
Figure 6: I have considered changing my primary bank after the economic recession
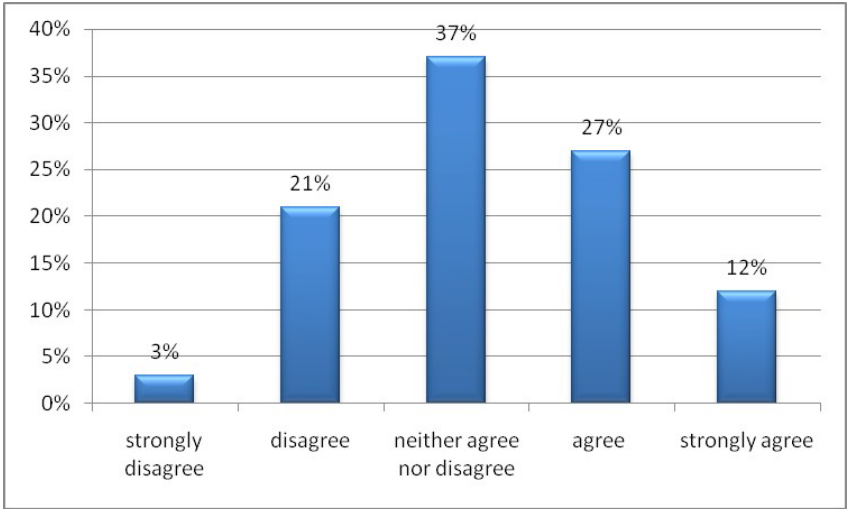
Up to 39% of the customers were found to agree and strongly agree with this statement while up to 37% of respondents could not provide a definite answer. Only 24% of respondents disagreed and strongly disagreed.
The backward elimination method of regression has been used, i.e. maximum factors are included in the first regression and they are gradually removed from the model using the t-test. The estimated coefficients at the first step of the regression are shown below.
Table 12: Impact of Factors on Customer Loyalty to Banks (Step 1)
Coefficients*
| Model | Unstandardized Coefficients | Standardized Coefficients | t | Sig. | |
| B | Std. Error | Beta | |||
| 1 (Constant) Q1 Q2 Q3 Q4 Q5 Q6 Q8 Q10 Q12 Q13 Q14 | 3.252 -.089 -0.16 .101 -.043 .059 -.060 .079 -.028 .058 -.119 .006 | .643.076 .058 .166 .060 .075 .074 .078 .060 .058 .059 .067 | -.069 -.016 .035 -.043 .046 -.048 .060 -.028 .058 -.117 .005 | 5.054-1.168 -.271 .606 -.727 .788 -.804 1.003 -.473 1.000 -1.998 .087 | .000 .244 .787 .545 .468 .432 .422 .317 .637 .318 .047 .931 |
a. Dependent Variable: Q9
Q1 – Q14 represent the index number of the question, which can be assessed in Appendix. The t-test has shown that customer loyalty depended on the factors such as good customer service, good Internet and mobile banking service, bank charges, account types, bank offers and the location of the bank. The model summary is presented below.
Table 13: Model Summary
Model Summary
| Model | R | R Square | Adjusted R Square | Std. Error of the Estimate | Durbin-Watson |
| _1 | .190 ͣ | .036 | -.001 | 1.42264 | 1.961 |
The model had an adequate indicator of Durbin-Watson statistics that suggests that there is no problem regarding serial correlation but the fit of the regression was quite low. The next step was to remove the worst three independent variables, i.e. those with the highest p-values of the t-test.
Table 14: Impact of Factors on Customer Loyalty to Banks (Step 2)
Coefficients
| Model | Unstandardized Coefficients | Standardized Coefficients | t | Sig. | |
| B | Std. Error | Beta | |||
| 1 (Constant) Q1 Q4 Q5 Q6 Q8 Q12 Q13 Q14 | 3.294 -.087 -.043 .058 -.063 .075 .056 -.120 .010 | .559.075 .059 .075 .073 .078 0.57 .058 .066 | -.068 -.043 .045 -.051 .057 .057 -.119 .008 | 5.892-.1.154 -.727 .779 -.860 .967 .983 -2.059 .147 | .000 .249 .468 .437 .391 .334 .326 .040 .883 |
a. Dependent Variable: Q9
Table 15: Model Summary
Model Summary
| Model | R | R Square | Adjusted R Square | Std. Error of the Estimate | Durbin-Watson |
| _1 | .184 ͣ | .034 | .007 | 1.41681 | 1.955 |
a. Predictors: (Constant), Q14, Q6, Q12, Q5, Q13, Q4, Q1,Q8
b. Dependent Variable: Q9
The changes in the model did not make other independent variables significant. The following step implies eliminating three more variables.
Table 16: Impact of Factors on Customer Loyalty to Banks (Step 3)
Coefficients*
| Model | Unstandardized Coefficients | Standardized Coefficients | t | Sig. | |
| B | Std. Error | Beta | |||
| 1 (Constant) Q1 Q6 Q8 Q12 Q13 | 3.311 -.090 -.068 .086 .057 -.122 | .461.075 .073 .077 .057 .058 | -.070 -.055 .066 .058 -.121 | 7.817-1.206 -.928 1.131 .995 -2.099 | .000 .229 .354 .259 .320 .037 |
a. Dependent Variable: Q9
Table 17: Model Summary
Model Summary
| Model | R | R Square | Adjusted R Square | Std. Error of the Estimate | Durbin-Watson |
| _1 | .173 ͣ | .030 | .013 | 1.41251 | 1.951 |
a. Predictors: (Constant), Q13, Q1, Q8, Q12, Q6
b. Dependent Variable: Q9
As a result of the transformation, the Durbin-Watson statistic has not changed significantly but the R-squared has worsened. The independent variable was found to be significant in all three steps of the regression. Based on the R-squared, the first regression model is considered the best.
It was also important to track the trends and changes in the customer loyalty to banks since 2010. For this reason the customers were asked to agree or disagree with the following statement.
Figure 7: My loyalty to bank has been constantly increasing since 2010
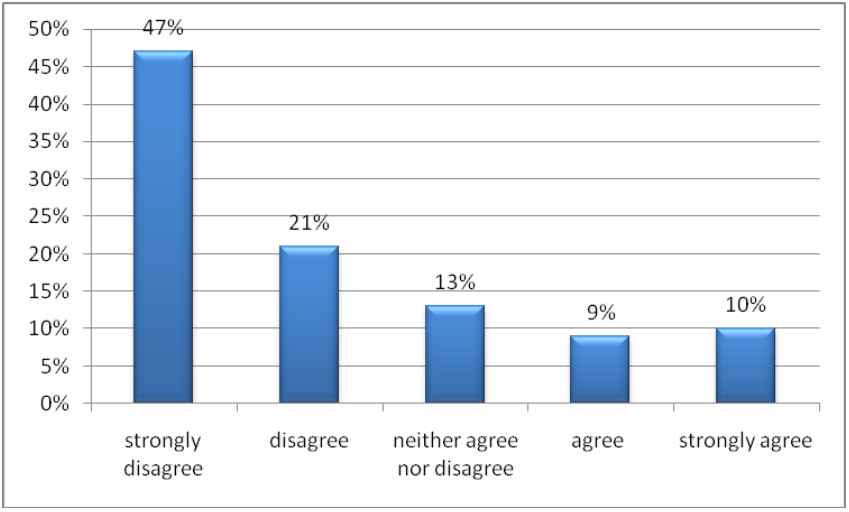
Almost fifty percent of customers strongly disagreed and more than twenty per cent of the respondents disagreed that they loyalty has been constantly increasing. In fact, when asked in what year the customers considered changing their bank, the following results were obtained.
Figure 8: Trend of Customer Loyalty to Banks
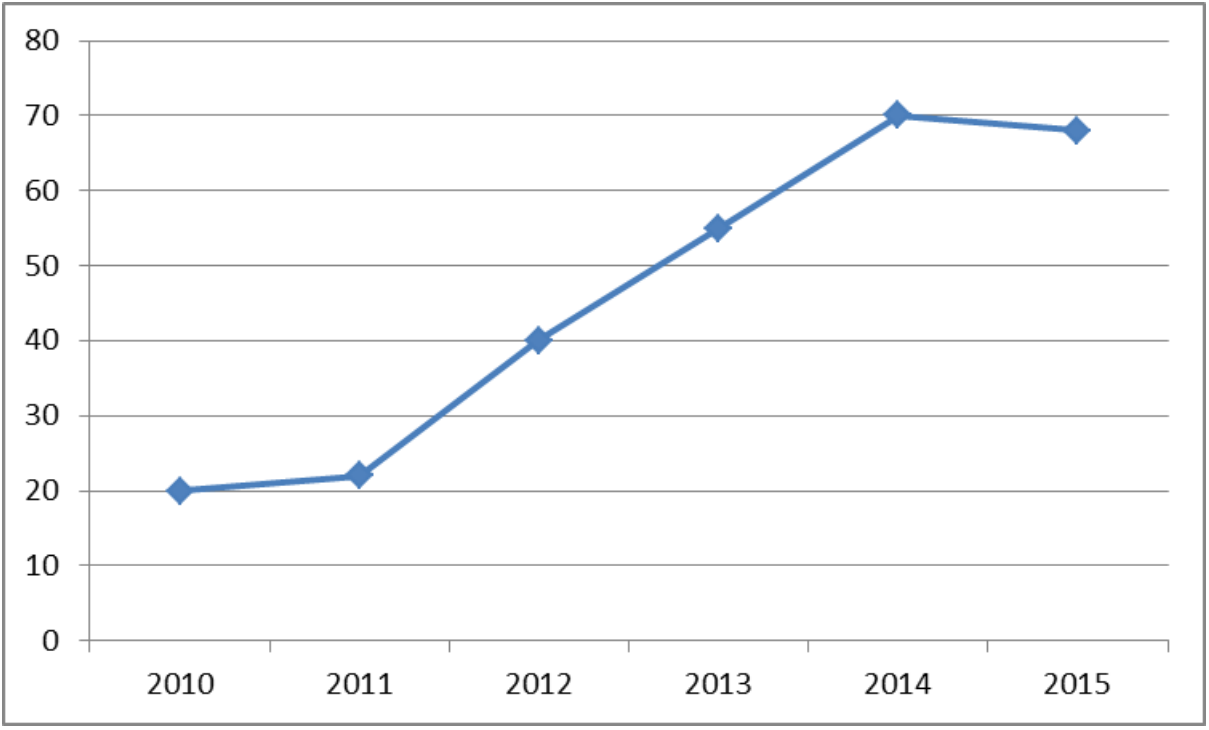
In 2010, only 20% of the respondents considered changing their bank, which demonstrated the lack of loyalty. However, by 2014 this percentage had grown to almost 70%. Based on historical values, a linear trend has been identified. It forecasts that the customer dissatisfaction with the bank services and their willingness to change banks may increase up to more than 80%. However, since the company related factors were found to influence the customer loyalty, it can be forecasted that during the next five years the loyalty can be improved and dissatisfaction can be reduced if the banks implemented effective strategies for developing customer loyalty. One of the main aspects that should be looked at is the corporate image of the banks and the news that customers receive about the financial institution because the survey has revealed that 39% of the customers are very sensitive to the negative information they receive about the bank from public sources.
Figure 9: Impact of published information about banks on the customer loyalty
Furthermore, half of the respondents agreed that positive information stimulates their loyalty to the bank.
Another way to establish the degree of association amongst customer loyalty and its factors is to construct a correlation matrix. It is demonstrated below.
Table 18: Correlation Matrix
Correlations
| Q7 | Q8 | Q9 | Q10 | Q11 | Q12 | Q13 | Q14 | |
| Q7 Pearson Correlation Sig. (2-tailed) N | 1 300 | -.002.973 300 | .017.771 300 | -.044.451 300 | .082.154 300 | .032.575 300 | .034.559 300 | -.053.363 300 |
| Q8 Pearson Correlation Sig. (2-tailed) N | -.002 .973 300 | 1 300 | .065.262 300 | .012.842 300 | -.020.731 300 | -.102.079 300 | .016.777 300 | .028 .632 300 |
| Q9 Pearson Correlation Sig. (2-tailed) N | .017 .771 300 | .065.262 300 | 1 300 | -.028.634 300 | -.026.653 300 | .043.458 300 | -.114.049 300 | .001 .987 300 |
| Q10 Pearson Correlation Sig. (2-tailed) N | -.044 .451 300 | .012.842 300 | -.028.634 300 | 1 300 | -.044.445 300 | -.021.719 300 | .1310.23 300 | -.068 .242 300 |
| Q11 Pearson Correlation Sig. (2-tailed) N | .082 .154 300 | -.020.731 300 | -.026.653 300 | -.044.445 300 | 1 300 | -.011.846 300 | -.050.392 300 | -.010 .859 300 |
| Q12 Pearson Correlation Sig. (2-tailed) N | .032 .575 300 | -.102.079 300 | .043.458 300 | .021.719 300 | -.011.846 300 | 1 300 | .061.291 300 | .014 .813 300 |
| Q13 Pearson Correlation Sig. (2-tailed) N | .034 .559 300 | .016.777 300 | -.114.049 300 | .131.023 300 | -.050.392 300 | 0.61.291 300 | 1 300 | 0.43 .457 300 |
| Q14 Pearson Correlation Sig. (2-tailed) N | -.053.363 300 | .028.632 300 | .001.987 300 | -.068.242 300 | -.010.859 300 | 0.14.813 300 | .043.457 300 | 1 300 |
*. Correlation is significant at the 0.05 level(2-tailed).
The estimated coefficients have shown that none of the variables were found to be significantly correlated. This can be explained by the random sampling used in the research and multiple factors that determine customer loyalty. On the one hand, the lack of correlation amongst these variables indicates that there is no significant relationship between the economic factors and customer loyalty to banks. On the other hand, it is valid to argue that the correlation only shows associations between the variables and fails to reveal causal relations. That is why additional research is required besides the correlation analysis.
The respondents were asked how many banks they bank with. It was assumed that this factor would also affect their loyalty to their primary bank. After all, if customers use the services of many banks, they tend to be less loyal to each individual bank. The results of the ANOVA test that compares the relations between the number of banks and the customer loyalty are reported below.
Table 19: Analysis of Variance (ANOVA) by Number of Banks
ANOVA
Customer Loyalty to Banks
| Sum of squares | df | Mean Square | F | Sig. | |
| Between GroupsWithin Groups Total | 14.914 589.682 604.597 | 4 295 299 | 3.7291.999 | 1.865 | .117 |
The test has supported the null hypothesis that there were no differences in the mean answers, i.e. customer loyalty was not found to be stronger among those who banked with a single bank in comparison to those who banked with several banks. This can be explained by the fact the needs of the individual customers that use services of several banks are not determined by dissatisfaction with the services of other banks. The following section tests whether customer loyalty was different amongst the demographic groups.
4.4. Demographic Factors and Customer Loyalty to Banks
In order to find the differences in customer loyalty to banks between the demographic groups, the chi-square test was applied and cross tabs were constructed.
Table 20: Customer Loyalty and Experience
Crosstab
Count
| Experience | Total | ||||
| 1.00 | 2.00 | 3.00 | 4.00 | ||
| Loyalty 1.00 2.00 3.00 4.00 5.00 Total | 11 10 16 12 16 65 | 1715 13 23 15 83 | 1211 19 15 14 71 | 2215 13 16 15 81 | 62 51 61 66 60 300 |
Table 21: Chi-Square Test
Chi-Square Tests
| Value | df | Asymp. Sig. (2-sided) | |
| Pearson Chi-squareLikelihood Ratio Linear-by-Linear Association N of Valid Cases | 9.342 ͣ9.115 1.767 300 | 1212 1 | .673.693 .184 |
a. 0 cells (.0%) have expected count less than 5. The minimum expected count is 11.05.
The two tables above have reported that there is no significant association between the customer loyalty and the years of experience with the bank. On the one hand, this contradicts the assumption that loyal customers would be long term customers. On the other hand, customer loyalty was assessed after the recession and the variables indicated the intention of customers to change their primary bank. Hence, it could be the case that experience with the bank was not a key variable that determined customer loyalty. The next table explores the relations between loyalty and the customers’age.
Table 22: Customer Loyalty and Age
Crosstab
Count
| Age | Total | |||||
| 1.00 | 2.00 | 3.00 | 4.00 | 5.00 | ||
| Loyalty 1.00 2.00 3.00 4.00 5.00 Total | 11 14 15 19 15 74 | 127 18 12 6 55 | 1310 9 10 8 50 | 1311 14 12 19 69 | 139 5 13 12 52 | 62 51 61 66 60 300 |
Table 23: Chi-Square Test
Chi-Square Tests
| Value | df | Asymp. Sig. (2-sided) | |
| Pearson Chi-squareLikelihood Ratio Linear-by-Linear Association N of Valid Cases | 17.109 17.557 .001 300 | 1616 1 | .379 .350 .980 |
a. 0 cells (.0%) have expected count less than 5. The minimum expected count is 8.50.
According to the chi-square statistic, these variables are not related and tend to be independent since the p-value is quite high (0.379). Similarly, customer loyalty was not found to be very different amongst males and females (Table 24).
Table 24: Customer Loyalty and Gender
Crosstab
Count
| Gender | Total | ||
| 1.00 | 2.00 | ||
| Loyalty 1.002.00 3.00 4.00 5.00 Total | 33 30 30 36 29 158 | 2921 31 30 31 142 | 62 51 61 66 60 300 |
Table 25: Chi-Square Test
Chi-Square Tests
| Value | df | Asymp. Sig. (2-sided) | |
| Pearson Chi-square Likelihood Ratio Linear-by-Linear Association N of Valid Cases | 1.626 ͣ 1.630 .402 300 | 44 1 | .804 .803 .526 |
a. 0 cells (.0%) have expected count less than 5. The minimum expected count is 24.14.
When the customers were divided into groups determined by the size of their annual income, customer loyalty was not found to be dependent on the income of the respondents (Table 26 and Table 27).
Table 26: Customer Loyalty and Annual Income
Crosstab
Count
| Annual Income | Total | |||||
| 1.00 | 2.00 | 3.00 | 4.00 | 5.00 | ||
| Loyalty 1.00 2.00 3.00 4.00 5.00 Total | 11 9 8 12 15 55 | 139 8 12 15 55 | 138 15 10 10 56 | 1513 14 16 7 65 | 1012 10 16 11 59 | 62 51 61 66 60 300 |
Table 27: Chi-Square Test
Chi-Square Tests
| Value | df | Asymp. Sig. (2-sided) | |
| Pearson Chi-SquareLikelihood Ratio Linear-by-LinearAssociation N of Valid Cases | 11.974* 12.305 . 993 300 | 1616 1 | .746 .723 .319 |
a. 0 cells (.0%) have expected count less than 5. The minimum expected count is 9.35.
These findings are consistent with the results from regression analysis. The last two variables that were tested for association with customer loyalty are education and occupation.
Table 28: Customer Loyalty and Education
Crosstab
Count
| Education | Total | ||||
| 1.00 | 2.00 | 3.00 | 4.00 | ||
| Loyalty 1.002.00 3.00 4.00 5.00 Total | 19 8 17 15 14 73 | 1812 17 13 17 77 | 1717 9 19 15 77 | 814 18 19 14 23 | 62 51 61 66 60 300 |
Table 29: Chi-Square Test
| Value | df | Asymp. Sig. (2-sided) | |
| Pearson Chi-SquareLikelihood Ratio Linear-by-LinearAssociation N of Valid Cases | 13.652 ͣ 14.872 1.173 300 | 1212 1 | .323 .249 .279 |
a. 0 cells (.0%) have expected count less than 5. The minimum expected count is 12.41.
According to the chi-square test, neither education (Table 29) nor occupation (Table 31) show significant relations with customer loyalty to the banks.
Table 30: Customer Loyalty and Occupation
Crosstab
Count
| Job Position | Total | |||||
| 1.00 | 2.00 | 3.00 | 4.00 | |||
| Loyalty 1.002.00 3.00 4.00 5.00 Total | 14 16 20 19 18 87 | 1410 18 18 14 74 | 1411 14 14 14 67 | 2014 9 15 14 72 | 62 51 61 66 60 300 | |
Table 31: Chi-Square Test
Chi-Square Tests
| Value | df | Asymp. Sig. (2-sided) | |
| Pearson Chi-SquareLikelihood Ratio Linear-by-LinearAssociation N of Valid Cases | 7.079 7.307 1.511 300 | 1212 1 | .852 .837 .219 |
a. 0 cells (.0%) have expected count less than 5. The minimum expected count is 11.39.
From these analyses, it can be concluded that customer loyalty in the banking industry after the economic recession is not determined or affected by demographic factors but is rather dependent on the bank related factors and economic issues. The following chapter summarises the main conclusions from the research and provides recommendations to the management of the banks.
Chapter Five: Conclusions
This chapter provides a summary of the findings that were achieved in the research project. These findings are compared to the results of previous empirical studies and theoretical works. Final conclusions are drawn from the discussion and recommendations are made.
The purpose of the research was to find out the impact of economic recession on customer loyalty to banks in the UK. This aim has been reached using the methods of statistical analysis applied to primary and secondary data. The methods of analysis that were implemented in the research included regression, correlation, analysis of variance and chi-square tests. The data has been collected and analysed for the period from 2010 to 2015.
The first objective of the dissertation was to discuss the theoretical frameworks of customer loyalty. This objective was reached in the literature review. Using the findings from the literature review, it can be summarised that the Four C’s of Customer Loyalty are captive, convenience-seeker contented and committed. Captive customers have loyalty to specific brands, but they make repeat purchases only because they are limited in their choice. Convenience-seeker customer loyalty implies that brand choice is determined by manifold convenience factors such as opening hours, location, bank teller machines, package size, etc. Contented customers have stable relationships with companies, but they do not naturally react to brand extensions. Committed customer loyalty is associated with positive consumer behaviour and strong and stable relationships between brands and buyers. The main internal determinants of customer loyalty were found to be individual consumer characteristics, psychographics and demographics, individual expectations and previous experience. However, the role of demographics in the development of customer loyalty was not supported with the findings from the primary research. The results have revealed that customer loyalty was independent of the demographic factors.
The most important external determinants of customer loyalty that were found through the literature review are the company’s reputation, image, involvement and participation, price-quality ratio and the appropriate use of customer loyalty programmes.
Critical discussion of the relevant empirical evidence has revealed that customer loyalty in the banking sector is determined by such factors as customer satisfaction, perceived service quality, individual expectations, previous experience of clients, customer involvement, availability of special services to regular clients, customer service, technology convenience, technology security and positive recommendations given by friends and relatives. Taking into account that customer loyalty to financial institutions decreased during the global recession, it is possible to summarise that financial stability, performance of banks and personal income level prove to be other important factors influencing customer loyalty.
The next objective of the research project was to discuss the changes in the UK financial sector after the global financial crisis and economic recession. This objective has been reached through the analysis of secondary data retrieved from annual reports of the largest banks operating in the country.
The findings have reported that the largest banks in the UK saw a decrease in profitability in 2013 and 2014. However, this decline in performance was not found to be a result of the core operations because the values of loans and deposits had increased. Furthermore, the number of customers in the majority of the banks continued to grow. Even though customers in the banks increased, the results also revealed that loyalty to the financial institutions after the economic recession had substantially declined.
The third objective of the study was to assess customer satisfaction with the banks and loyalty to them. In the literature review it was shown that customer satisfaction was one of the main factors of customer loyalty and it was argued that it is impossible to develop strong customer loyalty without customer satisfaction ( Longbottom and Hilton, 2011: 39; Bennett and Kottasz, 2012:128; Fraering and Minor, 2013:334). About 40% of the respondents were found to have low satisfaction with the banks’ services. Up to 60% of the customers were mostly satisfied. When these customers were asked if they considered changing the primary bank after the economic recession, 39% of the respondents showed agreement and even strong agreement. Only 24% of the customers didn’t consider changing their primary bank after the recession. However, it is also valid to argue that a large part of the respondents, i.e. 37%, neither agreed nor disagreed with the statement and therefore could not provide a specific answer. Nevertheless, customer loyalty was found to have decreased because more customers were considering changing their bank.
The fourth objective was to assess how customer loyalty has changed since 2010 and what forecasts could be made on the basis of the current trends. The customers were asked to agree or disagree with the statement that their loyalty to the banks had increased since 2010 and was not impacted by recession. Forty seven percent of the customers strongly disagreed with this and twenty one per cent of respondents disagreed. Hence, a declining trend in customer loyalty to their banks has been found. Based on that trend, it has been forecasted that customer loyalty will continue to fall in 2016-2017 unless financial companies improve their financial performance and restore reputation. It has also been forecasted that over the next five years, customer loyalty will improve but it will be dependent on the actions taken by the companies to restore customer loyalty. Based on the findings of the research, practical recommendations have been developed to help financial companies to improve customer loyalty in the future. These are summarised in the last section of the chapter.
5.1. Recommendations
The results of the study have reported that customer loyalty decreased after the economic recession. This can be explained by changes in consumer behaviour and the economic life of households. Customer loyalty, however, was not found to be dependent on any demographic factors but solely on economic and company related issues. Therefore, it is recommended that the management of financial institutions should improve customer service, make online banking easier to use and more secure, expand the types of deposits available to consumers, improve the quality of the promotional offers to clients and provide benefits to the long term customers. These aspects have been found to be important according to the responses received from the participants in the research.
Customer service can be improved by training staff to treat customers with respect and by providing them with helpful services. It may also be recommended that banks should promptly respond to the questions that arise from the customers in emails or through complaints.
Online banking and mobile banking should also be improved in order to increase customer loyalty. The improvements can be realised by updating the software and creating a fast working server with secure coding of the information. Furthermore, in order to inspire more security in the customers, the banks can be recommended to introduce temporary passwords for online banking that would be sent via SMS messages to the clients every time they access online banking. The research originally has shown no correlation between financial performance of the companies and the number of customers they attract. However, companies can introduce better customer service even when their financial performance declines and, in fact, that will even help them to improve profitability and performance in the future.
Customer satisfaction and loyalty can be positively affected by the banks if they expand the number of offers that relate to loan and deposits. It can be recommended that more flexible loans should be introduced that will allow customers to choose the best timing and terms for repayment. Furthermore, it can be recommended that the number of different types of deposits should also be increased where customers would be offered higher interest rates on the deposits that they cannot withdraw for a certain period of time. At the same time, it can be recommended that flexibility in deposits should be the main factor for the banks to aim at.
It may also be recommended that strategies to increase customer loyalty should involve creative marketing campaigns and social networks. The banks can create a positive image and inspire trust amongst consumers that will eventually help them improve customer loyalty to banks. The main recommendations to the bank managers are summarised below:
• To lead an adequate risk management and avoid the mistakes made in the precrisis period which led to the deterioration of corporate governance, worsening profitability and, as a result, declining customer loyalty.
• To emphasise the importance of high quality customer service; this was found to be an important determinant of customer loyalty in the literature review.
• To expand the range of services.
• To create a positive image of the bank that would be perceived by consumers.
References
Baumann, C., Elliott, G. and Hamin, H. (2011) ‘Modelling customer loyalty in financial services: A hybrid of formative and reflective constructs’, International Journal of Bank Marketing, Vol. 29, Issue 3, pp. 247-267.
Bennett, R. and Kottasz, R. (2012) ‘Public attitudes towards the UK banking industry following the global financial crisis’, International Journal of Bank Marketing, Vol. 30, Issue 2, pp. 128-147.
Birgelen, M., Wetzels, M. and Ruyter, K. (1997) ‘Commitment in service relationships: an empirical test of antecedents and consequences’, EMAC Conference Proceedings, University of Warwick, pp. 1255-1271.
Bloemer, J., Ruyter, K. and Peeters, P. (1998) ‘Investigating drivers of bank loyalty: the complex relationship between image, service quality and satisfaction’, International Journal of Bank Marketing, Vol. 16 Iss: 7, pp.276 – 286
Bowen, J. and Chen, S. (2001) ‘The relationship between customer loyalty and customer satisfaction’, International Journal of Contemporary Hospitality Management, Vol. 13, Issue 5, pp. 213-217.
Bryman, A. and Bell, E. (2008) Business research methods, 2nd ed., Oxford: Oxford University Press.
Cahill, D. (2007) Customer loyalty in third party logistics relationships: findings from studies in Germany and the USA, New York: Springer.
Chung, J., Huang, Y., Jin, B. and Sternquist, B. (2011) ‘The impact of market orientation on Chinese retailers’ channel relationships’, Journal of Business & Industrial Marketing, Vol. 26, Issue 1, pp. 14-25.
Day, G. and Moorman, C. (2010) Strategy from the Outside In: Profiting from Customer Value, New York: McGraw-Hill Professional.
Dick, A. and Basu, K. (1994) ‘Customer loyalty: toward an integrated conceptual framework’, Journal of Marketing Science, Vol. 22, No. 2, pp. 99-113.
Duffy, D. (2003) ‘Internal and external factors which affect customer loyalty’, Journal of Consumer Marketing, Vol. 20, Issue 5, pp. 480-485.
Ehigie, B. (2006) ‘Correlates of customer loyalty to their bank: a case study in Nigeria’, European Management Journal, Vol. 16, No. 6, pp. 729-737.
Foss, B. and Stone, M. (2001) Successful Customer Relationship Marketing, London: Kogan Page.
Fraering, M. and Minor, M. (2013) ‘Beyond loyalty: customer satisfaction, loyalty, and fortitude’, Journal of Services Marketing, Vol. 27, Issue 4, pp. 334-344.
Ganguli, S. and Roy, S. (2011) ‘Generic technology-based service quality dimensions in banking: Impact on customer satisfaction and loyalty’, International Journal of Bank Marketing, Vol. 29, Issue 2, pp. 168-189.
Gritten, A. (2011) ‘New insights into consumer confidence in financial services’, International Journal of Bank Marketing, Vo. 29, Issue 2, pp. 90-106.
Hachicha, N. and Amar, A. (2015) ‘Does Islamic bank financing contribute to economic growth? The Malaysian case’, International Journal of Islamic and Middle Eastern Finance and Management, Vol. 8, Issue 3, pp. 349-368.
Hallowell, R. (1996) ‘The relationship of customer satisfaction, customer loyalty and profitability: an empirical study’, International Journal of Service Industries Management, Vol. 7, No. 4, pp. 27-42.
Jones, H. and Farquhar, J. (2009) ‘Putting it right: service failure and customer loyalty in UK banks’, International Journal of Bank Marketing, Vol. 25 Iss: 3, pp.161 – 172.
Kahn, B., Kalwani, M. and Morrison, D. (1988) ‘Niching versus change-of-pace brands: using purchase frequencies and penetration rates to infer brand positioning’, Journal of Marketing Research, Vol. 25, No. 4, pp. 384-390.
Kaura, V. and Datta, S. (2012) ‘Impact of Service Quality on Satisfaction in the Indian Banking Sector’, The IUP Journal of Marketing Management, Vol. 11, Issue 3, pp. 38-47.
Kaura, V., Prasad, C. and Sharma, S. (2015) ‘Service quality, service convenience, price and fairness, customer loyalty, and the mediating role of customer satisfaction’, International Journal of Bank Marketing, Vol. 33, Issue 4, pp. 404-422.
Keisidou, E., Sarigiannidis, L., Maditinos, D. and Thalassinos, E. (2013) ‘Customer satisfaction, loyalty and financial performance: A holistic approach of the Greek banking sector’, International Journal of Bank Marketing, Vol. 31, Issue 4, pp. 259-288.
Kincaid, J. (2003) Customer relationship management: getting it right!, London: Prentice Hall Professional.
Knox, S. (1998) ‘Loyalty based segmentation and the customer development process’, International Journal of Bank Marketing, Vol. 24, Issue 7, pp. 494-508.
Kracklauer, A., Mills, D. and Seifert, D. (2004) Collaborative customer relationship management: taking CRM to the next level, New York: Springer.
Krosnick, J. and Petty, R. (1995) Attitude strength: an overview, New Jersey: Lawrence Erlbaum Associates.
Lee, T., Chung, W. and Taylor, R. (2011) ‘A strategic response to the financial crisis: an empirical analysis of financial services advertising before and during the financial crisis’, Journal of Services Marketing, Vol. 25, Issue 3, pp. 150-164.
Longbottom, D. and Hilton, J. (2011) ‘Service improvement: lessons from the UK financial services sector’, International Journal of Quality and Service Sciences, Vol. 3 Iss: 1, pp.39 – 59.
Peck, H., Payne, A., Christopher, M. and Clark, M. (1999) Relationship Marketing: Strategy and Implementation, Oxford: Butterworth-Heinemann.
Peppers, D. and Rogers, M. (2004) Managing customer relationships: a strategic framework, New York: John Wiley and Sons.
Reinartz, W. and Kumar, V. (2002) ‘The mismanagement of customer loyalty’, Harvard Business Review, No. July, pp.86-94
Robson, C. (2002) Real World Research, 2nd ed., London: Sage.
Rowley, J. (2005) ‘The four Cs of customer loyalty’, Marketing Intelligence & Planning, Vol. 23, Issue 6, pp. 574-581.
Sangeetha, J. and Mahalingam, S. (2011) ‘Service quality models in banking: a review’, International Journal of Islamic and Middle Eastern Finance and Management, Vol. 4, Issue 1, pp. 83-103.
Saunders, M., Lewis, P. and Thornhill, A. (2009) Research methods for business students, 5th ed., Harlow: Prentice Hall.
Sayani, H. (2015) ‘Customer satisfaction and loyalty in the United Arab Emirates banking industry’, International Journal of Bank Marketing, Vol. 33, Issue 3, pp. 351-375.
Schweizer, B. (2008) An Examination of Factors Leading to Abating Customer Loyalty Towards Magazine Subscriptions, Berlin: GRIN Verlag.
Singh, M. and Waddell, D. (2004) E-business innovation and change management, New York: Idea Group Inc (IGI).
Stone, M., Woodcock, N. and Machtynger, L. (2000) Customer relationship marketing: get to know your customers and win their loyalty, 2nd ed., London: Kogan Page Publishers.
Timm, P. (2007) Customer Service: Career Success Through Customer Loyalty, 4th ed., New York: Prentice Hall.
Uncles, M., Dowling, G. and Hammond, K. (2003) ‘Customer loyalty and customer loyalty programs’, Journal of Consumer Marketing, Vol. 20, Issue 4, pp. 294-316.
Williams, P. and Naumann, E. (2011) ‘Customer satisfaction and business performance: a firm-level analysis’, Journal of Services Marketing, Vol. 25, Issue 1, pp. 20-32.
Appendix
Questionnaire
Q1: How long have you been a customer of the bank?
o Less than a year
o 1 – 3 years
o 3 – 5 years
o More than 5 years
Q2: What is your age?
o 18 – 21 years old
o 22 – 29 years old
o 30 – 40 years old
o 41 – 50 years old
o Older than 50 years old
Q3: What is your gender?
o Male
o Female
Q4: What is your annual income?
o Less than £25,000 a year
o £25,000 – £34,999 a year
o £35,000 – £49,999 a year
o £50,000 – £69,999 a year
o More than £70,000 a year
Q5: What is your education?
o High school
o Some college courses
o Undergraduate
o Post Graduate
Q6: What is your job?
o Non-skilled labour
o Skilled manual labour
o Skilled non-manual labour
o Managerial position
Q7: How many banks do you bank with?
o One
o Two
o Three
o Four
o Five or more
Q8: How would you rank your satisfaction with the bank services on a scale from 1 to 5 (5 being the best)?
o 1
o 2
o 3
o 4
o 5
Do you agree or disagree with the following statements:
Q9: I have not been loyal to my primary bank and even started considering changing the bank after the economic recession
o Strongly disagree
o Disagree
o Neither agree nor disagree
o Agree
o Strongly agree
Q10: I can tolerate minor mistakes at my bank and they do not affect my loyalty negatively
o Strongly disagree
o Disagree
o Neither agree nor disagree
o Agree
o Strongly agree
Q11: The bank did not satisfy my needs fully even before the recession and I considered changing it.
o Strongly disagree
o Disagree
o Neither agree nor disagree
o Agree
o Strongly agree
Q12: The bank’s services worsened during the economic recession
o Strongly disagree
o Disagree
o Neither agree nor disagree
o Agree
o Strongly agree
Q13: What factors affect your loyalty to a particular bank?
o Good customer service
o Good internet and mobile banking service
o Bank’s charges
o Account types and Bank’s offers
o Bank’s location
Q14: How did the economic recession impact your behaviour?
o I started shopping and spending less
o I have changed my bank
o I increased my savings in the bank
o My spending behaviour has not changed
Q15: What is your primary bank?
o Royal Bank of Scotland
o Barclays
o HSBC
o Citigroup
o Lloyds Banking Group
o Standard Chartered
Q16: How does the information that you obtain about the bank affect your attitude to the financial institution?
o Positive information and earnings announcements usually make me more confident with the bank and improve my loyalty
o I do not track such information and it has no impact on my loyalty to the bank
o I am more sensitive to negative information about the bank that appears in the press; such information can have a negative impact on trust and my loyalty to the bank.
Q17: My loyalty to the bank has been constantly increasing since 2010 and the economic recession has not had an impact on it.
o Strongly disagree
o Disagree
o Neither agree nor disagree
o Agree
o Strongly agree