An analysis of system dynamics (SD) modelling.
SYSTEM DYNAMICS MODELLING
1. INTRODUCTION
System Dynamics (SD) is known to help in clarifying mental models, thus making mental process easier when exploring both quantitative and qualitative aspects of a problem. However, is the system dynamic approach to problem solving the ideal way to aid decision making? The primary aim of this essay is, therefore, to explore the extent to which SD can help management with its decision making process and also identify any possible shortcomings of the methodology. To answer this question, this essay simulates a merger scenario, focusing on hiring and firing and organisational culture. The two topics will consider staff morale, clarity of individual roles and efficiency and effectiveness of their internal operations. Once explained, these examples will then be used to illustrate any limitations of SD and highlight specific policy insights to the problem. Inevitably, this essay should provide the reader with a thorough analysis of the impact of SD on management decision making.
2. SYSTEM DYNAMICS (SD)
A manager who makes good decisions has a clear “mental model” of the problem and the future consequences. Mental models are of central importance to System Dynamics (SD) as they reflect individuals’ views of the world, of themselves and other people in their environment(Gentner, D1983)). For instance, prior to an amalgamation of two companies, managers must have a clear understanding of their own role in the organisation, their value of their employees and the future of the organisation (where it is headed). Developed by Forrester in the late 1950s, SD modelling is built to understand the interactions and perceptions that create and propagate a problem. Albin (1997)states “To have a meaningful model, there must be some underlying problem in a system that creates a need for additional knowledge and understanding of the system.”
Mental models evolve constantly and although they might not be right, they must be functional (Gentner, D1983)). For example, when a merger is due to take place, a manager may only see themselves as the most likely to be affected, neglecting other people or operations which may also be affected by the change. In this example, though the manager’s mental model is functioning, it is not necessarily correct. As managers gain more experience and knowledge in dealing with complex changing organisations, their own mental models become clearer, thereby enabling them to make better decisions.
The aim of SD therefore is “learning to see patterns of behaviour in organisations and grounding these in the structure of organisations – their operational processes and policies” (NHS, 2005) SD uses software, such as Stella, to map processes and policies at a strategic level. It does this by populating the conceptual model with data and then simulating the evolution of the processes under transparent assumptions, policies and scenarios.
The approach also represents the dynamic aspects of feedback effects, through the use of causal loop diagrams, and possible delays in a system. This is vital for management, as keeping a mental track of every dynamic relation in the system (the cause and its effect) becomes very difficult. By having a visual representation, management will have a dependable process which offers important benefits to planning, monitoring and evaluation activities (Newman, J 2003).
The following sections of this essay will focus primarily on two of the most common managerial issues arising post-amalgamation. The first will show the process of hiring and firing within the organisation, determining the management’s goals on the skill set of their workforce. The second section will discuss organisational change and how the dynamics of the environment impact individual members. Each section will provide an associated model and graph, inevitably evaluating the limitations of using SD for the purposes of management decision making.
3. THE MERGER PROBLEM
Historically, managers were known to dive straight into mergers in order to gain financial advantages or product synergies, such as a stronger share of the market. Recently, managers have revaluated the way they enter mergers to include cultural compatibility within their decision making process. Mergers can cause the internal dynamics of an organisation to change, particularly its structure, culture and its workforce. Its disadvantages could lead to workforce redundancies and a power struggle between executives. Although employee skills can grow, neglecting change in an organisation’s dynamics could lead to a sharp decline in employee morale, resulting in a tense and unstable working environment. Efficiency and effectiveness of operations, clarification of aims and objectives, design of a suitable structure; and completion of essential administrative functions could also be disrupted (Mullins, L 2002). So to avoid negative consequences, decisions must be reviewed carefully prior to a merger.
This section focuses specifically on two common issues; the structure of the workforce (hiring and firing) and effects on the organisational culture. It will discuss the application of SD to the above scenarios through the following example.
Two companies, specialising in confectionaries, each begin with a sales force of 20 people. The employees specifically deal with retailers and vendors to make sales, thereby generating revenue for the company. A fraction of the revenue is added to the employee budget. Hiring and firing decisions are then made based on these two factors; the workforce size and the contributing budget. When company “A” and company “B” collectively decide to merge in order to expand their revenue base and gain a larger share of the market, they compose a plan of what the future expectation from the organisation should be. A Causal Loop Diagram (CLD) of the above scenario is presented in Figure 1.
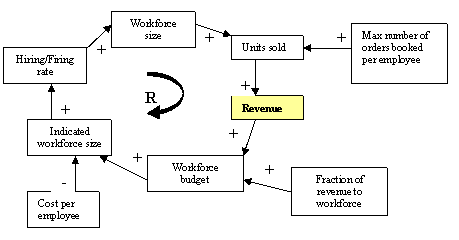
Figure 1 : Causal Loop Diagram – management perception of post-merger organisation flow
A CLD represents the flow of information in a loop and provides an intuitive understanding of the system. A “+” sign indicates a positive influence and a “-” sign indicates a negative influence. The nature of the loop is decided based on the number of “-” present in the links of the loop. An even number of negative symbols would make the loop a reinforcing loop whereas an odd number would make it a balancing loop. A reinforcing loop would mean that the net effect of the loop would either be exponential growth or collapse whereas a balancing loop ensures that the variables in the system remain in equilibrium. This particular CLD is a reinforcing loop and the variable revenue has been set to exponentially increase over time.
Having set up this CLD, it allows the manager to understand the links between the variables and identify any points which may help the organisation in the long term. Then by presenting findings to senior management, knowledge of these results can then translate into practical implementation.
By populating the above CLD with random data, within Stella, a base case scenario over three years was developed. It was assumed that the two companies merge at time (t) equal to 10 months from the start date of the simulation. At t=10 months, revenue is projected to be £446,659. It must be noted that this figure is not cumulated and represents revenue for a single time step (one month). The workforce would be expected to grow as the two companies combine their teams. Post merger, employee motivation is seen to be projected at an upward trend as personal incentives and the perceived synergy are realised.
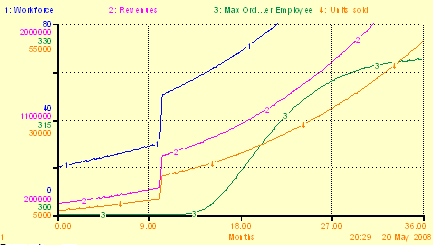
Figure 2: Post-merger perception – base case
The above is a perception of what the two firms would like to achieve (their goals) and therefore overlooks other implications affecting the organisation. This next section will address these implications by using SD modelling to analyse the hiring and firing problem as well as the influence on the organisations culture.
3.1 Hiring and Firing (HF)
At the point of merger, when t=10, orders booked from both the companies are combined. This situation will inevitably invite an issue of bottlenecks occurring in the system. A definite backlog of orders will result due to two main reasons.
Firstly, upon hearing the news employees may feel their positions are threatened. This could cause a sudden drop in their performance, which in turn may result in selling fewer units. Here, performance is measured as max orders booked per employee. Figure 3 shows this problem prior to the amalgamation at t=10. The process of recruitment still continues in order to meet the backlog of orders, which therefore reflects the increase in the workforce. However, this does not address the effect on the individuals in the organisation. Hearing the news some employees may choose to leave whilst others may simply slow down and wait for updates from the management. At this point the rate at which revenue has been increasing begins to decelerate.
Secondly, at t=10, the organisation is put in a position where it needs to make decisions based on the size of its teams. If management decide to transfer people from company “B” into company “A”, or even hire new employees, they need to realise that the new teams will undergo a transition period. Training and repositioning may lead to a short term decline in employee performance as they use their working hours to improve their skills set. For this reason it is necessary to record a delay in the system before he/she is able to perform to full capacity. Figure 3 represents this activity when the number of units sold drops to 12120 (see Table 1).
However, consumers may suddenly increase pressures to receive their orders. Although, employees may not be completely trained, they will be pushed to deal with this backlog. As a result, at t=15, the revenue seems to have picked up and is recorded at £568,580. This is due to fact that management realise they need to increase their workforce to match this requirement. Figure 3 accounts for this delay in t=15 where, in comparison to the base case, the revenue is picks up over time and not when the merger happens.
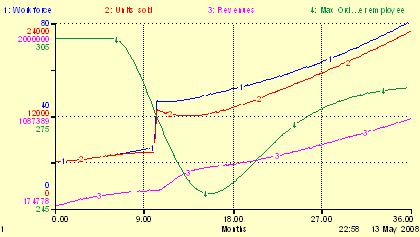
Figure 3 : Post-merger problems
Base Case | Problem Scenario | |||||
| t=10 | t=15 | t=36 | t=10 | t=15 | t=36 | |
| Revenue | £446,659. | £911,893 | £ 2.51m | £347,062 | £568,580 | £1.04m |
| Units Sold (number of units) | 8933 | 18238 | 50268 | 7181 | 12120 | 22848 |
| Max orders per employee | 300 | 302 | 325 | 276 | 249 | 285 |
Table 1 : A comparative analysis of the base case merger problem verses the post-merger problems scenario.
It is vital for top management to address this period effectively. Not only should they concentrate on the future synergy, but they should also focus on the immediate impact of the changes in their environment. It could do this by communicating crucial information via company conferences to ensure that the focus of their employees is fixed on their responsibilities, and not on organisational instability and tensions. If management were to set a short term goal it should be to pull the organisation and its people out from the “recession” phase into recovery, which should hopefully be followed by growth.
3.2 Cultural Changes
Aside from the key issue of restructuring workforces to deliver the perceived synergy, it is also necessary to understand the cultural integration of the two companies. As stated earlier, rumours regarding mergers spread quickly around the organisation and result in concerns over job security and work culture. In this particular case, each set of employees (one from company A and the other from company B) may be accustomed to a particular work culture. Issues can arise when management integrates teams between companies without giving it much thought, leading to conflicts and motivational issues.
Robbins (2002) states that “Actions of top management have a major impact on the organisational culture.” Thus, managers should be held accountable for creating a comfortable atmosphere for their newly combined teams. Ideally, the working environment should meet somewhere between their two cultures as a fair and sustainable compromise. In order to understand the impact of a merger on the employee morale and their cultural adaptation it is necessary to scale down the problem and capture the attractiveness of A’s work culture from B’s perspective. Figure 4 portrays this concept in a CLD.It should be noted that this particular CLD is symmetric and B’s loop is expected to be structured similar to that of A’s.
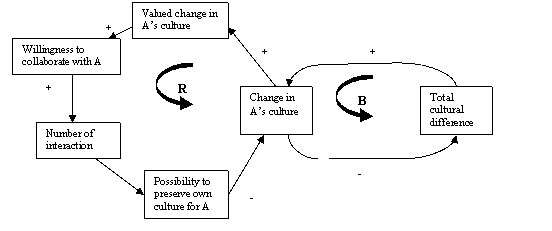
Figure 4 : Causal loop diagram of culture A from culture B’s perspective
From a SD perspective, it is difficult to quantify a variable like culture. An organisation’s culture can comprise of various factors such as working hours (flex time), corporate culture, employee satisfaction and so on. The varying nature of each of these components increases the difficulty of quantifying “culture.” Following the suggestion of Switbert et al, culture has been defined on a scale from 1 to 10. A value of 1 represents a relaxed and rather democratic approach to work whereas 10 would represent a corporate and authoritarian environment. The problem is once again simulated using Stella
Previously, the merger was set to occur at t=10 months. This model will make the same assumption regarding the occurrence of the merger. The differences now are; the simulation horizon is now reduced to 24 weeks from 3 years and A has a workforce of 25 people where as B had 20 people. It is also assumed that A has culture value of 1 whereas company B has 9 and that the total number of interactions between the two organisations is 100.
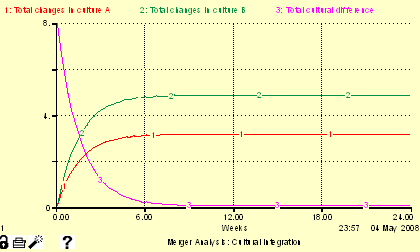
Figure 5 : Changes in A and Bs culture over 24 weeks
In Figure 5 the y-axis (vertical) represents a unit measure of culture. The purpose of this illustration is to show how each employee develops a preference of work culture over the 24 week period. The total cultural difference of 8 units is bridged more by employees of company B. A suggested contributing factor is the headcount of employees. A has 5 more employees than B, thereby having a greater likelihood of retaining its cultural identity. This is coupled with the fact that employees of B regard the culture in A to be more attractive.
Expanding on Switbert et al findings, a sensitivity analysis of the culture was carried out. The number of interactions was varied from 100 to 100,000 (see Figure 6). Each increase in the variable interactions resulted in a reduced total change of A’s culture. However, there was an opposite impact on the change in culture of the less dominating company B. The extended analysis depicted that an increase in employee interactions worked in favour of the more “dominant” company.
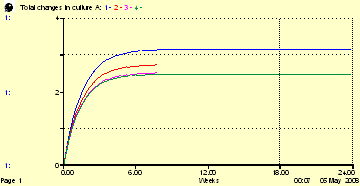
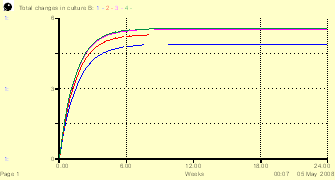
Figure 6 : Sensitivity analysis – Number of interactions impacting on total change for A (left) and B (right)
The reason for this analysis is that, in the long term, if the two organisations do not fit well culturally this can have a drastic impact on the expected revenue. A positive working culture increases staff motivation, which in turn leads to greater output and thus employees feel like assets rather than like costs. Implementing SD in this case forces managers to communicate with other participants in the system in order to get a holistic view of the problem, thus ensuring minimal assumption of causality. As a result, it prepares management for the future and facilitates any such movement through interactions.
3.3 Policy Insights
Based on the above SD models, some recommendations have been proposed if management opt to take on this approach. This procedure implements the use of archetypes suggested by Senge (1990), proving as a point of reference in the analysis.
Limits to growth:This archetype suggests that there could be a possible exogenous loop affecting the current reinforcing diagram. For example, the consequence of an economy heading into recession might have a knock on effect on customers booking fewer orders, which would in turn have a negative effect on the number of units sold. This may affect the organisation’s strategy of sustaining its revenue. Senge (1990)recommends not to concentrate exclusively on the reinforcing loop, but to weaken the source of limitation i.e. the exogenous loop. One way of approaching this difficulty could be to expand their consumer base and enter a new market or launch a new product. Alternatively, they could address the weakness by aligning their strategy with the economic recession and offer discounts on their products.
Fixes that fail: Following a merger, a decline in workforce performance might push the company to reduce its number of employees. Managers may fail to recognise this decline in performance as a short term effect (e.g. due to the news of the merger, training) and attempt to enforce redundancy plans to sustain their revenue. This could inversely affect the working culture of the organisation, especially individuals whose jobs could potentially be threatened by the merger. Eventually, this vicious cycle might force employees to quit instead of being made redundant. Failing to meet workforce capacity, performance deteriorates resulting in orders building up in backlog. In the long run, customer complaints and bad word of mouth may lead to declining revenue. So to avoid this problem from occurring, it is suggested that management address such short term issues in a holistic manner. Balancing both long term and short term goals is imperative when sustaining a healthy organisation.
If all the above recommendations are implemented by the companies in question, then they should be able to overcome each of the issues raised in the earlier sections of this essay. By using SD to highlight the areas for improvement, it will allow the organisation to achieve high revenue with stability and certainty.
Although SD provides management with an approach to decision making, it has certain fallacies which limit its extensive use. The limitations of SD will be discussed in the next section.
4. LIMITATIONS OF THE SD APPROACH
Evidently SD has proved to be a unique tool, helping one identify and interpret the dynamic interactions between different variables in a system. Unlike other soft approaches in Operational Research (OR) such as Soft Systems Methodology, a technique solely dependant on qualitative inputs, SD measures variables both in the qualitative (cultural changes) and quantitative aspect (hiring and firing), providing one with an overall perspective to the problem.
As with many OR methods, SD also has its drawbacks. A common mistake is made when one assumes that the most vital part of SD, which contributes to the decision making process (monitoring and evaluation), is the modelling and simulating of a complex problem (Newman, 2003). Instead, SD should be conceived more as a process in which various things occur. Firstly, at the policy making level, a particular goal should be specified. Then, information should be carefully chosen and evaluated so as to achieve the desired results. Finally, any outcomes should be continually reviewed and adapted to match ones mental model. Newman et al rightly state that (2003) “in the SD approach, the model is constantly being reconsidered and appropriate modifications and adjustments are expected in the course of one’s work.”
In fact, Forrester (1994) points out that “mental models cannot be proven or back-tested as they are the manifestations of the users, but they can only be judged by comparative usefulness.” When focusing on something as intrinsic as influences of culture on the working environment, it is necessary to take into account every individual’s perspective in the system. Though strategic departments may express interest in the intuitive behaviour of SD, other divisions may not warm towards it. Those who may be aware of this tool might avoid its use as the process of building a CLD, to represent a mental model, can be time consuming. Especially when it calls for time from both management and employees to, say, facilitate workshops to make the best possible decisions.
Moreover, there are limited studies which use SD to solve merger issues. Introducing a fresh technique into an organisation could result in an immediate rejection. Managers may prefer to invest their time and money in a methodology which is well-known (to them) and may have been around far longer. Small and Medium Enterprises (SMEs) would more likely reject this technique. SMEs tend to have greater resource constraints (limited time, workforce size, limited capital) and would therefore find it harder to obtain investment for this type of analysis. Thus, in order to proceed with SD methodology, the total benefits obtainable from the process must outweigh the costs to the organisation.
Another major drawback of SD modelling is that it assumes the cause-and-effect between variables to remain static over the simulation period, which might prove to be a costly assumption. In reality, culture would not be represented with a difference of 8 as these numbers may have no meaning to managers in their day-to-day activities. Rather, it would be dependant on every individual employee, their perception of the organisation and their cultural preference. Also individual perceptions may change not only on month by month basis, but also by the day. Such variables cannot be quantified or seen as static. But as there is no other way to address this issue, managers may have to accept this limitation when working with SD.
Dealing with dynamic systems which are made of up heterogeneous variables can be a challenge. However, the difficultly arises when one uses the current simulation tools, offered by SD, to model this environment. These tools are still fairly primitive when employing quantitative methodologies. SD cannot solve a problem that requires applying simultaneous equations to a boundary problem. For example, the fraction of revenue allocated to the workforce is not an easy variable to compute. In most organisations the workforce budget is calculated upon considering different revenue streams, performance of various teams, future investments and other such variables. This might require solving simultaneous equations at each time step and these features are still unavailable.
Once management decide to apply this methodology to their business plan, then it becomes necessary for all participants in the system, including employees, to be a part of the initial discussion so as to build a “correct” CLD. To fulfil this purpose, management may seek hiring a SD practitioner who is well rehearsed in the complex paradigms of SD. Communicating this information to management and throughout the company is imperative for the SD analysis. However, a simple mismatch in the definition of a “model” shows cracks in this communication. The practitioner is typically interested in Stella modellingwhereas a manager will be more interested in a top-level view of the organisation, thus missing out on the subtleties in the system. Already, the mental models of the two people involved are different. As Sardiwal (2006) points out, “practitioners are clearly aware of the difficulties of systems thinking.”
SD practitioners are also known to overlook the project scope and focus on the results straightaway, although they cannot be blamed considering management demands for speedy results (Sardiwal, S 2006). If this step is not carried out perfectly, the computed models can deliver wrong results, and thus misinterpret the data. Furthermore, the software used for SD modelling is easy to handle. Although it may seem to be an advantage, this simplicity may result in a manager translating the model and its output as the final result. This is one of the most common problems with SD. Simplifying a model would mean ignoring its external factors. This could potentially harm businesses entering a merger, as they would have no understanding of, say, their competitors’ reactions or the attitude of the buyers in the market, which would inevitably have helped the organisation to plan their strategies.
There are a trade-offs to be made by the SD practitioner on model complexity versus usability. Very large and complicated real-life problems may not be easy to replicate in Stella, even though a CLD may be drawn. As seen in this report, the original problem was to do with how mergers could be approached so as to avoid the messy aftermath. Since it was considered infeasible to solve the problem at a top level, the model was broken down into its two smaller components; workforce restructuring and cultural integration. However, by doing so, the output from the simulation may have eroded its validity and therefore may not applicable to the real-life scenario. Therefore, the concluding results should be seen as an indicator rather than a solution.
Finally, management must realise that no model is ever perfect. In fact, if management wanted a perfect model it would mean updating all the variables and links as the model evolves. This would not be time well spent as the model is purely a representation of perceptions and not the real life scenario. Therefore, management need to step back from the model and apply their intuition as well as personal judgement in order to make sensible decisions.
5. CONCLUSION
This essay has attempted to explore the extent to which a business can use SD to aid management make the right decisions. The features of SD have been illustrated by analysing the merger of two confectionary companies and its impact on workforce restructuring and cultural integration. Following this analysis, key recommendations were made (in form of policies) to help management better address the volatile nature of such problems. It must be noted that the two scenarios, hiring and firing and cultural changes, are purely hypothetical and the analysis can be improved and adapted to consider more realistic options.
However, a thorough analysis of using SD to contribute to decision making brought about several fallacies. To avoid the pitfalls of SD, it is vital that management combine a good command of facts, relevant professional understanding and self-knowledge with SD. By doing so, management will then be able to challenge SD rather than ignorantly using results to solve a problem even when it is not appropriate. Executives and low level managers are invited to use methodologies such as SD, but at their own discretion, and should remember to use it as part of the solution rather than a solution itself.
REFERENCES
-Albin, S (1997), Building a System Dynamics Model – Part 1 Conceptualisation, report to the MIT System Dynamics in Education Project, Boston
<http://sysdyn.clexchange.org/sdep/Roadmaps/RM8/D-4597.pdf>
-Forrester J (1994) ‘Learning through System Dynamics as Preparation for the 21st Century’, Systems Thinking and Dynamic Modeling Conference for K-12 Education
June 27-29, 1994, Jay Forrester, USA
< http://sysdyn.clexchange.org/sdep/papers/D-4434-1.pdf>
-Gentner, D and Stevens, A (1983), Mental Models, Lawrence Erlbaum Associates Inc, San Diego
-Mullins, L. (2002), Management and Organisational Behaviour, 6th edition, Prentice Hall, Essex, UK
-NEWMAN ET AL (2003) ‘A system dynamics approach to monitoring and evaluation at the country level – an application to the evaluation of malaria-control programs in Bolivia’ for the
Fifth Biennial World Bank Conference on Evaluation and Development “Evaluating Development Effectiveness: Challenges and the Way Forward” Washington, D.C. 15-16 July 2003 – Operations Evaluation Department
<http://www.csdnet.aem.cornell.edu/papers/newman.pdf>
-Richardson, G (1966) ‘Problems with causal-loop diagrams’ System Dynamics Review 2, Volume 2, Issue 2, page 165
-Robbins, S (2002) Organisational Behaviour, 9th edition, Prentice Hall, Upper Saddle River, New Jersey
-Senge, P (1990) The Fifth discipline: The Art and Practice of the Learning Organisation, 1st edition, Double Day Currency, New York
-Sterman, J (2000) Business dynamics: systems thinking and modelling for a complex world, Irwin/McGraw-Hill, Boston,
-Switbert, F.L Miczka and Grobler, A (2004), Merger Dynamics – A System Dynamics Analysis of Post-Merger Integration Processes, paper presented to the System Dynamics Conference, Oxford, 25-29 July, 2004
-The NHS confederation (2005), The potential of system dynamics – A new era of strategic planning? -Future Healthcare Network, viewed 14 April 2008
<http://www.symmetricsd.co.uk/files/le_systemdynamics_nov2005.pdf>
Richardson, G (1966) ‘Problems with causal-loop diagrams’ System Dynamics Review 2, Volume 2, Issue 2, page 165
Switbert, F.L Miczka and Grobler, A (2004), Merger Dynamics – A System Dynamics Analysis of Post-Merger Integration Processes, paper presented to the System Dynamics Conference, Oxford, 25-29 July, 2004