Financial Statement Analysis
Number of words: 1788
Company Overview
Coca-Cola Company
Coca-Cola is a multi-national Corporation that operates in the food and beverage industry. It is headquartered in Atlanta, Georgia. Coca-Cola manufactures, retails, and markets non-alcoholic syrups along with beverage concentrates. It’s signature product is Coca-Cola alongside Fanta, Dasani, Coke Zero, Sprite and other 200 other goods, distributed globally. The organization was established during 1892, and currently, it is the leading U.S and worldwide producer of soft drinks and food (U.S SEC, 2017). The primary competitors of Coca-Cola are Keurig Dr Pepper, Monster Beverage, Red Bull, Tropicana Products, Fever Tree, and PepsiCo.
Keurig Dr Pepper
Keurig Dr Pepper is a publicly-traded United States beverage as well as soft drink producer conglomerate, which is headquartered in Burlington, Massachusetts. The company’s east coast subsidiary is involved in selling coffee along with other drinks, as well as brewers. During 2019, the new merged international company markers juices, sodas, as well as other soft drinks. Keurig Dr Pepper mainly operates in the food and beverage industry just like Coca-Cola (Keurig DrPepper, 2020). Started as a minute special coffee roaster as well as store during 1981 within Vermont, and subsequent to national and regional expansion in 1980, Green Mountain Coffee Roasters finished their merger of brewing machine producer Keurig, Inc during 2006, allowing faster growth via high margin sales of numerous K-cup pods for office and home use. The Green Mountain Coffee Roasters altered the name to Keurig Green Mountain during 2014 March (Keurig DrPepper, 2020). A publicly-traded organization since 1993 to 2016, Keurig Green Mountain got acquired by a team of entrepreneurs for nearly $14 billion dollars. It became privately-owned organization for 2 years, and became an entity operated by the preexisting managerial team as well as new chief executive officer. Keurig Dr Pepper’s competitors include PepsiCo, Mondelez Interational, and Coca-Cola Company.
PepsiCo
PepsiCo is amongst the leading companies in the food and beverage industry in the United States and globally, which produces Pepsi-Cola drinks. It manufactures, sells, and distributes Pepsi-Cola drinks in all 43 states of the United States and in Columbia, Spain, Canada, Russia, Greece, as well as Mexico. PepsiCo was established during 1956 and it is headquartered in Purchase, Harrison, New York, United Stated. During 2021, PepsiCo owns 23 products which have more than one billion dollars in sales. The organization operates across the planet and its goods are distributed and sold in over 200 nations, leading to net yearly revenues of more than $70B. Based upon the net revenues, market capitalization, as well as profit, PepsiCo Inc. is the 2nd leading food and beverage producer and seller globally. The key competitors of PepsiCo include Monster Beverage, Red Bull, Keurig Dr Pepper, Mondelez International, Nestle, and Britvic (U.S SEC, 2017).
Ratio Analysis
Current ratio
Current ratio refers to a measure of liquidity, which gauges the ability of firms to pay their short terms liabilities. It shows how an organization can optimize current assets on their balance sheets for satisfying their current debt. Lower current ratios below the industry average of one insinuates a greater risk of default or distress while higher current ratios of 1 or more show that an organization is capable to pay its short term obligations when due (Tumanggor, 2020). Current ratio is computed as follows:

Quick ratio
This ratio gauges an organization’s ability of paying their current debt using quick assets only. A high quick ratio implies that an organization has adequate quick assets for covering their total current obligations when due. Thus, a higher quick ratio of 1 or above is more favorable than a lower quick ratio (Tumanggor, 2020). Quick ratio is calculated as follows:

Gross profit percentage
This is a profitability ratio which measures the efficiency of an organization in managing its operations. A high gross profit margin shows that an organization is extremely profitable. Generally, the industry average gross profit margin is 5% or more (Altman, 2021). The formula to compute gross profit margin is:

Inventory turnover
This ratio shows how efficiently companies are managing their inventory. It is vital for companies to have high inventory turnover ratios as they show the organizations don’t spend too much in purchasing excessive inventory as well as wastes resources through storing of the non-salable stock (Altman, 2021). Inventory turnover ratio is calculated as follows:

Accounts receivable turnover
This ratio gauges the number of times an organization collects their accounts receivables in a year. A higher accounts receivable turnover is more favorable than a lower one as it means a firm is collecting its credit sales often (Altman, 2021). This ratio is computed as follows:

Asset turnover ratio
This ratio gauges how efficient an organization makes use of assets for generating sales. Thus, a higher asset turnover ratio is preferred because it implies the organization is utilizing their assets more often (Altman, 2021). Asset turnover ratio is calculated as follows:

Application to the three Companies
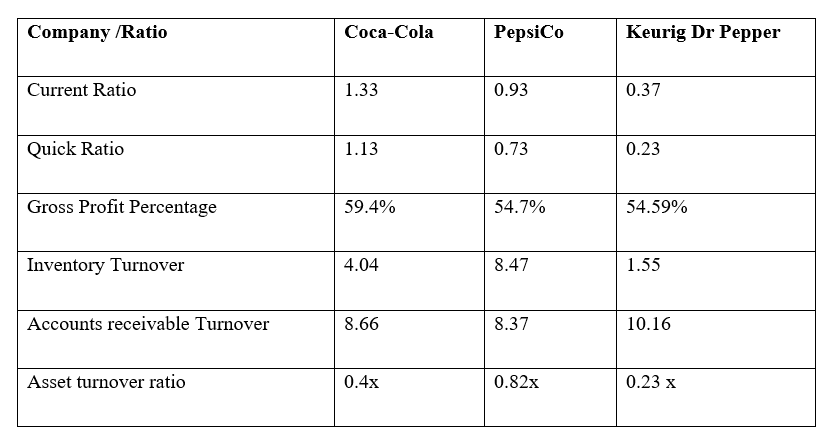
Based on the above table, Coca-Colas has a higher current ratio than PepsiCo and Keurig. This means that Coca-Cola can easily pay its short terms debts when due as it has more assets than liabilities. Coca-Colas has a higher quick ratio than the two rivals as well. This means that the organization has more quick assets to repay its short term obligations when due. Coca-Cola has the highest gross profit margin too implying that it efficiently sales its goods to generate sales. However, PepsiCo has a higher inventory turnover compared to Coca-Cola and Keurig, which is an indication that PepsiCo is efficiently managing its inventory to generate sales. Keurig, on the other hand, has a higher accounts receivable turnover ratio that Coca-Cola and PepsiCo, which is an indication Keurig has a better debt collection system that enable it to frequently collect debt from customers. At last, PepsiCo has a higher asset turnover ratio than Coca-Cola and Keurig. This higher asset turnover ratio means that PepsiCo is efficiently managing its assets to generate profit for its investors.
Explain the difference between the allowance method and the direct write off method for accounts receivable. Document the method used for each of the three companies
Allowance method needs small businesses to project at the year end the amount of bad debt it has. In contrast, direct write off technique allows an owner into writing off bad debts when they decide a client will not pay invoice (Ibarra, 2012). Since Coca-Cola, PepsiCo, and Keurig are all the U.S-based companies, they both use the allowance method to account for their accounts receivables.
Explain the difference between the straight line, double declining balance and the unit-of-production depreciation methods. Document the method used for each of the three companies.
Every depreciation technique depreciates the asset by equivalent amount all through the life of the asset; however, each methodology does as such on a separate or unique schedule. This implies that the key difference between the straight line depreciation and the reducing balance depreciation involves timing. Straight line technique generally depreciates asset by equivalent amount every accounting period. On the other hand declining balance technique allots a greater amount of depreciation in earlier periods of the life of the asset in subsequent years. Nonetheless, units of production technique depreciates asset on the basis of unit of output, like miles travelled annually for an auto (Contributor, 2020). Based on their annual reports, the three organizations utilize straight line depreciation technique to account for their assets
Explain the difference between LIFO and FIFO and document the method used for each of the three companies
FIFO postulates that old goods in an organization’s stock have been sold first and then heads to such production expenses. In contrast, LIFO technique postulates that the most recent goods in an organization’s stock have been sold first and utilizes such costs in its place (Gul, 2021). The three organizations use the FIFO technique to account for their inventory.
Explain the different categories of intangible assets and document the method used for each of the three companies.
The various categories of intangible assets encompass contracts, software, patents, licenses, copyrights, non-compete agreements, and leasehold interests. Coca-Cola uses leasehold interests, PepsiCo uses contracts, whilst Keurig uses patents, licenses, and copyrights.
Recommendation
Based on the above information, I will recommend one to invest in Coca-Cola Company. This is because Coca-Cola’s strengths rest in high current ratio, high, quick ratio, and high gross profit percentage. All these ratios demonstrate that Coca-Cola is a financially strong company compared to its rivals. On the other hand, the risk that Coca-Cola faces is low accounts receivable turnover as well as low inventory turnover ratio. These metrics show that the organization is not generating more profit to expand further in future. However, regardless of these risks, Coca-Cola is still an excellent stock to invest in because of its high level of profitability.
References
U.S SEC. (2017). The Coca-Cola Company. https://investors.coca-colacompany.com/filings-reports/annual-filings-10-k/content/0000021344-20-000006/0000021344-20-000006.pdf
Keurig DrPepper. (2020). 2020 Annual Report. https://annualreport.stocklight.com/NYSE/KDP/20663183.pdf
(U.S SEC, 2017). PepsiCo Inc. https://investors.coca-colacompany.com/filings-reports/annual-filings-10-k/content/0000021344-20-000006/0000021344-20-000006.pdf
Tumanggor, M. (2020). The Influence of Current Ratio, Quick Ratio and Net Profit Margin on Return on Assets at PT. Hero Supermarket Tbk. PINISI Discretion Review, 1(1), 137-146.
Altman, E. I. (2021). Financial ratios, discriminant analysis and the prediction of corporate bankruptcy. The journal of finance, 23(4), 589-609.
Ibarra, V. C. (2012). Bad debts practices of selected small and medium enterprises in the Philippines. Rev Integr Bus Econ Res, 1, 163.
Contributor, C. (2020). What Are the Differences Between Straight Line, Double-Declining Balance & Units of Production? https://smallbusiness.chron.com/differences-between-straight-line-doubledeclining-balance-units-production-36019.html
Gul, F. A. (2021). Free cash flow, debt-monitoring and managers’ LIFO/FIFO policy choice. Journal of corporate finance, 7(4), 475-492.