MANAGEMENT OF PROJECTS – an analysis of project management
PART 1: STRATEGY AND RECOMMENDATIONS ELEMENT:
INTRODUCTION
Project management is the set of skills and techniques used ‘‘to plan, co-ordinate and control the complex and diverse activities of modern industrial and commerce projects’’ (Lock, 2007).It is always difficult to focus on all the aspects of any programme (multiple projects) and so using a model in this scenario limits the number of elements to focus on and also acts as a pathway to direct the project lifecycle (Hayes, 2007). The Project Management team (Group-5) used the traditional project lifecycle (Figure 1) as the base model to identify the scope of the project and design a strategy to manage the project.
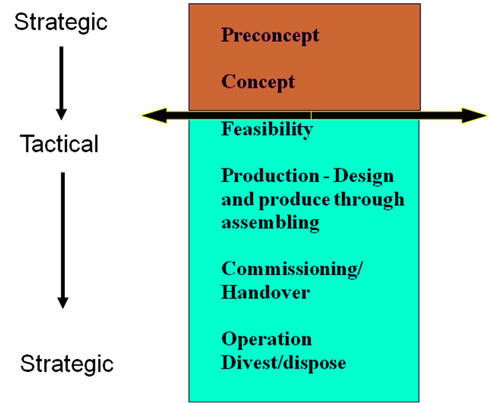
Figure 1: A Project Management Model – The Project Lifecycle(Male, 2009b)
The essay below aims to critically analyse the presentation made to the Vice President of the University, substantiate, with theoretical evidence, the correct steps taken by the team in determining the strategy, the chosen scenario and the recommendations, and recommend improvements in areas where room for improvement has been identified.
CRITICAL ANALYSIS
The presentation made to the Vice-president covered each of the steps of the project lifecycle in an orderly fashion which makes it convenient to critical analyse the presentation slide by slide.
The value of any project is created by identifying the ‘‘correct’’ needs of the project through devising the correct strategy and choosing the best opportunity and proper implementation of the choice made (Male, 2009b). The “lever of value’ model suggests that greater value is added to any project when the initial (which are the strategic) stages of the project are managed successfully (Kelly, 2004).
.
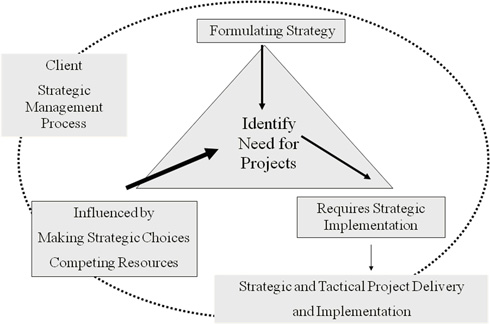
Figure:2 The Start of the Value Process (MALE, 2009B)
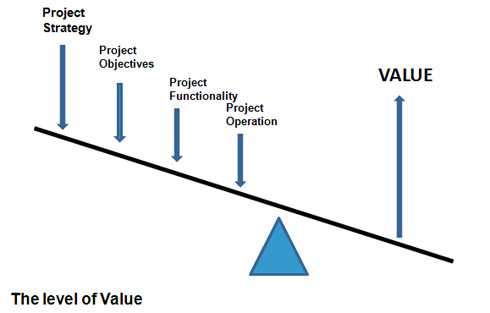
Figure:3 The lever of Value (Kelly, 2004)
Buttrick states that the failure of many projects can be traced to paying little attention to the initial stages of the project. Most organisations leave out the initial stages of the project lifecycle to move on to the tactical phase, which is considered as ‘‘the real work’’, without stating the clear goals of the project (Buttrick, 2005). So, considerable time and attention was paid by all the team members to ensure that the key objectives of the project were well defined for future communication.
The team chose ‘‘increase in ranking by size and academic profile and status’’ as the purpose/vision of the project, since the Vice Chancellor (who is the most important stakeholder in terms of power, influence and interest) indicated the same during the interview. The purpose diagram devised by the team missed certain key factors such as the room for expansion and reducing recurring costs, which are vital for the success of the project. Since there is no room for expansion in the city centre campus, the university is now relocating to a new site and to avoid the same issue again in future, this needed to be among the key criteria in the purpose diagram. For a university to be more competitive it needs to generate revenue, which can be done by increasing revenue options and also by reducing costs and achieving economies of scale. So, reducing costs can also be considered an important factor. The revised purpose diagram is provided below.
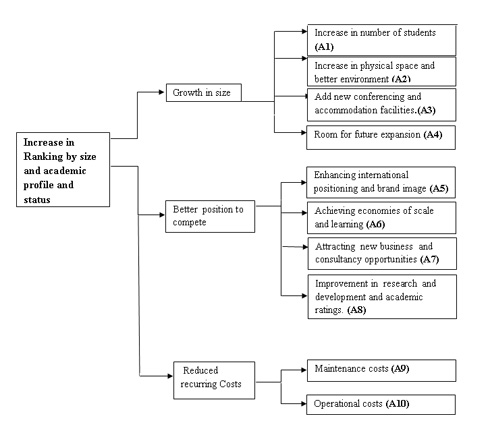
Table 1: Purpose Diagram (Kaur, 2009)
The value created and the strategic fit achieved by the project, are the key driving elements which are defined by and which define all the other elements of any project. Scholz defined strategic fit as the stage ‘‘when all the internal and external elements of an organisation are aligned with each other and with the long term strategy of the organisation’’ (Falshaw, 2009). The team realised that the scenario we choose should provide the best value and achieve strategic fit for the success of the project.
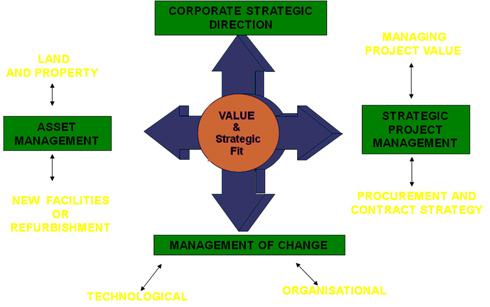
Figure 4: Value Based Thinking &Project Strategy (Male, 2009b)
The scenario was chosen using system-2 level thinking as it is an ideal methodology to make strategic decisions which require step by step, rational and mindful thinking (Maule, 2009).The scenario chosen was scenario-2, which is the correct choice. However, the decision making process was not very convincing, especially since it also needs to be presented to a powerful and resistive audience who could also be seen as the potential blockers of the project. There was no logical methodology used to derive the weights allocated for risk (25, 50 and 75% scenarios 1, 2 and 3 respectively) and it is difficult to defend these values when questioned by resistive stakeholders. Also, the financial cost of the project was nowhere highlighted in the decision making process, although this is one of the biggest deciding factors. To improve the decision making process, we can use SMART – Simple Multi Attribute Rating technique – as it is considered to be an ideal decision making technique when the stakeholders are unable to make trade-offs between value and another vital factor, such as cost. It is consistent, transparent and can be used to defend the decision made as a rational decision (Maule, 2009). We have used SMART in this essay to define how the decision making process could have been improved and secondly to justify that the scenario chosen by the team (scenario-2) was the most optimum scenario.
The first step of SMART is to identify the alternative choices and assess each choice individually, which can be ignored since the options are already made available. The second step is to identify key stakeholders and this was done by the team during the issue analysis. As a part of the third step, which is to bring forth the key attributes that need to be achieved by the scenario chosen, we could use the ten attributes identified during the level 3 of the purpose diagram, as achieving all these attributes can lead to achieving the vision of ‘‘increase in ranking’’. The attributes are assigned values for all three scenarios. These values are assigned such that each attribute is measured against the three scenarios considering all other attributes to be equal. Table 2 below shows the values assigned for all the 10 attributes against the three scenarios (Kaur, 2009).
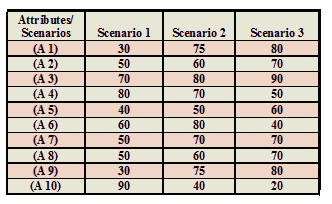
Table 2: (Kaur, 2009)
Step 5 is the weighting technique where the weights for each attribute are calculated. Again values ranging from 0 to 100 are assigned in the order of importance, in which each attribute contributes to meet the main purpose (Solymosi and Dombi, 1986).Once the values are assigned, the weights are normalised to form a sum of 1 (Kaur, 2009).
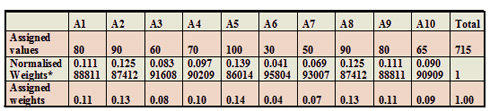
*Normalised weights = assigned value of each attribute/total assigned value of all attributes.
Table 3: (Kaur, 2009)
These normalised weights are multiplied to all the assigned values in step 4 and using the additive value technique, the overall value of each scenario is calculated as shown in Table 4. The overall sum for each scenario is an indicator of how effectively each scenario aligns with achieving the vision of the project (Kaur, 2009).
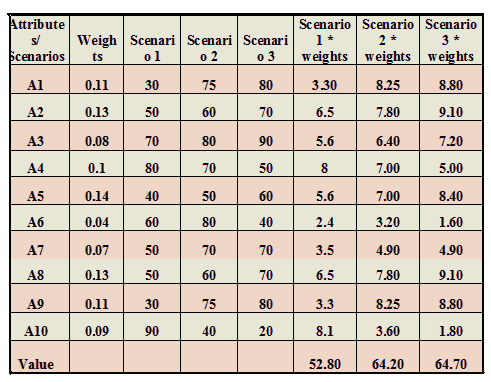
Table 4: (Kaur, 2009)
Each scenario in itself has two more scenarios, detailing the best case scenario and the worst case scenario (the scenario where the HEFCE funding is ring fenced at £150m) and the option chosen has to provide maximum benefit in both the scenarios. Since cost is the most vital attribute to this project, adding it to the other attributes while assigning values in step 4 would dilute its value, so it was not included among the other attributes while assigning values. In step 6. An efficiency frontier graph (Figure 5) is drawn between the costs to the university (best worst case scenario costs) for the three scenarios and the overall value calculated in step 5 (Kaur, 2009). The graph in figure 5 clearly shows that scenario-2 is the most optimum scenario both in terms of cost and benefit in both the best and the worst cases.
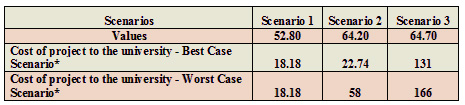
Table 5: (Kaur, 2009)
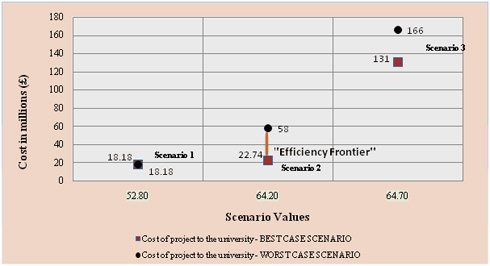
Figure 5: (Kaur, 2009)
A sensitivity analysis can be done to examine the results from SMART. We have used the high-dimensional sensitivity analysis technique where multiple weights are changed and their impact on the overall scenario values is identified (Butler, Jia and Dyer, 1997). Again, an efficiency frontier could be drawn as provided below.
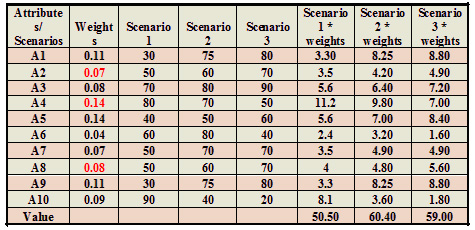
Table 6: (Kaur, 2009)
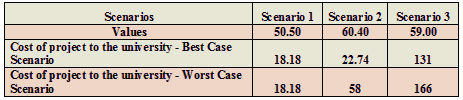
Table 7: (Kaur, 2009)
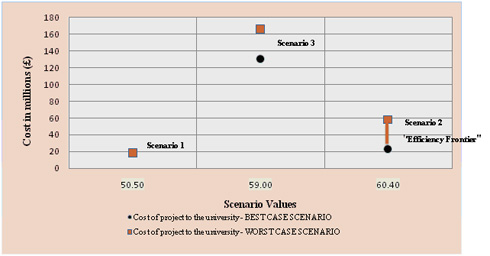
Figure 6: (Kaur, 2009)
Even after the sensitivity analysis, scenario 2 still proves to be the best option among the three scenarios. This justifies that scenario 2 is the most optimum scenario and choosing scenario 2 will bring maximum value and also achieve the strategic fit with the purpose of the project.
‘‘A risk event is a specific happening that can influence the success of an investment either as a business goal or as a project’’ (Male, 2009b). Every project has an element of risk involved in it and if the issues and risks of a project are not identified in the strategic phase, it increases the possibility of a misfit between the strategic phase and the tactical phase of the project (Buttrick, 2005), and so an issues analysis was conducted by team in the pre-concept stage where the key strategic issues which need to be resolved to attain the strategic-tactical fit were identified and grouped according to similarities. The three key issue groups of uncertain vision, internal politics and organisational issues were distinguished from the other tactical issues by analysing the key messages highlighted by the university management in the interviews conducted. The project risks were identified clearly but the business risks such as the capabilities of the project team to successfully implement the project etc. were ignored by the team. Though most of the project related risks were identified in the initial stage of the project itself, no effort was made to evaluate the impact and likelihood of these issues. The team involved only up to the second stage of the below risk management process while we should have completed all the five stages.
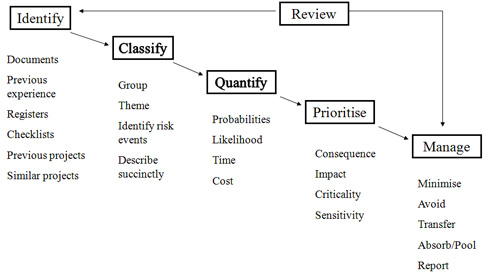
Figure 7: Risk Management Process (Male, 2009b)
The below technique can be used to identify the likelihood and the impact of each risk and then follow the appropriate measure, which is the last three steps of the risk management process. For example, since the likelihood of the VC retiring in four years is high and its current impact on the project is medium, the team will need to monitor and manage this risk.
.
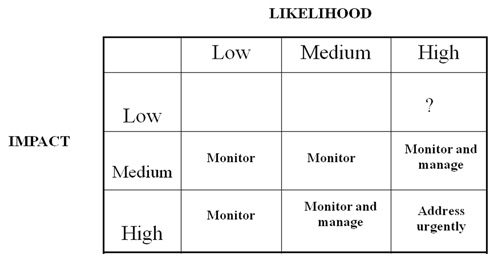
Figure 8: Approach to Assessing Risk (Male, 2009b)
Risk management is not removing the occurrence of risk but it is measures taken to avoid the risk or manage the losses the risk could cause by careful planning (Buttrick, 2005).At any point, there is also a high possibility to change a risk into an opportunity. As shown in figure 9, risk and opportunity are two different sides of the same coin – value.
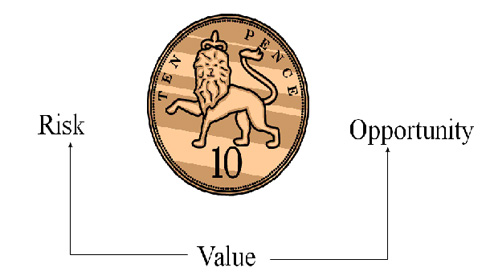
Figure 9: Risk, Value and Opportunity
The team, after evaluating the risks, should also have suggested ways in which some of the risks highlighted in the issue analysis could be changed to opportunities.
TACTICAL PHASE
As a part of the tactical phase of the project, the team identified the need to recruit a change manager for two reasons. Firstly, the project was not only about relocating buildings but also about relocating people and secondly, there is a necessity for an external resource to neutralise the internal politics of the project. However, no additional information about what the change manager will do or who the change manager will report to was discussed by the team. The change manager should report to the programme director who should then report to the Vice Chancellor. One of the initial responsibilities of the change manager will be to draw a stakeholder map to analyse the power and influence of the key stakeholders and then devise a strategy to monitor their position, move them to low power or low influence stage or maintain them in their current status accordingly (Lynda and Derek, 2005)
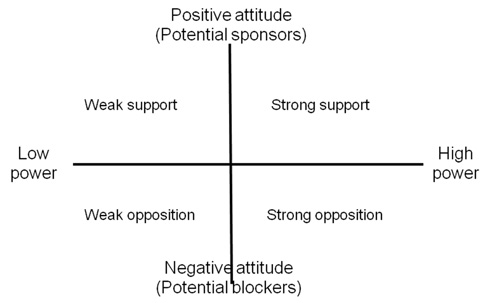
Figure 10: The Stakeholder grid (Hayes, 2007)
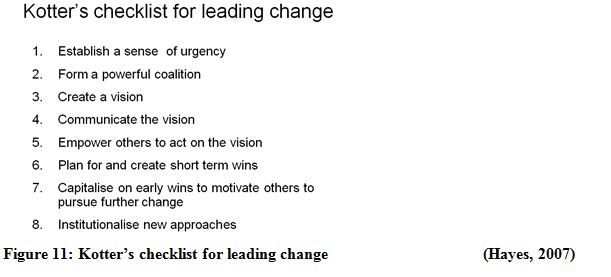
The second responsibility of the change manager will be to lead the change process of the project. This can be done using the checklist devised by Kotter(1990) for leading change (Hayes, 2007).
The team recognised that the relocation project is not a single project but a set of multiple projects and there is a critical need for programme management in determining the sequence of movements of the university faculties and aligning them to the strategy. The key aspects of programme management that were adapted by the team in order to plan the sequence of movements were to first group similar projects as faculties, then prioritise project groups according to the value added by their relocation and finally coordinating these projects and assigning a date of delivery for each set of project. The below model represents the strategy the team had used to draw the sequence of events.
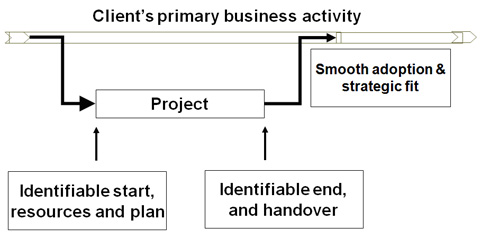
Figure 12: The relationship of the project to the core business (Kelly, 2004)
There was a clear start and end date defined for each program. The reason for the teaching and administration and accommodation facilities to be moved in the first section was to ensure that the university is complete at any point of time and there is no return of construction work to any of the finished sections (which is one of the aims of the project) and this would ensure a smooth relocation without any missing elements (Male, 2009a). The team used the ‘top-down ‘strategy of building core capabilities when deciding on grouping projects into faculties of science, engineering, teaching and administration, accommodation, economic and social studies and education (Male, 2009b). In any major project, there is always a need for ‘islands of stability’ where you wait and check that the project is aligned to the strategy and the progress made so far is contributing towards achieving the company’s goals. This clears the confusion created among the key stakeholders and the involved teams which might otherwise result into de-motivation and frustration (Frigenti and Comninos, 2002).The team should have allocated a time period during the sequence of movements as island of stability during which the project’s progress could be measured and checked to ensure that it aligns with the project aims.
The action plan proposed by team included all the key points that needed immediate attention. However, the team did not discuss how this action plan could be achieved. This should also have been done as a part of the presentation. The team identified the first two points of the action plan to be the most urgent needs for the project’s progress further. The first point was for the Senate to agree with the project proposal and then for all the stakeholders to agree on the vision, scenario chosen by the team (scenario-2) and the sequence of movements. This can be done by forming a change management team which includes the newly-recruited change manager and some internal staff from the university management team. The team could then conduct workshops where the vision of the university project would be discussed and decided based on the decision of all the key stakeholders. The same could also be done for the scenario chosen by the team and the sequence of movements. This could also lead to acceptance of the project proposal by the Senate. The second point was to finalise the merger with the education faculty.The VC and the management team could finalise the merger without making any decisions about how and when to relocate the education faculty.
CONCLUSION
Overall, the strategy used and the recommendations provided were mostly correct. The team has highlighted all the key points which needed to be brought to the VC’s notice in the presentation without missing any major elements. However, some of these points, such as risk management or change management etc. were just highlighted and not discussed further. This essay has drawn out these points and addressed them explicitly. It has also justified the correct decisions made by the team and concentrated on ways in which these decisions could be improved.
REFERENCES
BUTLER, J.; J. JIA and J. DYER. 1997. Simulation techniques for the sensitivity analysis of multi-criteria decision models. European Journal of Operational Research, 103 (3), pp.531-546.
BUTTRICK, R. 2005. The project workout : a toolkit for reaping the rewards from all your business projects / Robert Buttrick. 3rd ed. ed. Harlow : : Financial Times Prentice Hall.
FALSHAW, R.D. 2009. Strategic management lecture material University of Leeds
FRIGENTI, E. and D. COMNINOS. 2002. The practice of project management: a guide to the business-focused approach.Kogan Page Publishers.
HAYES, J., -. 2007. The theory and practice of change management / John Hayes. 2nd ed. ed. Basingstoke : : Palgrave Macmillan.
KAUR, T. 2009. Management Decision Making – LUBS 5867M – Assignment University of Leeds.
KELLY, J., -. 2004. Value management of construction projects / John Kelly, Steven Male, Drummond Graham. Oxford : : Blackwell Science.
LOCK, D., -. 2007. Project management / Dennis Lock. 9th ed. ed. Aledrshot : : Gower.
LYNDA, B. and H.T.W. DEREK. 2005. Visualising and mapping stakeholder influence. Management Decision, 43 (5/6), p.649.
MALE, S. 2009a. Management of Projects Case Study. University of Leeds.
MALE, S. 2009b. Management of projects Module notes. University of Leeds.
MAULE, A.J. 2009. Management decision making Module notes. University of Leeds.
SOLYMOSI, T. and J. DOMBI. 1986. A method for determining the weights of criteria: The centralized weights. European Journal of Operational Research, 26 (1), pp.35-41.
PART 2: TEAM WORKING ELEMENT
INTRODUCTION
“A team is a collection of individuals who are interdependent in their tasks and share responsibility for outcomes”. Project teams are teams which come together for a limited period of team to complete a certain task(Cohen and Bailey, 1997).Our project team was diverse in terms of gender, culture, age, work experience and education. This acted as an advantage towards the team’s performance since diversity brings together more perspectives, arguments, know-how and expertise than similarity does. It also was a disadvantage from a social perspective initially since the team took more time to bond (Knippenberg and Schippers, 2007).
CRITICAL APPRAISAL
During the introduction/forming stage, the team members introduced themselves. Here, if we had discussed our area of expertise such as accounting, stakeholder management etc, the team could have played upon its strengths and allotted tasks according to the team member’s expertise and the overall efficiency would have increased. Although, during the two days, we were able to identify the strengths of different team members and use them accordingly.
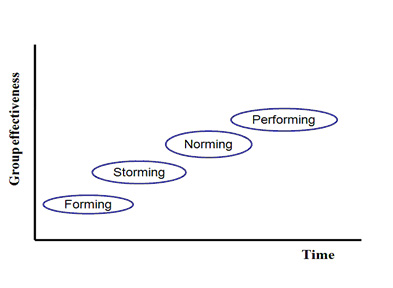
Figure 1: Group Development Model (Tuckman and Jensen, 1977)
The group-work started by identifying the issues individually and then brainstorming them within the team. The brainstorming session revealed that the team was divided into 2 sub-groups, the tactical and the strategic thinkers and both these groups felt different issues were priority (Storming stage). The team didn’t feel satisfied by the results of issues analysis and so repeated the issue analysis process. It was observable that the all team members started thinking strategically and the team had started to bond (Norming stage). During the day, different team members played different team roles as we engaged in more tasks. Though these roles were not explicitly stated, there was always one leader, one creator, one implementer and two completers among the team and these roles were interchanged with every new step in the project.
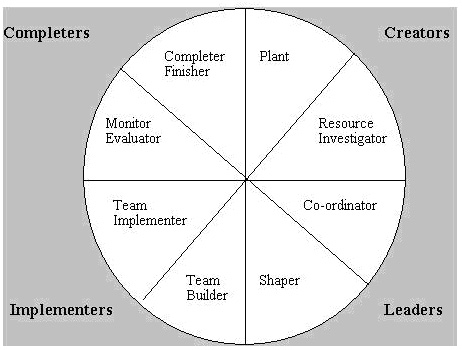
Figure 2: Belbin’s team roles (Harding and Long, 1998)
Since, there was a rotation of roles among the team it caused no conflict or confusion and the progress of the project was never hindered (Performing stage).The team did identify a need for effective time management (since the project was time constrained) on the first day but did not follow it effectively which made the second day challenging since we were under time pressure and behind schedule. On the second day, the team divided into 2 groups where one team played the role of implementers and created the presentation of the completed activities and the other team played creators and leaders and formulated the two key parts of the presentation, the action plan and the sequence of movements. This division of tasks created a sense of de-motivation among the implementers. This division occurred since the duration of working together as a team was coming to the end and some team members were focused towards getting things done over balancing the team relationships. A better way of doing things could have been to assign the two tasks (sequence of movements and the action plan) to both the groups and ensure that each team has a leader and divide the role of making the final presentation too. The barrier of language and culture was visible in most of the team’s discussions but the team made conscious efforts to overcome these barriers and was mostly successful.
CONCLUSION
Overall, the team tried to strike a balance between being task focused and also maintenance focused but there were situations where it was inclined towards fulfillment of tasks due to time pressure. The inputs of all the team members were considered. The team worked efficiently in making the presentation and rehearsing it and there were no weak or strong players. The complete team was involved in the final presentation to the VC with enthusiasm.
HARDING, S. and T. LONG. 1998. Proven management models.Gower Publishing, Ltd.
KNIPPENBERG, D.V. and M.C. SCHIPPERS. 2007. Work Group Diversity. Annual Review of Psychology, 58 (1), pp.515-541.
TUCKMAN, B.W. and M.A.C. JENSEN. 1977. Stages of Small-Group Development Revisited. Group Organization Management, 2 (4), pp.419-427.