TESCO PLC – Ratio Analysis Report 2021/21
This report analyses the financial performance of Tesco PLC, using the ratio analysis, for the year ended February 2021 and 2020. Tesco PLC (Tesco) is a retailer. The Company operates in the retailing and related operations industry, as well as retail banking and insurance services (Reuters, 2021). Tesco is the biggest food retailer in the United Kingdom, with a constant market share of more than 25%. It is one of the ‘big four’ supermarkets, together with Asda, Sainsbury’s, and Morrisons (Blazquez, 2021). Founded in 1919 by Jack Cohen, the company has lately expanded geographically and into other retail categories such as books, clothes, electronics, and toys, as well as financial services, telecoms, and internet service divisions.
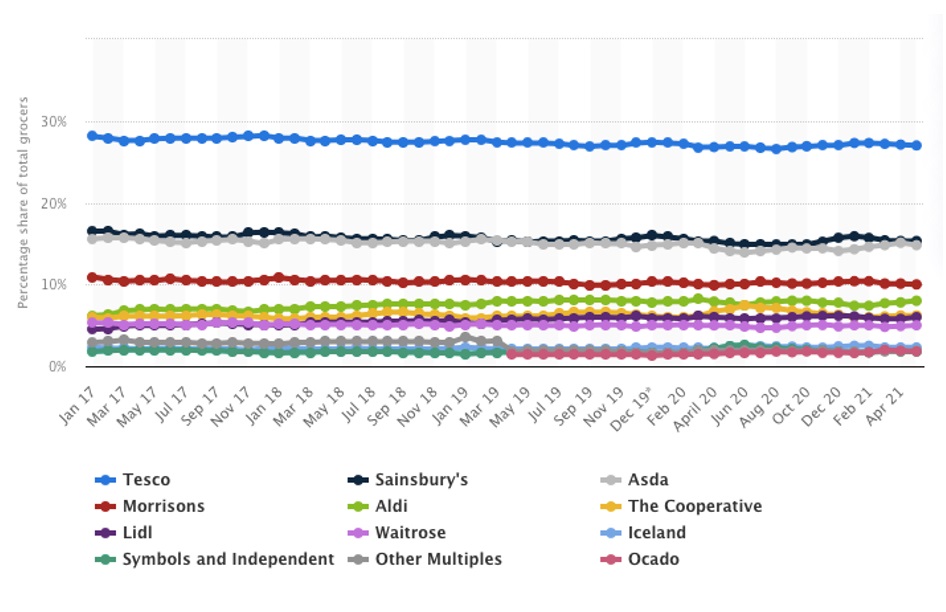
Figure 1: Market share of grocery stores in Great Britain from January 2017 to May 2021. Source: Blazquez (2021).
The report addresses the concerns of a potential investor in the firm, it provides a variety of financial metrics to analyse its performance. To begin, the performance ratios are calculated to assess the operational health of the company. Secondly, liquidity ratios like current, quick, and cash ratios are calculated to measure the ability of the firm to meet its liabilities. Lastly, solvency ratios are calculated to analyse the company’s financial health regarding its debt, leverage, and equity.
Performance Ratios
The performance ratios demonstrate how well the firm operates and how well it fared during the fiscal year. There are other sorts of performance ratios that may be utilised; however, this report focuses on the three most commonly used ones: gross profit (GP) margin, operating profit (OP) margin, and return on capital employed (ROCE). The GP margin is calculated as follows:
| Gross Profit Margin= Gross Profit / Revenue * 100 | |
| GP 2021= 3965/57887 *100 | GP 2020= 4098/58091 |
| GP 2020= 7.05% | GP 2021= 6.85% |
Tesco’s GP margin has slightly decreased in the fiscal year 2021 to 6.85% from 7.05% in 2020. Even though, this drop is minimal it is not the case with other grocery retailers in the UK. Tesco’s sales dropped by £204m in the year ended 29 February 2021, whereas other retailers like Morrisons and Asda reported record growth in sales (Reuters, 2021). The reason behind this is the reported revenue of Tesco is combined for the group, however, if we only consider UK revenue, the company reported its revenue of £53bn, which was an increase of over a billion from the last year (Blazquez, 2021).
OP Margin is the proportion of profit generated by a company’s operations before taxes and interest costs are deducted. The OP margin is calculated as follows:
| Operating Profit Margin= Operating Profit / Revenue * 100 | |
| OP 2021= 1736/57887 *100 | OP 2020= 2206/58091 |
| OP 2021= 3.00% | OP 2020= 3.80% |
Tesco’s operating profit margin for the fiscal year ended January 2021 was 3%, which is relatively low when compared to the previous year’s margin of 3.80%. Despite higher revenue over the previous year, the firm had a reduced OP margin. This is owing to the company’s and the industry’s increased administrative expenditures, as Eley (2020) claims that coronavirus-related costs were “very significant.” The majority of these expenses were connected to employees, as tens of thousands of additional workers were hired to boost online capacity and cover for those who were self-isolating, generally at full pay, while all supermarkets paid store employees a bonus during the pandemic’s stockpiling phase (Eley, 2020).
ROCE evaluates a company’s profitability and the efficiency with which it uses its resources. It is calculated as follows:
| ROCE= Operating Profit / Capital Employed * 100 | |
| ROCE 2021= 1736/(17456+12343) *100 | ROCE 2020= 2206/(21122+13391) *100 |
| ROCE 2021= 5.82% | ROCE 2020= 6.39% |
Tesco’s ROCE was only 5.82% in the fiscal year ending February 2021, compared to 6.39% the previous year. This was owing to the industry’s razor-thin margins since the outbreak’s inception. Because of growing expenses associated with supply chains, Brexit, and employees (Askew, 2021), supermarket profit margins were substantially decreased, nearly halving in Morrison’s case. This proves that Tesco was still better off than the competitors.
Liquidity Ratios
The current ratio measures a company’s ability to meet its short-term commitments only using current assets.
| Current Ratio= Current Assets / Current Liabilities | |
| CR 2021= 10807/15721 | CR 2020= 13893/18656 |
| CR 2021= 0.69 | CR 2020= 0.74 |
Tesco’s current ratio was 0.69 in the fiscal year ending February 2021, down from 0.74 in February 2020. This indicates a minor deterioration of the company’s ratio. Tesco is in a tough situation since its existing assets will only cover 69% of its short-term liabilities. This might cause severe problems for the firm since it may have to sell off some of its assets to pay its liabilities, which can have a negative impact on its performance.
The quick ratio does not take inventory into account, resulting in a more conservative figure than the current ratio, which assumes all current assets to be covered for current liabilities.
| Quick Ratio= (Current Assets – Inventory)/ Current Liabilities | |
| CR 2021= 8738/15721 | CR 2020= 11460/18656 |
| CR 2021= 0.56 | CR 2020= 0.61 |
Tesco’s quick ratio worsened off as well in 2021, as it had lower current assets overall due to increased costs of sales and staff. A quick ratio value of 1 is ideal as it means that the company can meet all of its short-term liabilities. However, this is not the case in the UK grocery retail sector as other companies have even lower ratios, e.g. in Morrison’s case of 0.21 in the year ended 2021 (Financial Times, 2021). It can be argued that it is normal in the industry to have a lower than 1 quick ratio, therefore, Tesco might not be in as much trouble as the quick ratio of the company shows on its own.
The cash ratio shows the financial health of the company and its ability to meet its most urgent obligations (D’Mello et al., 2008). It is calculated as follows:
| Cash Ratio= Cash and marketable securities / Current Liabilities | |
| CR 2021= 3521/15721 | CR 2020= 5213/18656 |
| CR 2021= 0.22 | CR 2020= 0.28 |
Tesco’s cash ratio shows that it can only cover 22% of its current liabilities with its cash in hand. The ratio dropped by 6% in 2021 because of a significant reduction in cash available to the company. This is due to the increase in costs of sales and staff costs due to the Covid-19 pandemic as supply chains were disturbed and staff needed to be paid for time in self-isolation (Eley and McMorrow, 2020).
Solvency Ratios
Solvency ratios such as Debt-to-Equity (D/E) and Interest Coverage assist in determining a company’s capacity to fulfil its long-term debts. The D/E ratio indicates how much debt the company has in comparison to its shareholders’ equity. It is calculated as follows:
| Debt to Equity Ratio= Total Debt / Total Equity | |
| D/E 2021= 33177/12325 | D/E 2020= 39778/13369 |
| D/E 2021= 2.69 | D/E 2020= 2.98 |
The D/E was 2.69x for Tesco in 2021, a slight decrease from 2020. This shows that Tesco’s debt reduced slightly in 2021, but it still is an astonishingly high figure if we compare it against the competitors, e.g. Morrisons only has a D/E of 0.91x in 2021 (Morrisons Annual Report, 2021).
Gearing is another similar ratio that may be used to determine how much leverage a firm has.
| Gearing= Long-term Debt / Capital Employed | |
| GR 2021= 17456/29799 * 100 | GR 2020= 21122/34513 * 100 |
| GR 2021= 58.58% | GR 2020= 61.20% |
The Gearing ratio was 58.58% for the fiscal year ending February 2021, while it was 61.20% in 2020. In the case of Tesco, this indicates that debt accounts for more than half of the total capital employed. The need for liquidity to pay for high costs in the grocery retail industry, such as increasing salaries, employee bonuses, the growing cost of sales, and large stores to manage, is the primary cause for such high leverage (Das et al., 2016, p. 241). The situation is similar for other firms in the industry, such as Morrisons, which has a gearing of 47.66% and Sainsbury’s, which has a gearing of 50.88% (Financial Times, 2021). Tesco must make exorbitant interest payments to service its debt, resulting in the next ratio measured, namely the interest cover ratio.
The interest cover indicates how many times the firm’s operational profits can cover its interest payments. It is calculated as follows:
| Interest Cover Ratio= Operating Profit / Interest paid | |
| IC 2021= 1736/952 | IC 2020= 2206/1190 |
| IC 2021= 1.82 | IC 2020= 1.85 |
Interest Cover slightly reduced in 2021 to 1.82 from 1.85 in 2020. This means that the company is in a marginally better position to pay the interest on liabilities. The ratio shows that the profit can cover the interest only 1.82 times. This is lower than Tesco’s competitors, as Morrisons reported an interest cover of 2.35 in 2021 (Financial Times, 2021). This is understandable in Tesco’s case as the company has a higher leverage and so are the interest payments. However, it does increase the overall risk of the company, especially that of solvency.
Conclusion
Tesco is the largest grocery retailer in the UK, with a 27.4% market share; it is also one of the most established companies, having been in operation since 1919 (Whiterow, 2021). A variety of investors have always preferred to invest in the company’s stock and continue to do so because of its consistent returns. The pandemic and Brexit presented numerous problems to the UK’s food business in the previous year, such as labour shortages, additional expenses, supplier delays, and so on (Askew, 2021).
Ratio analysis is a great tool to assess a company’s performance but looking at ratios on their own does not provide any value. They need to be compared across the financial years of the company and its competitors to find relativity around those figures (Carlson, 2019). Therefore, this report consistently compares the ratios for the years 2021 and 2020 for Tesco, and with its competitors, such as Morrisons, Asda, and Sainsburys.
The company’s ratio analysis revealed that its earnings fell in the fiscal year ending February 2021, while administrative costs climbed. This has a substantial influence on the operating profit margin and ROCE. Whereas the firm appears to have a liquidity problem because its current and quick ratios are both less than one, however, the company is in a good situation when compared to its rivals. The solvency ratios demonstrated that the firm has significant leverage, which raises its financial risk since it can go bankrupt if its liabilities are not met. The gearing ratio and interest cover ratio, on the other hand, are in accordance with the industry, indicating that the figures are normal.
In essence, Tesco is a great company to invest in as it has a history of stable growth and returns. The 2021 and 2020 figures need to be assessed with extra consideration due to the impacts of Covid-19 pandemic on the grocery sector, which can explain some of the anomalies in ratios over the years. The company is on track to report growing sales and profits for the next fiscal year and therefore, it would be a great opportunity to invest in its shares.
References
Askew, K., 2021. UK food hit by trade challenges and staff shortages in wake of Brexit and COVID. Food Navigator. 18 August 2021. [Online]. Available at: https://www.foodnavigator.com/Article/2021/08/18/UK-food-hit-by-trade-challenges-and-staff-shortages-in-wake-of-Brexit-and-COVID. Accessed on 05 October 2021
Blazquez, A., 2021. Annual revenue of Tesco Group in the United Kingdom (UK) and the Republic of Ireland from financial year 2015 to 2021. Statista. 26 July 2021. [Online]. Available at: https://www.statista.com/statistics/490931/tesco-group-finance-revenue-united-kingdom-uk/. Accessed 05 October 2021
Blazquez, A., 2021. Market share of grocery stores in Great Britain from January 2017 to May 2021. Statista. [Online]. Available at: https://www.statista.com/statistics/280208/grocery-market-share-in-the-united-kingdom-uk/. Accessed on 05 October 2021
Carlson, R., 2019. What Are the Limitations of Using Ratio Analysis? The Balance. 20 November 2019. [Online]. Available at: https://www.thebalancesmb.com/limitations-of-financial-ratio-analysis-393236. Accessed 06 October 2021
D’Mello, R., Krishnaswami, S. and Larkin, P.J., 2008. Determinants of corporate cash holdings: Evidence from spin-offs. Journal of Banking & Finance, 32(7), pp.1209-1220.
Das, M., Kar, S. and Nawn, N. eds., 2016. Economic challenges for the contemporary world: Essays in honour of Prabhat Patnaik. SAGE Publishing India.
Eley, J., 2020. Why UK supermarkets are not making super profits. Financial Times. 02 July 2020. [Online]. Available at: https://www.ft.com/content/1011469b-65f2-4ca7-83ac-8c4921fcf6c5. Accessed 06 October 2021.
Eley, J., and McMorrow, R., 2020. Why supermarkets are struggling to profit from the online grocery boom. Financial Times. 23 July 2020. [Online]. Available at: https://www.ft.com/content/b985249c-1ca1-41a8-96b5-0adcc889d57d. Accessed 06 October 2021.
Financial Times, 2021. Equities: J Sainsbury PLC. [Online]. Available at: https://markets.ft.com/data/equities/tearsheet/summary?s=SBRY:LSE. Accessed on 06 October 2021.
Financial Times, 2021. Equities: Tesco PLC. [Online]. Available at: https://markets.ft.com/data/equities/tearsheet/financials?s=TSCO:LSE&subview=IncomeStatement. Accessed on 04 October 2021.
Financial Times, 2021. Equities: Wm Morrison Supermarkets PLC. [Online]. Available at: https://markets.ft.com/data/equities/tearsheet/financials?s=MRW:LSE&subview=BalanceSheet. Accessed on 05 October 2021.
Morrisons Corporate, 2021. Annual Report. [Online]. Available at: https://www.morrisons-corporate.com/investor-centre/annual-report/. Accessed on 05 October 2021
Reuters, 2021. Asda sales growth accelerates in latest quarter. 10 June 2021. [Online]. Available at: https://www.reuters.com/world/uk/asdas-sales-growth-accelerates-under-new-ownership-2021-06-10/. Accessed 06 October 2021
Reuters, 2021. Companies: Tesco PLC. [Online]. Available at: https://www.reuters.com/companies/TSCO.L/profile. Accessed 05 October 2021
Tesco plc, 2021. Investors: Annual Report. [Online]. Available at: https://www.tescoplc.com/media/757589/tesco_annual_report_2021.pdf. Accessed 04 October 2021
Whiterow, P., 2021. Tesco increases grocery market share for first time in four years. Proactive Investors. 02 March 2021. [Online]. Available at: https://www.proactiveinvestors.co.uk/companies/news/942686/tesco-increases-grocery-market-share-for-first-time-in-four-years-942686.html. Accessed 06 October 2021