Comparison of Sieve analyses, laser diffraction, image analyses and FBRM for the determination of particle size distributions
Abstract
Particle size distributions (PSDs) measured by different techniques, including Sieve Analysis (SA), Image Analysis (IA), Laser Diffraction (LD) and Focused-Beam Reflectance Measurement (FBRM), were investigated. The two compounds selected for the study were spherical glass beads and non-spherical Sodium Chloride. It was observed that the results obtained by different techniques were affected by the particle shape and the type of particle. For spherical particles, the PSDs obtained by SA, IA and LD agreed well but there was a less consistent result among different particle measurement techniques for non-spherical particles. The number based PSDs obtained by IA were converted to equivalent spherical volume based PSDs. It is very complicated to convert the CLDs obtained from FBRM to their corresponding PSDs as it requires complex calculations. The use of different statistics was evaluated to find the most suitable statistics which resemble the PSD results obtained from other techniques. It was confirmed that the square weighted Chord Distribution gives most similar results to those obtained by other techniques. The results obtained from FBRM were complex as its measurements depend on many factors such as its PSDs, particle optical properties and shape.
INTRODUCTION
Particle size distribution (PSD) is an important parameter of many particulate products and it is critical for controlling process efficiency such as filtration rates, flow properties or dissolution rates (Kempkes et al., 2008 ; Hareland, 1994). Within the pharmaceutical industry, the PSD characterization of particles is generally of great concern for evaluating the quality of pharmaceutical products (Tinke et al., 2008). A variety of characteri- zation techniques are used for the determination of PSD in current chemical process industry such as Sieve Analysis (SA), Laser Diffraction (LD), Ultrasonic Attenu ation Spectroscopy (UAS), Image analysis (IA) and focused beam reflectance measurement (FBRM). LD, FBRM and IA are among the most widely used in-process or off-line techniques (Li et al., 2005).
Each technique defines a size of particle in a different way. Sieving is the most common method for measuring size distributions of many types of materials because of its simplicity of use and preparation. Samples are sieved through several square meshes. The sieve defines a particle diameter as whether the particle can pass through the particular mesh size or not (Konert and Vandenberghe, 1997). The significant advantage of SA is that the sieves can test large amounts of particles without being very expensive. However, sieving is very labour-intensive and involves long measurement times. Furthermore, the sieving time for SA is one of several factors which can significantly affect the final results of measurement (Chapeau et al., 2008).
LD estimates volume-based PSD by measuring the forward light-scattering (diffraction) of light from the laser. It is one of the most widely used techniques because of its range of applicability, ease of implementation, broad dynamic range, high reproducibility and speed of measurement (Blott et al., 2006; Li et al., 2005; Tinke et al., 2008). However, a significant challenge in applying LD for on-line particle size measurement is to accommodate the multiple scattering that takes place at the high particle concentrations encountered in some processes (Malvern Instruments Ltd).
A large community of users successfully applies FBRM technology for monitoring, fault detection and quality control of dynamic processes (Kail et al., 2009). The operating principle of FBRM is shown in Figure 1. The measurement principle of FBRM is based on backward light scattering. It uses a focused beam of laser light that scans across a particle passing in front of the probe window to take measurements. When the laser beam intersects the edge of a particle, some of it backscatters to the detector installed in the same probe, and generates a rise in signal in the circuit until it reaches the opposite edge of the particle. The product of rise-time and tangential velocity of the rotating laser beam records the chord length – the straight line between two points on the edge of a particle (Yu et al., 2008). The instrument has benefits for on-line and in-situ measurements in systems with high solid concentrations (Hobbel et al., 1991). However, it is complicated to transform a measured CLD into its corresponding PSD accurately due to the lack of a theoretical analysis of the measurement principle. Empirical correlations between a measured CLD and moments of the PSD are often used (Li et al., 2005).
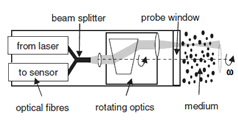 Figure 1. Measurement principle and schematic drawing of the FBRM probe (Kail et al., 2006). IA is a technique by which a few particles are captured, digitized into a pixel image and then processed so that information can be extracted in the form of PSD (Mora et al., 1998). IA can supply particle shape information and it can also be used to take on-line images. However, a significant number of particle images must be taken to generate good results, which can be time consuming.
Many research articles have reported the comparing of various techniques for PSD measurement using different particles (Hareland, 1994; Pierri et al., 2006; Fernlund, 1997). Nathier-Dufour et al. (1993) compared SA measurements of raw material used in foodstuff with those obtained using LD and found considerable discrepancies between the two methods which is attributable to the uncertainty of particle shape factors of different types of particle (fine, medium, coarse). As pointed out by Eshel et al. (2004), the lack of agreement between techniques could also be due to several sources of error, inherent in the design of different techniques. There is therefore considerable impetus to further study the effect of particle shape on PSD and compare the results obtained from each technique.
The aim of this work is to compare PSDs measured by different techniques and to assess the effect of particle shape on measured PSD results. To engineer this goal, four measurement techniques , (1) Image Analysis, (2) Laser Diffraction, (3) FBRM and (4) Sieve Analysis, were used.
Material and Methods
Sample Selection and Sieving
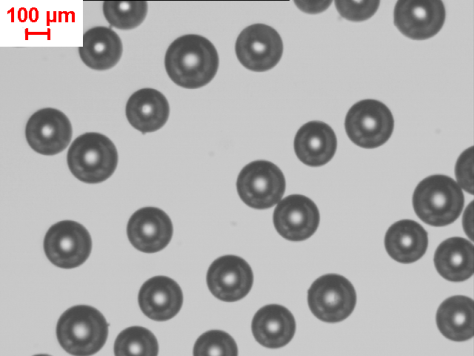
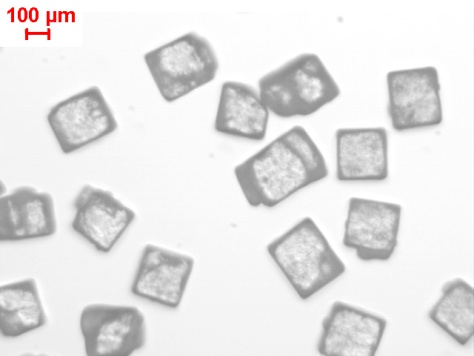
Two particulate products with different morphologies were selected: Sodium Chloride and Glass Beads. Figure 2 shows the shape of each material observed by microscopy. It can be seen that the Sodium Chloride appears to be in square shape (non-spherical) and Glass Beads are very regular with spherical shape.
Ten fractions of each material differing by their particle size distributions were obtained by sieving (106-125 µm, 125-150 µm, 150-180 µm, 180-212 µm, 212-250 µm, 250-300 µm, 300-355 µm, 355-420 µm, 420-500 µm and 106-500 µm). One more sample was prepared by mixing the same material smaller size particles with the larger size, by the ratio of 1:1 w/w (125-150 µm and 420-500 µm). The whole sample collection therefore included twenty- two samples in range 106-500 µm (two wide range samples, eighteen narrow fractions and two mixing range materials).
In theory, each sphere should just pass through a square mesh aperture which has internal side length dimensions equivalent to the diameter of the sphere, and therefore sieving should provide an accurate physical description of the size distribution of a population of spheres (glass beads).
(a)
(b)
Figure 2. Microscope images of Glass Beads (a) and Sodium Chloride (b) before image processing
Instruments
Laser Diffraction (LD).The Beckman Coulter LS-130 was used to measure the PSD of the proposed samples. The instrument measures the forward scattering (diffraction) of light from a single laser which has a wavelength of 750 nm and it uses the newPIDS i.e. Polarization Intensity Differential Scattering method (Beckman Coulter LS-130 user manual). The instrument has 126 photodiode detectors and can measure particles in the size range 0.4 to 900 µm. In all the experiments, the measurements were carried out in suspensions which were prepared in Silicon Oil. The refractive index of 1.49 was used for Silicon Oil. The obscuration of all samples in the LD experiments was maintained in the range 9%- 18%.
Image Analyses (IA).Ernst Leitz, Wetzlar microscope was used for IA. There is an automated camera and a television camera port fitted with the instrument for digital imaging. Images were captured using Aver-TV software. The processing, analysis and measurements were carried out using Photoshop and Image-J software. In the IA experiments, the particles were distributed on the slides and were measured from random orientations. More care was required to make sure the particles are separated completely. Roughly 600- 800 particles of each material in the specified range were analys ed (125-150 µm, 420-500 µm and 106-500 µm) in this study.
Image Processing
The basic procedure followed during the experiment for image processing is explained in Figure 3. The aim of the image processing was to obtain binary images of the individual particles. To achieve this, initial processing was carried out in Photoshop, which included image filtering (sharpening), border killing and debris removing. The images were then processed in Image-J to produce number based PSD of the particles. The number based PSD was converted to the equivalent spherical volume based PSDs to facilitate comparison with the other techniques.
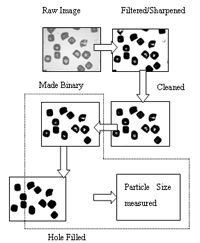 Figure 3 Procedure for Image Processing. The steps within the dashed box represent processing in Image-J. The procedure followed was: Start Image-J; Set Scale for individual lens; Set measurement (required parameters); select Image typeà8-bit; Select BinaryàMake binary; Fill hole; Analyse Particle to get the results.
Focused Beam Reflectance Measurement (FBRM).
A Lasentec (FBRM) was used to measure the chord length distribution (CLD) of samples using a Lasentec D600L FBRM probe. In all the experiments, the measurements were carried out in suspensions which were prepared in Silicon Oil. Sample suspensions were put into a 500 cm3 beaker and agitated using a pitched blade impeller at a speed of 400 rpm so that the sample was well dispersed in the solution. The measured chord count data were classified into 90 logarithmically spaced channels over the particle size range of 1-1000 µm. The data analysis software gives the CLDs in different formats. It has been reported that the conversion of measured CLD to its corresponding PSD is not straightforward (Kempkes et al., 2007; Wynn, 2003). Therefore the most suitable statistics of the measured CLD were directly compared with the PSDs measured by other techniques.
Results and Discussion
Two different particle samples, spherical Glass Beads and non-spherical Sodium Chloride, were used in the experiments. Shape factor is an effective means for the quantification of particle shape. Sphericity (S), a common shape factor, was calculated (for each particle) from image processing and analysed to consider the deviation of the shape of samples from ideal sphere. The means of sphericity are shown below for the Glass Beads (GB) and Sodium Chloride (NaCl), measured by IA.
Ideal sphere | GB | NaCl | |
| 125-150 μm by sieving | 1 | 0.90 | 0.78 |
| 420-500 μm by sieving | 1 | 0.90 | 0.85 |
| 106-500 μm by sieving | 1 | 0.91 | 0.83 |
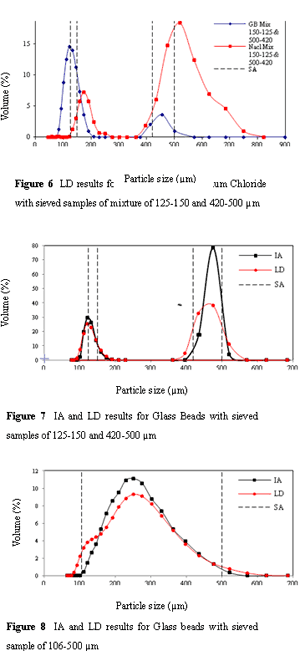
Figures 4, 5 and 6 show the PSDs obtained from LD instrument in comparison with individual sieved samples. From the results, it can be seen that the two methods give similar particle size range for the spherical glass beads but the LD results shifts towards the larger particle size with non-spherical sodium chloride.
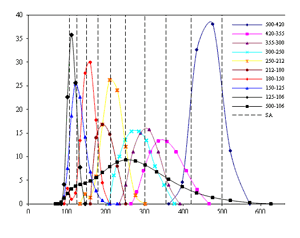
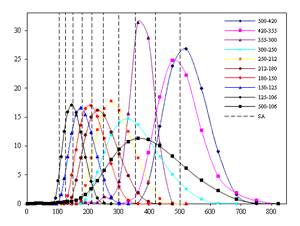
Figure 2. Microscope images of Glass Beads (a) and Sodium Chloride (b) before image processing
The SA does not measure the particle size of an individual particle and it is highly influenced by the particle form. During sieving, the particles in sieves rotate in all directions and hence the particle can pass through the sieves diagonally (along the least cross-sectional area of the particle). In contrast, the LD measures the particle size of an individual particle and hence LD results are shifted towards the larger particle size for non-spherical particles.
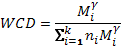
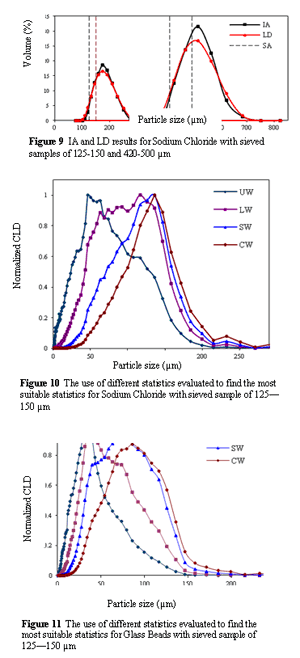
 Figures 7, 8 and 9 summarize the variations in the PSDs obtained using IA and LD for different ranges of sieved samples. The results obtained from the LD instrument have been directly used for comparison, whereas the conversion has been done from a number-based PSD to volume-based PSD for the IA measurements. The IA and LD gave very similar results for spherical particles, as these can reasonably accurately show relative volume fractions for individual particle sizes. IA produced the narrowest PSD as compared to other techniques which could be the result of limitation of image processing and analysis software used.
The FBRM results were obtained by converting the number-based CLD to its volume-weighted CLD without considering the translation of CLDs into PSDs. The use of different statistics was evaluated to find the most suitable statistics which resemble the PSD results obtained from other techniques.
The distributions in Figures 10 and 11 show U n weighted (UW), Length-weighted (LW), Square- weighted (SW) and Cube-weighted (CW) Chord Distributions. The Weighted Chord Distribution (WCD) was obtained via:
 ———–(1)
w here ni is the average number of count in a channel and Mi is midpoint of the channel size. T able 2 below shows how different types of weight procedures were used to calculate weighted distribution by varying γ:
By comparing, it can be confirmed that the square weighted Chord Distribution gives most similar results to those obtained by other techniques for the same individual sieved sample (125 -150 µm).
| Method | γ |
| Unweighted | 0 |
| Length-weighted | 1 |
| Square-Weighted | 2 |
| Cube-weighted | 3 |
 In Figures 12 and 13, the square-weighted Chord Length Distribution (SWCLD) by FBRM is plotted with the PSDs obtained by the other techniques, and it can be seen that the results still have some discrepancies between them. The parameters, such as the particles’ optical properties, dispersion of particles, the solvent used and the conditions of operation (such as stirring speed) can influence the results obtained from FBRM. It has also been proven that transparent particles (such as glass beads) do not possess either sufficient pulse strength or a short enough rise time, and therefore the FBRM instrument is proven to undersize the particles (Sparks and Dobbs, 1993; Tadayyon and Rohani, 1998).
Conclusion
Measuring the particle size is complex, because the techniques used to measure the PSD do not ‘directly’ measure the axial dimensions of the particles and the particle shape can affect the results obtained from these techniques. For spheres, the PSDs obtained by IA, LD and SA agree well, whereas the results are less consistent for non-spherical particles. SA is dependent on the overall particle shape, in particular the particles’ minimum projected area, and hence the resulting PSD can give a wider range than expected for non-spherical particles. In contrast to other techniques IA and LD give better estimation of several parameters that can be used to measure the PSD in a more refined way. Conversion among PSDs ob tained by these techniques (such as from number based to volume based in IA) is possible and can be done using different models/software.
CLD was obtained by FBRM, which is complex as it is dependent not only on PSD but also on particle optical properties. Therefore caution must be exercised when measuring the CLD of transparent particles (such as glass beads) as the instrument can undersize the particles. For simplicity, the conversion of CLD into its corresponding PSD was not done as it requires complex calculation and varying models. H owever this translation is necessary in many practical applications.
References
Chapeau V., Godino C., Hasapidis K. and O’Hagan P., 2008, Automating sieve size analysis.
Eshel G., Levy G. J., Mingelgrin, U. and Singer M. J., 2004, Critical evaluation of the use of laser diffraction for particle-size distribution analysis, Soil Sci. Soc. Am. J, 68, 736–743.
Fernlund J. M. R., 1997, The effect of particle form on sieve analysis: a test by image analysis, Engineering Geology, 50, 111–112.
Hareland G. A., 1994, Evaluation of flour particle size distribution by laser diffraction, sieve analyses and near-infrared reflectance spectroscopy, Journal of cereal science, 21, 183–190.
Hobbel E. R., Davies R., Rennie F. W., Allen T., Butler L. E., Waters E. R., Smith J. T. and Sylvester R. W., 1991, Modern methods of on-line size analysis for particulate process streams, Part. Part. Syst. Charact, 8, 29–34.
Kail N., Briesen H., and Marquardt W., 2007, Advanced geometrical modelling of focused beam reflectance measurements (FBRM), Part. Part. Syst. Charact, 24, 184-192.
Kail N., Marquardt W. and Briesen H., 2009, Process analysis by means of focused beam reflectance measurements, Ind. Eng. Chem. Res, 48:6, 2936–2946.
Kempkes M., Eggers J. and Mazzotti M., 2008, Measurement of particle size and shape by FBRM and in situ microscopy, Chemical Engineering Science, 63, 4656–4675.
Konert M and Vandenberghe J, 1997, Comparison of laser grain size analysis with pipette and sieve analysis: a solution for the underestimation of the clay fraction, Sedimentology, 44, 523–535.
Li M., Wilkinson D. and Patchigolla K., 2005, Comparison of
particle size distributions measured using different techniques, Particulate science and technology, 23:3, 265–284.
Mora C .F., Kwan A. K. H. and Chan H. C., 1998, Particle size distribution analysis of coarse aggregate using digital image processing, Cement and Concrete Research, 28:6, 921–932.
Nathier-Dufour N., Bougeard L., Devaux M-F., Bertrand D. and Le Deschault de Monredon F., 1993, Comparison of sieving and laser diffraction for the particle size measurements of raw materials used in foodstuff, Powder Technology, 76, 191–200.
Pieri L., Bittelli M. and Pisa P. R., 2006, Laser diffraction, transmission electron microscopy and image analysis to evaluate a bimodal Gaussian model for particle size distribution in soils, Geoderma, 135, 118–132.
Sparks R. G. and Dobbs C. L., 1993. The use of laser backscattered instrumentation for the online measurement of the particle size distribution of emulsions. Part. Part. Syst. Charact. 10, 279–289.
Tadayyon A. and Rohani B., 1998. Determination of particle size distribution by Par-Tec1 100: Modeling and experimental results. Part. Part. Syst. Charact. 15, 127–135.
Tinke A. P., Carnicer A., Govoreanu R., Scheltjens G., Lauwerysen L., Mertens N., Vanhoutte K. and Brewster M. E., 2008, Particle shape and orientation in laser diffraction and static image analysis size distribution analysis of micrometer sized rectangular particles, Powder Technology, 186, 154–167.
Wynn E. J. W., 2003, Relationship between particle-size and chord-length distributions in focused beam reflectance measurement: stability of direct inversion and weighting, Powder Technology 133:1–3, 125–133.
Yu Z. Q., Chow P. S., and Tan R. B. H., 2008, Interpretation of focused beam reflectance measurement (FBRM) data via simulated crystallization, Organic Process Research & Development , 12, 646–654.