The use of the harmonic analysis method for analysing tidal levels.
INTRODUCTION
Equilibrium Theory of the tides was the first attempt to describe tidal phenomena. Significant tide-producing forces on earth are caused by the relative configuration and motions of the earth-moon-sun system. Harmonic analysis is another way by which tides can be analysed. Since the tide is composed of various constituents that interact at the same time with the river flow, the resulting records of water levels in the river will show a rather complicated pattern. Harmonic analysis of the hourly water level of a station could be used to record individual interaction of each constituent of the tide in each month. The characteristics of the individual constituents of the tide can then be correlated with the river flow. There are nine constituents of the tide but the first four are the main ones and are analysed, based on their characteristics which are:
Table 1: Major tidal constituents
| No. | SYMBOL | CONSTITUTION | PERIOD, T (HOURS) | FREQUENCY, ω (RAD/HOUR) |
1 | M2 | Lunar Semi-diurnal | 12.42 | 0.5059 |
2 | S2 | Solar Semi-diurnal | 12.00 | 0.5236 |
3 | K1 | Luni-Solar diurnal | 23.93 | 0.2626 |
4 | O1 | Lunar declinational diurnal | 25.82 | 0.2433 |
5 | N2 | Larger Lunar elliptic Semi-diurnal | 12.66 | 0.4963 |
6 | M4 | First over-tide of M2 | 6.21 | 1.0118 |
7 | S4 | First over-tide of S2 | 6.00 | 1.0472 |
8 | MS4 | Compound Luni-solar | 6.10 | 1.0300 |
9 | M6 | Second over-tide of M2 | 4.14 | 1.5177 |
The harmonic analysis of tides is developed from the following two parts: the resultant tide at any location is composed of a finite number of constituents, each with its own periodicity, phase angle and amplitude and also the constituents are each simple harmonics in time and are mutually independent. i.e.
ɳ=ao+![]()
![]() ………………………..1
………………………..1
Where, ɳ = tidal level, ao= amplitude at mean water level, ai= amplitude at i-constituent, ![]()
![]() = phase angle at i- constituent, t= time.
= phase angle at i- constituent, t= time.
AIMS
The exercise is designed to illustrate how the measured water levels from an estuary can be analysed to produce harmonic tidal constants, how the tidal levels can be predicted using harmonic tidal constants and how to use dominate constants (M2, S2, K1 & O1) to identify a tidal type that can affect transport and engineering operations in an estuary.
HARMONIC ANALYSIS THEORY
Harmonic Analysis is the summation of the amplitude at water level and all the harmonic functions (M2, S2, K2, O1, N2, M4, S4, MS4, M6).
i.e.
ɳ=ao+![]()
![]()
Where ωi =![]()
![]() and φi= phase angle
and φi= phase angle
n= number of samples
i= 1……9
Where ao can be calculated from
ɳ=ao+![]()
![]()
We have
![]()
![]() =
= ![]() dt +
dt + ![]() [
[![]() t-
t-![]() )dt]
)dt]
As
![]()
![]() [
[![]() t-
t-![]() )dt] =0
)dt] =0
So,
![]()
![]() =
= ![]() ……………………………………………………….2
……………………………………………………….2
While ai (amplitude of constituents) can be decided by the following derivation:
ɳ=ao+![]()
![]() (Multiply through by sin(
(Multiply through by sin(![]() t))
t))
ɳ sin(![]()
![]() t) =
t) = ![]() sin(
sin(![]() t) +
t) + ![]() sin(
sin(![]() t)
t)
Integrate and take the limit of the above
![]()
![]() dt=
dt=![]() dt+
dt+![]() =
=![]() +
+![]() ]
]![]() dt
dt
=![]()
![]()
![]()
![]() dt +
dt + ![]() dt
dt
Using the features gives,
![]()
![]()
![]() dt =
dt = ![]()
![]()
Similarly we have:
![]()
![]()
![]() dt =
dt = ![]()
![]()
Or for ![]()
![]() we have,
we have,
= 
![]()
![]() can be decided as
can be decided as
![]()
![]() =
= ![]() ………………………..….3
………………………..….3
Or simply,
![]()
![]() = 2
= 2 ![]()
Phase angle φi is derived from:
We have,
![]()
![]() =
= ![]() (
( ![]() )……………………………………………………4
)……………………………………………………4
![]()
![]() =
= ![]() (
(![]() )
)
The tide is classified using the classification criteria given below:
F factor: F= ![]()
![]() ……………………………………………………………………5
……………………………………………………………………5
where the symbols of the constituents indicate their respective amplitudes.
Table 2: Classification of tides
| F | Category |
< 0.25 | Semidiurnal |
0.25-3 | Mixed (Mainly Semidiurnal 0.25 < F < 1.5) |
Mixed (Mainly Diurnal 1.5 < F < 3) | |
>3 | Diurnal |
RESULTS AND DISCUSSION
SOLUTION TO QUESTION 1
Based on the given template, reconstructing the water level changes relative to Chart Datum over a period of at least half a year at quarter-hourly intervals using the harmonic tidal data from Liverpool (Gladstone Dock) was done by calculating for the harmonic functions of each constituent (M2, S2, K1, O1, N2, M4, S4, MS4 and M6) of the template. A sample of the results is shown in Table 2.
Theory
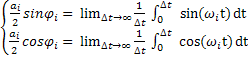
To obtain the values of A1, B1, A2, B2, A3, B3, A4, B4, A5, B5, A6, B6, A7, B7, A8, B8, A9, B9, manually, we would first need to calculate the individual component for each, using equation 6 and equation 7, after which, the sum of each column divided by the total number of samples (n) will give the corresponding value for each of the terms. To do this we need the parameters ωi for each of the tidal constituents which can be found in Table 1, above, over a range of time t
ηsin (ωit)..……………………………………….………………….6
ηcos (ωit)………………….…………………………………………7
Ai =![]()
![]() )..……………………………………………..8
)..……………………………………………..8
Bi =![]()
![]() )..……………………………………………..9
)..……………………………………………..9
Where, ɳ = tidal water level at a particular time (m)
ωi = angular frequency at a particular time (rad/hr)
t= time (hrs)
i= 1-9
n= number of samples considered
Substituting the parameters into the equations above we obtain the same values for A1…B9 as shown in Table 3 below.
SOLUTION TO QUESTION 2
Carrying out harmonic analysis on the data in Table 3, we can find out the harmonic constants based on the formulae given below (the summation of the observed data over a range of samples and then divided by the sum by the total number of samples being considered).
i.e.
From Table 3 to calculate the constants a0 , ![]()
![]() and
and![]() :
:
For i =range of 1 – 9
a0 = ![]()
![]()
where n= number of samples being considered (18801)
Therefore,
a0 =![]()
![]() )/(18815-15+1)
)/(18815-15+1)
a0 = ![]()
![]()
a0 =5.30525
while
![]()
![]() =
= ![]() =
= ![]()
or simply,
![]()
![]() = 2
= 2 ![]()
by substituting into the above equation for when i=1, 2, 3……….9, we have
for i=1
![]()
![]() = 2
= 2 ![]()
where A1=-1.130 and B1=0.977 (from Table 3)
![]()
![]() = 2
= 2 ![]() =2.9880
=2.9880
Similarly, all other constants for each constituent are calculated using the same method as above.
Likewise for the phase angle from i=1, 2, 3,……..9 going by the formulae
For i=1
![]()
![]() =
= ![]() (
(![]() )
)
where A1=-1.130 and B1=0.977
![]()
![]() =
= ![]()
![]()
![]()
![]() =-0.85788
=-0.85788
In the same way, the rest of the phase angle for each constituent is calculated. See Table 3 for the full results of all the constituents.
Table 3: The Harmonic Constants (a0, ai and φi)
| Port: | P234 | Consti | M2 | S2 | K1 | O1 | N2 | M4 | M6 | S4 | MS4 | |||
| Site: | Liverpool | (Gladstone | Dock) | i = | 1 | 2 | 3 | 4 | 5 | 6 | 7 | 8 | 9 | |
| Latitude: | 53.4497 | ωi = | 0.5059 | 0.5236 | 0.2626 | 0.2433 | 0.4963 | 1.0118 | 1.5177 | 1.0472 | 1.03 | |||
| Longitude: | -3.0181 | ai = | 2.9882 | 1.0218 | 0.1221 | 0.1372 | 0.6168763 | 0.2341694 | 0.0505411 | 0.0221983 | 0.104331 | |||
| Start | Date: | 01JAN2005-00.00.00 | φi = | -0.8578 | -0.7361 | -0.8295 | 1.5594 | -0.729238 | 0.0460049 | -0.633921 | 0.1507001 | 1.106581 | ||
| End | Date: | 31DEC2005-23.45.00 | n = | 18801 | a0 = | 5.3053 | ||||||||
| Contributor: | Proudman | Oceanographic | Laboratory | F= | 0.064664 | (Semidiurnal) | ||||||||
| Datum | information: | The | data | refer to | Admiralty | (ACD) | Chart | Datum | ||||||
| Parameter | code: | ASLVBG02 | = | Sea level | Bubbler | (second | tide | sensor) | gauge |
The calculated constants in summary
M2 | S2 | K1 | O1 | N2 | M4 | M6 | S4 | MS4 | |
ai = | 2.9882 | 1.0218 | 0.1221 | 0.1372 | 0.6168763 | 0.2341694 | 0.0505411 | 0.0221983 | 0.104331 |
φi = | -0.8578 | -0.7361 | -0.8295 | 1.5594 | -0.729238 | 0.0460049 | -0.633921 | 0.1507001 | 1.106581 |
n = | 18801 | a0 = | 5.3053 |
SOLUTION TO QUESTION 3
Comparing the predicted and the observed tidal water level, Figure 1 shows the graph of the observed and predicted tidal water level against time.
The observed and predicted values are taken from Table 3, and t = 0, 0.25, 0.5…371.25 hours.
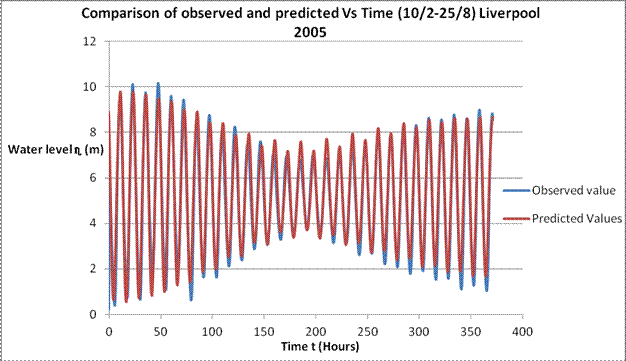
Figure 1: Plot of comparison between observed water level and predicted water level vs. time
Figure 1 above gives the graph of both observed and predicted tidal levels against time (every quarter of an hour). It can be seen that the predicted values obtained were all positive; there were no negative values. Also from the graph it can be seen that the predicted value has a very close relationship with the measured value. If more constituents are used in the calculation, accuracy is improved. (In this case, all nine constituents were used)
SOLUTION TO QUESTION 4
Plotting of the individual constituents (M2, S2, K1, & O1), as shown in Figure 2 below, is done by calculating the equations below. The summary is given in Table 4:
η = a0 +a1 cos(ω1t – φ1) + a2 cos(ω2t – φ2) + a3 cos(ω3t – φ3) + a4 cos(ω4t – φ4)……..10
M2 = a1 cos(ω1t – φ1)……………………………………………………………………………………….11
Ss = a2 cos(ω2t – φ2)……………………………………………………………………12
K1 = a3 cos(ω3t – φ3)…………………………………………………………………..13
O1 = a4 cos(ω4t – φ4)…………………………………………………………………..14
The coefficient tidal values are taken from Table 4, and t = 0, 0.25, 0.5…146.25 hours.
Table 4: The Values for the Four Main Constituents
| Time(hours) | M2 | S2 | K1 | O1 |
0 | 1.954719 | 0.75721 | 0.082444 | 0.001565 |
0.25 | 1.654006 | 0.661187 | 0.076358 | 0.009903 |
0.5 | 1.326871 | 0.55385 | 0.069944 | 0.018203 |
0.75 | 0.978539 | 0.437037 | 0.063229 | 0.026437 |
1 | 0.614576 | 0.312747 | 0.05624 | 0.034572 |
1.25 | 0.240795 | 0.183105 | 0.04901 | 0.04258 |
1.5 | -0.13683 | 0.05033 | 0.041569 | 0.05043 |
1.75 | -0.51227 | -0.08331 | 0.033948 | 0.058094 |
2 | -0.87953 | -0.21552 | 0.026181 | 0.065543 |
2.25 | -1.23274 | -0.34404 | 0.018301 | 0.072749 |
2.5 | -1.56626 | -0.46668 | 0.010343 | 0.079687 |
2.75 | -1.87475 | -0.58133 | 0.00234 | 0.086329 |
3 | -2.1533 | -0.68603 | -0.00567 | 0.092653 |
3.25 | -2.39745 | -0.779 | -0.01366 | 0.098633 |
3.5 | -2.6033 | -0.85864 | -0.02159 | 0.104249 |
3.75 | -2.76756 | -0.92358 | -0.02943 | 0.10948 |
4 | -2.88761 | -0.97273 | -0.03714 | 0.114305 |
4.25 | -2.96154 | -1.00523 | -0.04469 | 0.118708 |
4.5 | -2.98815 | -1.02052 | -0.05205 | 0.122671 |
4.75 | -2.96703 | -1.01836 | -0.05918 | 0.126181 |
5 | -2.89852 | -0.99878 | -0.06606 | 0.129224 |
5.25 | -2.7837 | -0.9621 | -0.07265 | 0.131789 |
5.5 | -2.62441 | -0.90896 | -0.07893 | 0.133867 |
5.75 | -2.4232 | -0.84027 | -0.08487 | 0.13545 |
6 | -2.18328 | -0.7572 | -0.09045 | 0.136532 |
6.25 | -1.90848 | -0.66118 | -0.09563 | 0.137109 |
6.5 | -1.60319 | -0.55384 | -0.10041 | 0.137178 |
6.75 | -1.2723 | -0.43703 | -0.10475 | 0.136741 |
7 | -0.92108 | -0.31274 | -0.10864 | 0.135797 |
138.5 | -0.7076 | -0.55371 | 0.107173 | 0.102999 |
138.75 | -1.06816 | -0.43688 | 0.110779 | 0.097298 |
139 | -1.41166 | -0.31258 | 0.113908 | 0.091237 |
139.25 | -1.7326 | -0.18293 | 0.116545 | 0.084839 |
139.5 | -2.02587 | -0.05016 | 0.118681 | 0.078127 |
139.75 | -2.28677 | 0.083478 | 0.120305 | 0.071125 |
140 | -2.51114 | 0.215686 | 0.121411 | 0.063861 |
140.25 | -2.6954 | 0.344202 | 0.121994 | 0.056361 |
140.5 | -2.8366 | 0.46683 | 0.122052 | 0.048652 |
140.75 | -2.93249 | 0.58147 | 0.121583 | 0.040763 |
141 | -2.98153 | 0.68616 | 0.120591 | 0.032724 |
141.25 | -2.98294 | 0.779111 | 0.119079 | 0.024563 |
141.5 | -2.93671 | 0.85873 | 0.117054 | 0.016311 |
141.75 | -2.84355 | 0.923656 | 0.114525 | 0.008 |
142 | -2.70498 | 0.972778 | 0.111502 | -0.00034 |
142.25 | -2.52319 | 1.005256 | 0.107999 | -0.00868 |
142.5 | -2.3011 | 1.020533 | 0.104031 | -0.01699 |
142.75 | -2.04224 | 1.018349 | 0.099614 | -0.02523 |
143 | -1.75077 | 0.99874 | 0.094769 | -0.03339 |
143.25 | -1.43132 | 0.962042 | 0.089515 | -0.04142 |
143.5 | -1.08901 | 0.908884 | 0.083875 | -0.04929 |
143.75 | -0.72931 | 0.840174 | 0.077874 | -0.05698 |
144 | -0.35795 | 0.757089 | 0.071537 | -0.06447 |
144.25 | 0.019126 | 0.661049 | 0.064893 | -0.07171 |
144.5 | 0.395895 | 0.553699 | 0.057968 | -0.07869 |
144.75 | 0.76634 | 0.436875 | 0.050794 | -0.08537 |
145 | 1.124543 | 0.312575 | 0.043401 | -0.09175 |
145.25 | 1.464782 | 0.182928 | 0.035821 | -0.09778 |
145.5 | 1.781622 | 0.05015 | 0.028087 | -0.10345 |
145.75 | 2.070001 | -0.08349 | 0.020232 | -0.10874 |
146 | 2.325312 | -0.21569 | 0.012289 | -0.11362 |
146.25 | 2.543477 | -0.34421 | 0.004294 | -0.11809 |
The plotting produced is a cos function.
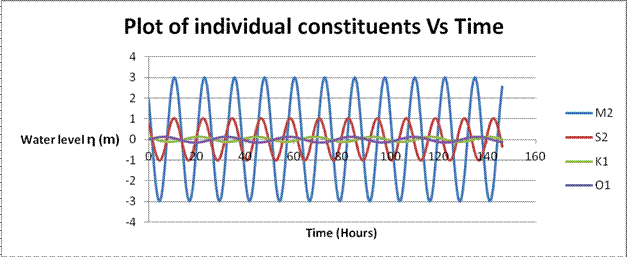
Figure 2: Plot of the individual constituents (M2, S2, K1 & O1) vs. timeSOLUTION TO QUESTION 5
In order to decide what type of tide it is at this location we use the formulae given below:
F factor: F= ![]()
![]() =
= ![]()
Where K1= a3 = 0.1221
O1= a4 = 0.1372
M2= a1 = 2.9882
S2= a2 = 1.0218
Substituting into the equation above we have:
F= ![]()
![]()
F= 0.064663.
From Table 2 above, the value of F falls in the category of “SEMIDIURNAL” (0.064< F< 0.25).
Therefore the type of tide at this location is the SEMIDIURNAL TIDE.
SOLUTION TO QUESTION 6
- The harmonic analysis method is a very good method for predicting tidal level
- It can enable us to predict future values of the tidal level since we know that tidal levels in estuaries don’t change often. i.e. they have a similar pattern over a period of time
- The results that are obtained by this method will be more accurate if more constituents are considered
- Taking a regular and consistent reading/ measurement we can also reduce the error in the analysis, because if the reading is not done in a regular way then the result would be wrong and inaccurate.
- This method is more straightforward and easier to use.
- It allows a larger data sample in the analysis
CONCLUSION: The Harmonic analysis is a better method for analysing tidal levels. Further, it gives the option of using more than the four main constituents, which gives it an edge over other methods. In short, it is better, faster and easier to use.