The Recession and its Impact on the Automotive Industry in the UK
CHAPTER 1
INTRODUCTION
The automotive industry is recognised as the engine room of Europe and its economy. Europe provides the opportunity and freedom for the competitive and innovative automobile industry to flourish. As the figures indicate, there were more than 3000 businesses related to the automotive industry with an overall manufacturing workforce of 180,000 and the GVA in excess of €11,000 million (BERR 2009, cited in MacNeill, S 2010, p. 6). As well as this, another 552,000 people were involved in the retail and fuel sectors. Various automobile companies like Toyota, Nissan, Honda and BMW have made many inward investments on the basis of the various government policies and flexible labour laws. Data given by the international Organisation of Motor Vehicle Manufacturers (OICA) shows that between 1997 and 2009, the total world motor vehicle production increased by 16 per cent to 61.7 million vehicles. The USA, Japan and Europe represented 77 per cent of global production in 1997, but by 2009, this had declined by 50 per cent. Evidence provided by the OICA indicates that the global turnover of the automotive industry was close to two trillion Euros in 2005 (Baileya, D. et al., 2010, p. 312)
1.1 Similarities and Dissimilarities of the Great Depression and the Recession
A statement released by the G20 leaders on the 2 April 2009 ardently declared, ‘We will not repeat the historic mistake of the protectionism of the previous eras’. Here the reference was clearly to the Great Depression of the 1930s that was being compared with the world’s recent economic and financial crises involving ‘A plummeting stock market, collapsed world trade, sharp rise in the unemployment rates and even threat of deflation’. From the early 1930s until 1932 a wide range of controls and limitations such as ‘high tariffs, new import quotas, and controls on foreign exchange transactions had been imposed around the world. The trade volume fell by 26% between 1929 and1932 (fig 1.1)’ (Irwin,D.A, 2009, p-15).

Figure 1.1 World trade and world production 1926–1938.
Source: Irwin, D.A. 2009, p- 39 (League of Nations)
Madsen’s (2001) calculations show that low income accounted for 45 per cent of this decline and 55 per cent of the decline was due to an increase in the tariff and non- tariff barriers to trade. However it should be pointed that the current world economy is very different from the 1930s (Madsen, J.B. 2001, cited in Irwin, D.A. 2009, p.19).
1.2. Aims and Objectives of the Research
The aims of this study are:
- To study the effect of economic crises on the automotive industry in the North East region.
- To study the causes of the crises affecting sales in the North East.
- To examine the development and plans employed by the automotive industry to challenge insolvency and build success.
- To study government support and schemes implemented for the automobile sector during the recession.
- To investigate the competition of the used car market for the new car market.
CHAPTER 2
LITERATURE REVIEW
2.1 What is a Recession?
A recession is characterised by a sharp decline in trade and manufacturing that leads to twice as much decline in the production units. The current economic downturn was stimulated by the financial and banking losses in the USA debt market that led to the breakdown of the credit market. This had a global affect on industries and individuals. Arthur Burns and Wesley Mitchell (1946) offered a definition of a recession: ‘The business cycles are a type of fluctuation found in the aggregate economic activity of nations that organise their work mainly in business enterprises: a cycle consists of expansions occurring at about the same time in many economic activities, followed by similarly general recessions, contractions, and revivals which merge into an expansion phase of the next cycle’. (Burns, Arthur F. et al., 1946, p. 3)
The NBER (National Bureau of Economic Research) defines recession more precisely:
“A recession is a significant decline in economic activity spread across the economy, lasting more than a few months, normally visible in real GDP, real income, employment, industrial production, and wholesale-retail sales. A recession begins just after the economy reaches a peak of activity and ends as the economy reaches its trough. Between trough and peak, the economy is in an expansion. Expansion is the normal state of the economy; most recessions are brief and they have been rare in recent decades.” (NBER, 2003, available on http://www.nber.org/cycles/dec2008.html visited on 1/9/2011).
2.2 History of the UK Recession
Global recession is not a new phenomenon. There is historical evidence that in the past three decades there have been three global recessions which affected different countries in different ways. During these periods, the global per capita output rate was estimated to be either zero or negative. The UK economy has been affected by six recessions. The first was the recession after World War I from 1919 – 1921 which lasted for three years. Second, the Great Depression lasted for two years, from 1930 – 1931. The major cause for this was the depression in the USA which lead to high rates of interest and a reduction in demand for UK exports. However, the UK suffered less during this depression then the USA. The third, caused by the oil crisis, came in the mid-1970s and lasted for almost two years. The next came in the early 1980s and also lasted for two years. During this recession, the unemployment rate increased to 124 per cent. The fifth recession was in the early 1990s, lasted for two years and was marked by a very high budget deficit. Unemployment rose to 55 per cent and it took 13 quarters for the GDP to recover. The sixth recession was in late 2000s (2007–2009) and we are still trying to overcome this recession (http://www.articlesbase.com/international-business-articles/global-recession-and-its-impact-on-uk-labor-market-2693150.html, visited on 27/05/11).
2.4 The Automobile Industry as a Global Prospect
During the most recent recession, the automotive industry was the second most affected business sector, after the banking sector. Although it is assumed that the automobile industry is very small, the reality is that the industry interrelates with many other parts of the economy, making the automotive industry a strong business generator in the worldwide market. The automotive industry’s peaks follow those of the business cycle; the patterns are parallel, with the business cycle always outperforming the automobile industry.
The current evidence from the USA and Canada related to the fall in the sales of cars is that this is related to the lack of credit available to consumers and the high rate of interest on the loans for their repayment. These factors result in people making decisions not to buy cars at that time. However, the government introduced many other incentives to encourage consumers to buy cars and increase the car sales. An example of this was the scrappage scheme.
Talking about the recent change in the economic climate and considering recent studies, one can easily assume that the Asia-Pacific nations like China, Russia and India were not highly affected by the recession that started in mid-2008. However, their sales did fall by some points, although this drop was not much when compared to the effect on the bigger markets like the USA, the UK and Europe. To talk about the current change in the economic climate with reference to the prospect of the automotive industry in various parts of the globe, we will consider the countries that are part of the foundation called the OECD.
According to Ramsay and Wine (2005), “Fluctuations in activity in the automobile industry display stronger amplitude than the economy-wide and the manufacturing business cycle. The variance of automobile production growth is also larger than the one of business investment growth. As in the wider economy, the fluctuations appear to have declined since the 1990s in the automobile industry. This is due, to a large extent, to improved inventory management techniques and more stable automobile sales.” (Ramey et al. 2005).
Table 2.2 shows how automobile production is more volatile than GDP and Investments.
Table 2.2: Automobile production is more volatile than GDP and investment

Source: Bundesbank; INSEE; Data stream; OECD Economic Outlook 86 and Main Economic Indicators. (www.oecd.org)
The studies emerged from various aspects; in mid-2008, every country involved in the OECD saw a massive drop in the sales of cars. From Figure 2.5, the OECD countries (consisting of US, Germany, United Kingdom, Turkey, etc.) experienced a down-turn in term of production and sales. There was about a 20 per cent fall in the sales of cars. In Europe, the sales in this particular segment were different. The sales of the higher-value or higher priced cars were affected the most while the sales of small cars sales were less affected between the periods September 2008 to February 2009.
The same scenario was noted in the leading automobile companies such as Ford, General Motors and Chrysler in the USA. In mid-2008, at the start of the economic crisis, Ford, GM and Chrysler asked the government for a loan to help them. After their unsuccessful appeal to the government, multinational companies like General Motors and Chrysler were on the verge of bankruptcy (2009, available on http://www.economist.com/node/13726167).

Figure 2.5: Car-sale growth
Source: www.oecd.org
Considering the sales of cars from mid-2008 until early 2009, the only country that was unaffected by the economic change was China. The sale of the cars in China, related to production, were almost the best in the period September 2008 to January 2009. Even the second quarter of the period February 2009 to August 2009 shows very positive sales in the records. The lower exports had very little impact on the automobile industry in China (Liu et al., n.d, p. 2).
This change in the economy meant that customers’ point of view was not to go for a new car during that period. The factors which certainly stopped the customers were the rising interest rates on loans, the rising unemployment rate that resulted in a lack of income so that potential buyers could not think about a car, and, last but not least, the main thing necessary for day-to-day life in the case of car owners was the strong increase in oil prices. Due to all these factors, the automobile industry had to classify its models according to different criteria such as small cars, lower-medium cars and executive categories. In Europe, the small car registrations were not as affected as the other categories. Figure 2.6 elaborates on some new car registrations in Europe during this economic change.]
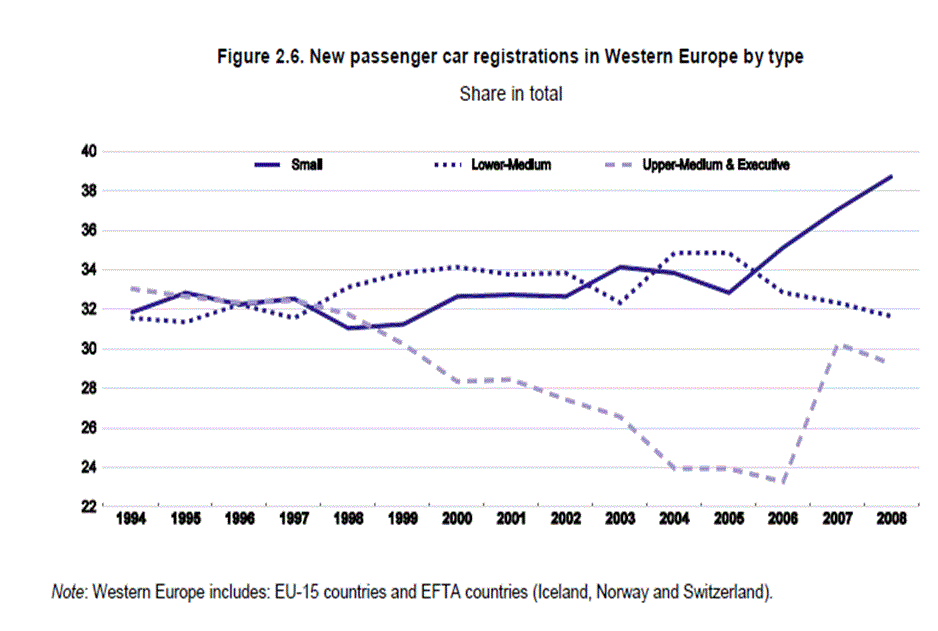
Figure 2.6. New passenger car registrations in Western Europe by type
Source: Association Auxiliaire de l’Automobile (AAA).
Seen from the perspective of the OECD countries, it was clear that the economic change that started during mid-2008 had affected almost the entire automotive industry in various sites. But during this time it is also clear that the automotive industry in most of the Asia-Pacific countries, like China and India, was not affected by this recession. Table 2.3 highlights related production levels and the growth in sales in the countries which produced over a million units during 2008.
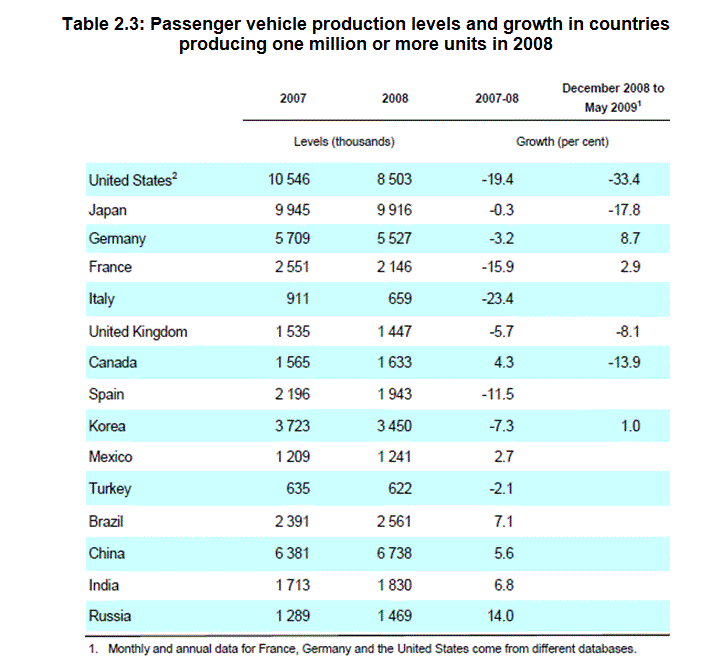
Table 2.3: Passenger vehicle production levels and growth in countries producing one million or more units in 2008
Source: International Organization of Motor Vehicle Manufacturers, INSEE, Bundesbank, Main Economic Indicators, (WardsAuto.Com), PriceWaterhouse Coopers’ Automotive Institute.
Chapter 3: RESEARCH METHODS
3.1. The research method used in this study
This study investigates the effect of recession on the automobile industry in North East England which includes Newcastle upon Tyne, Gateshead, Sunderland, North Tyneside, South Tyneside and the Middlesbrough region. The research methods used in the study include primarily the collection of the secondary data from various books, research articles, newspapers, reviews, company’s sites, etc., related to the research topic. This is followed by primary data collection using a quantitative research method.
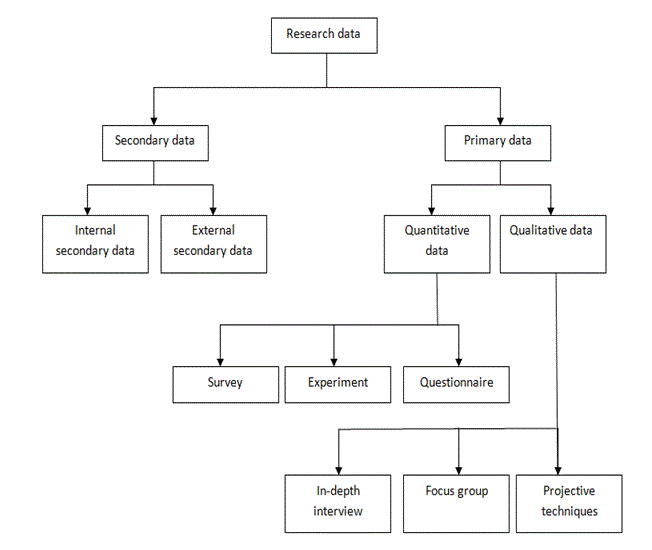
The researcher used a quantitative research method in the form of a questionnaire to obtain information from various respondents related to the automotive industry. The questionnaire included general information about the respondents, organisational pressures experienced during the recession, organisational threats during the recession, factors affecting customers’ demands, government assistance and organisational performance. The model questionnaire comprised 21 questions that involved dependent and independent questions in the ratio of 4:1.
CHAPTER 4
DATA ANALYSIS AND DISCUSSION
4.1 Representation of Data Collection Relevant to Questions Aimed at General Information
The data for the quantitative data and information collected through the survey was analysed by using the SPSS statistics software. This was in accordance with the predetermined strategy as mentioned in the research methodology. Figure 4.1 below presents the respondents from the six selected locations for the survey. It shows that there were only four respondents from the other areas.
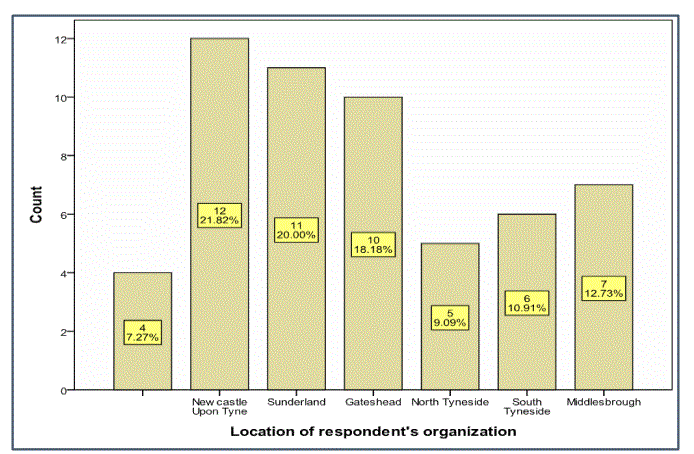
FIGURE 4.1: Number of respondents from selected locations.
Moreover, the respondents approached were from different working groups. Of the 51 respondents who responded fully, there were seven managers, ten supervisors, seventeen sales advisors, seven agents and ten from other staff categories. Apart from this, their different age categories are evident from Figure 4.2 below.
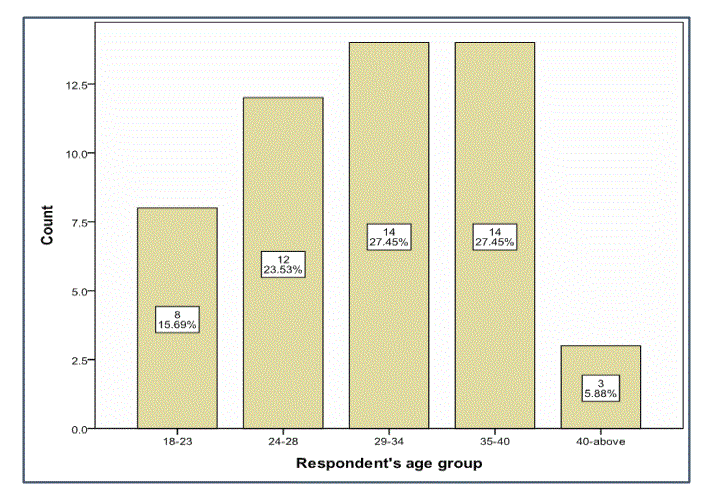
FIGURE 4.2: Different age categories of the respondents.
Figure 4.3 shows the percentages related to the different car categories dealt by the respondents within their respective organisations. The mass market was the most popular category, followed by the specific market category and the luxury car category. SUVs were traded less than any other category in the respondents’ respective organisations.
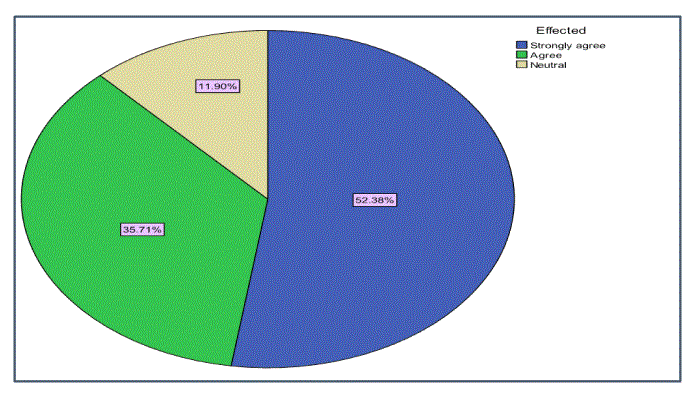
The sampled population also responded when asked about the fact that the recession was a key player in reducing car sales after 2008. Their responses are shown below in Figure 4.4. The figure depicts the percentages related to different answer options mentioned on the scale used in questionnaire.
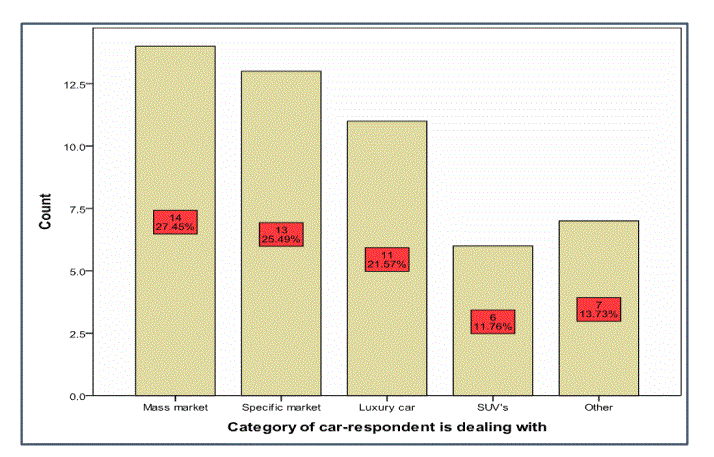
FIGURE 4.3: Percentage of different car categories dealt with by respondents
.
FIGURE 4.4: Responses regarding the effect of the recession on car sales
Further discussion about the questions which directly relates to the achievement of aims and objectives presented at the beginning of this document and graphic and statistical representation follows in the next section.
4.2 Representation of Data Collection Relevant to Questions Aimed at Organizational Pressures During The Economic Downturn.
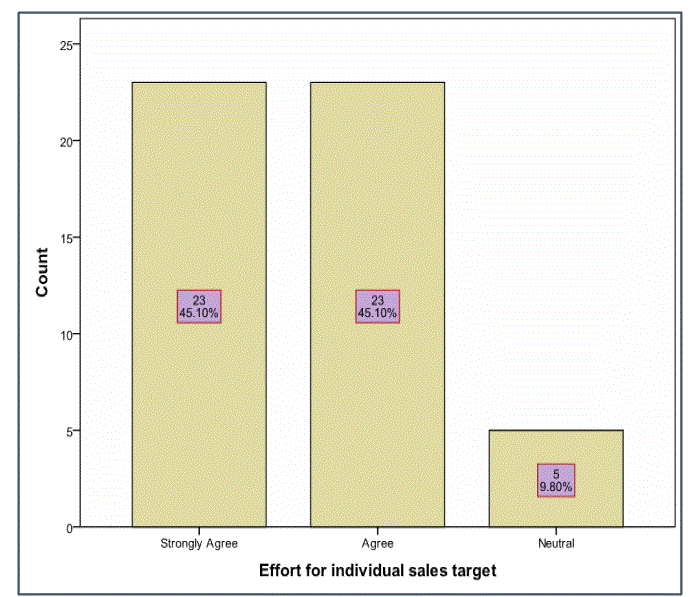
Figure 4.5: Overall Responses for Survey Question 7
It is obvious from the above figure that most of the 51 respondents agreed that the staff members in different automobile companies felt individually responsible and attempted to push up the car sales. A more precise figure is that 46 out of 51 respondents agreed and five respondents remained uncommitted in terms of individual employees’ efforts to target sales during the economic downturn. There was no evidence of any disagreement to the question asked.
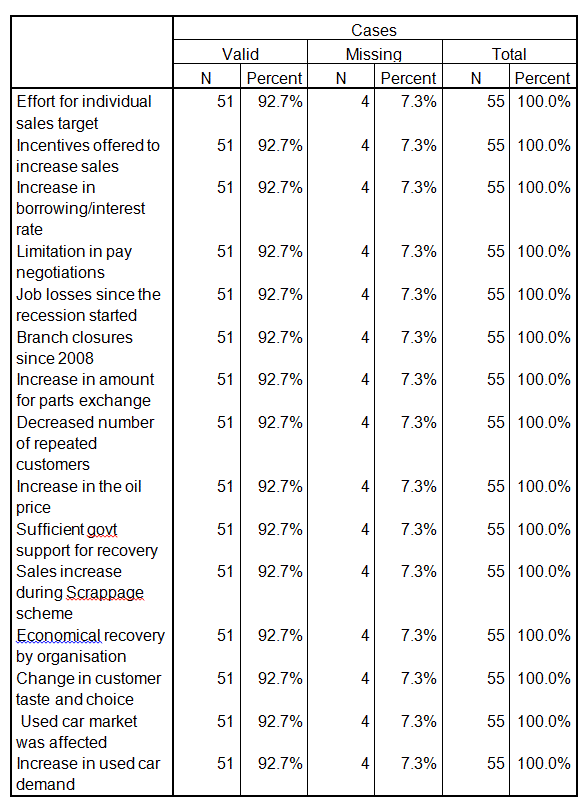
4.6 Case processing summary:
It can be noticed that 55 (100 per cent) respondents answered all the questions given in the questionnaire. Four (7.3 per cent) of the sampled population, were ‘missing’. These did not respond to all of the different questions. In the survey conducted, all the respondents were asked all the questions in the questionnaire which is why the sample size is one hundred per cent.
4.7.2 Discussion of reliability statistics:
A reliability analysis enables an examination of the attributes of measuring scales (mostly the Likert scale) and the items relevant to these scales. The reliability analysis process computes a large amount of the most frequently used measurement scales and offers information regarding the relations among single items on the scale (Indiana State University 2005).
Cronbach’s alpha is generally used as a measure of internal consistency. It is also called a coefficient of reliability.
Cronbach’s alpha can be written as:

Where,
N- number of items
c- bar is the inter-item covariance
v- bar is the average variance.
According to UCLA, It is important to note that, ‘if the number of items increases then the Cronbach’s alpha also increases but if the average inter-item correlation is low, alpha will be low and if there is increase in the inter-item correlation increases then Cronbach’s alpha also increases’. (UCLA, http://www.ats.ucla.edu/stat/spss/faq/alpha.html)
Table :Reliability Statistics
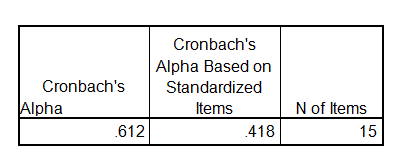
The above table shows that the Cronbach’s alpha is 0.612, suggesting that it is close to 0.7. This score is considered to be reliable for the measurement scale used. George and Mallery (2003, p. 231) provide the following rules of thumb:
‘_ > .9 – Excellent, _ > .8 – Good, _ > .7 – Acceptable, _ > .6 – Questionable, _ > .5 – Poor, and_ < .5 – Unacceptable’.
CHAPTER 5
CONCLUSION
Cars, busses and other vehicles are the means of transport for most of the population and commercial businesses. This research studied the effects of the recession on the automobile industry in the north-east of England using a survey questionnaire and data analysis. For this study, the survey was carried at six different places in the North East of England and 55 different respondents from various organisations were approached. However, only 51 responded and contributed to the findings of the research.
The data collected was analysed with SPSS and it was concluded that the recession had a considerable effect on the automobile industry. Applying the data analysis, the Cronbach’s alpha reliability coefficient, which was 0.612, is not conclusive. However, since there has been no previous research in the North East region, the conclusions cannot be denied. Further research and investigation could give a better understanding and add stability to the findings.
Therefore there is further need for study and analysis of the consequences of the crisis in the North East region and the overall aspects affecting it.