Essay on Financial Modelling
Number of words: 3304
Introduction
Financial modeling is a broad concept that most organizations adopt to represent financial matters in a real-world situation. Financial modeling is a mathematical representation model that entails the performance of various financial assets within a given organization. The model is used in the representation of portfolio investment practices, projects, and business performances. The main objective of financial modeling is to analyze business valuation to enhance growth, allocate capital, budget, and forecast on investment projects, enhance mergers and acquisitions, and promote capital within the business. Different approaches to financial modeling help the business to venture into growth opportunities. These approaches include three statement models, Merger Model (M&A), Discounted Cash Flow Model (DCF), Consolidation Models, Budget Model, and Initial Public Offer Model (IPO). These models use financial statements and investment analysis through spreadsheets, organization valuations, budgeting, and forecasting techniques. PK Mart uses Budget Model in determining whether or not a profit-sharing scheme is viable for its employees. With an in-depth quantitative analysis using descriptive statistics and an excel worksheet model, the company can easily formulate a profit-sharing approach to easily mitigate the benefits. Correlation techniques are used in analyzing the relationship between the various variables within the industry. These variables include Return on Capital Employed, Productivity, Employee Commitment, Profit Sharing Scheme, Book Value of Assets, and Market Power in relation to the market share and the type of industry. Various frameworks are generated to provide quantitative statistical analysis.
Graphical Representation
Box Plots are useful in providing a visual analysis of the data provided, assisting researchers and examiners to easily identify the mean values, dispersion, and skewness in a data set. Wegman (2018) suggests that box plots provide approximately 25% of the data in a set in each section. A box Plot usually contains the minimum value, the median, upper and lower quartile values, and the maximum value of a data set. The graphs below show the box plot of Return on Capital Employed upon implementation of the scheme.
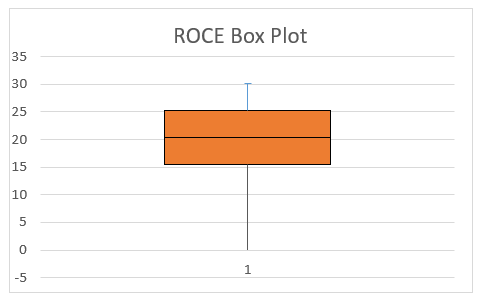
Fig 1. ROCE and Profit Sharing Scheme Implementation Box Plot
From Figure 1, it is evident that the box plot shape is normally distributed, that is, no positive or negative skew. However, the dispersion of values is more below the mean. This indicates that values are scattered and do not compel towards the mean. The shape shown in Figure 1 indicates that the variable ROCE is normally distributed to the Scheme implementation plan, which is different from Figure 2 below.
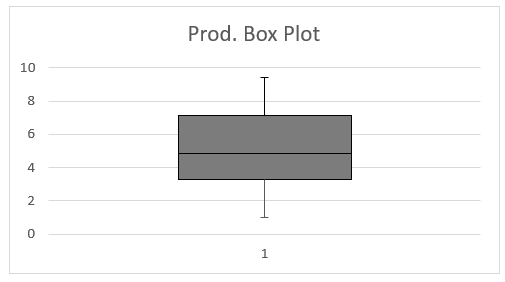
Fig 2: Productivity and Profit Sharing Scheme Implementation
The figure above clearly indicates a positive skew in Productivity. This indicates that most of the data in the data set provided are above the mean. The data between the lower and upper quartile are normally distributed, as seen in the graph. The value of min and max are concentrated around the mean hence making it feasible for representation. Despite an ultimate conclusion on positive correlation, the variable prospect excellent results to the scheme implementation plan. Figure 3 shows how employee commitment reacts to the profit-sharing scheme upon implementation. There is a positive skew, as shown in the graph below.
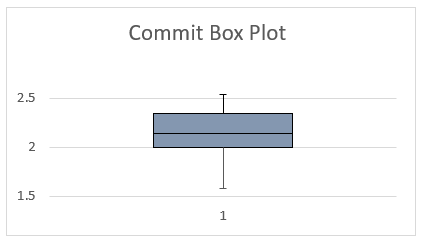
Fig 3: Employee Commitment and Profit Sharing Scheme
There is a minimal data set that is above the mean as physically seen from the box plot. This indicates that the values are above the mean; hence there might be a possibility of positive results upon implementing the profit-sharing scheme. The type of industry does not configure to the profit-sharing scheme hence omitted in providing an in-depth analysis of the data (Obed & Goralczyk, 2020). However, a discrepancy in the Book Value of the asset and the market power since it is illogical for the two variables to correlate with the profit sharing scheme. However, figure 4 and 5 provides the graphical representation of the two variables. There is a negative skew in the graphs indicating a negative possibility in Productivity upon implementation of the scheme. This concept declares the variables null.
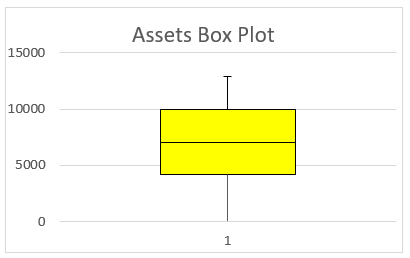
Fig 4: Book Value of Assets and Profit Sharing Scheme
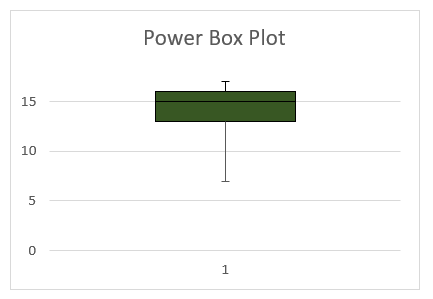
Fig 5: Market Power and Profit Sharing Scheme Implementation
With the graphs represented above, it is evident that the return on capital employed (ROCE), Productivity, and Employee Commitment have a higher mean than the means of the market power and book value of assets. The interquartile ranges between the variables determine how much viable a project can be upon implementation. Various approaches to consider interquartile differences are to look at the skewness of the graph. It is evident that the first three variables, ROCE, Prod, and Comm., indicate that the variables positively impact the start of the project. This indicates that on an average scale, the company sets to increase Productivity upon implementing the profit-sharing scheme. Visualizing a box plot and interpreting it allows potential researchers to forecast the impacts of profit-sharing schemes when implemented based on the variables’ average means. The directors could use the results to make informed decisions on the implementation of a profit-sharing scheme.
Descriptive Analysis
Descriptive analysis is a brief statistical analysis that summarizes the features of data in a data set. It provides the coefficients of various features of data to relay information to users. The most common coefficient of descriptive statistics includes calculating minimum, maximum values, standard deviation, interquartile, standard error, and the number of values in a given data set. The table below, Figure 6, provides a brief analysis of the data from the seven variables.
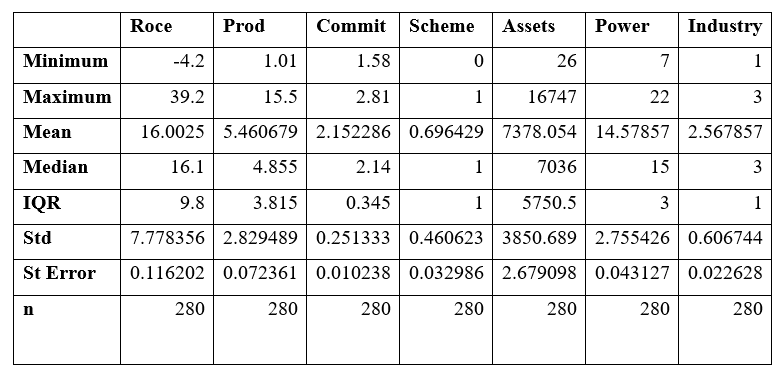
Fig 6: Descriptive Statistics of PK Mart.
To start with, Return on Capital Employed had the least number of minimum values in relation to the rest of the variables. The minimum and maximum rate of capital employed recorded is -4.2%, a deficit, and 39.2%, respectively. The variable recorded an interquartile deviation of 9.8 and a standard deviation of 7.778. Sedgwick (2017) indicates that the best standard deviation is a data set that records a lower value since it shows that data is more clustered to the mean hence making it more reliable. The standard deviation recorded by the variable is average, showing that not too much data were concentrated to the mean. This makes the data reliable for analysis. The standard error recorded is 0.116202, indicating that there is a minimal error in performing the analysis.
Secondly, the output per employee, also known as Productivity, recorded a minimum value of 1.01 and a maximum value of 15.5 in the data set. The mean recorded is 5.46, while the standard deviation is 2.82. This indicates that most values in the data set were quite widespread from the mean. Hence the data is not as reliable as it would have been if the standard deviation is quite high. The standard error recorded is 0.072, indicating that despite a higher wide spread of values, there is minimum error recorded in computing the descriptive statistics of the data. Thirdly, employees’ commitment in the data set recorded a mean rate of 2.155% with minimum and maximum rates of 1.58% and 2.81%, respectively. The data set of the variable is more clustered around the mean. The variable recorded a median rate of 2.14%, which is a value close to the mean. The standard error of the variable is 1.02%, which is the least standard error among other variables; hence computations were most reliable due to minimal errors. The number of employee commitment cases stood out to be equal to the other variables at 280.
Forth, the profit-sharing scheme at this point is considered as a dependent variable since the variable depends on other variables stated, that is, return on capital employed, Productivity, employee commitment, market power, and the book value asset. In this case, the least value recorded is 0, indicating no profit-sharing scheme, and the maximum value is 1 indicating the possibilities of a profit scheme. However, to consider reliability, the standard deviation is 0.4606 indicating a high value in relation to the mean and median provided. This shows that the values were reliable for computation. Fifth, the book value asset price recorded a minimum value of £ 26 Million and a maximum value of £ 16,747 Million. As per the statistics, the mean value is £ 7,378 million and a standard deviation of £ 3,850 million, which is high. Despite a negative skew in the box plot, the standard deviation indicates that the values were clustered towards the mean data, making it reliable for statistical analysis. The number of book value assets recorded is 280, which is constant concerning other variables. Lastly, the market power recorded an annual average of 14.58% of the minimum and maximum rates of 7% and 22%, respectively. The standard deviation is 2.755% which is low. Hence there is no effective reliability on the statistical analysis of the data as provided. The standard error recorded is low hence showing minimal errors made during analysis.
From the descriptive analysis provided, it is evident that the cases recorded were 2780 for all variables. Despite independence in the profit-sharing scheme and industry variables, the data provided is reliable since no negative reliability was recorded throughout the statistical analysis. This provides a basis for the kick-off for analysis. The annual measure of the size of the firm is £ 7,378 Million as per the analysis. This information is important for management to conclude whether or not to establish a profit-sharing scheme within the premises.
Bivariate Analysis
The bivariate analysis involves statistical analysis between two variables to develop an empirical relationship through correlation or simple linear regression. The two approaches are commonly used to test the hypothesis of an association between the variables. In this context, a bivariate analysis is conducted by determining correlation and computing chi-square statistics to determine the values related to each other in the data set.
1. Correlation Statistics
Correlation is an indicator of strength between two variables and determining the relationship between them. Beech (2016) suggests that correlation coefficients provide the degree to which a data sample is related to another and how strong the relationship is. The association provides conclusions on the dependency of the data. Using these statistics, the figure below shows the interrelationship between the variables taking the profit-sharing scheme as a dependent and constant variable.

Fig 7: Correlation Matrix of PK Mart Company.
From the general rule of thumb, a positive correlation, that is, the value is more than 0, indicates that the variables have a distinct relationship together. A negative correlation, the value is less than 0, indicates that the variables have no significant or distinct relationship. From Figure 7, the matrix has sets of values where one indicates that the variables strongly relate to each other. Normally, the value is obtained when the variables are the same. Novak (2017) indicates that the closer the values to 1, the stronger the relationship between the variables. When the values are close to 0, the relationship is weak between each other. Having the concept in mind, the variables, Productivity, return on capital employed, and employee commitment, recorded the highest correlation with each other.
First, return on capital employed had a positive correlation with Productivity set at 0.891, employee commitment at 0.612, and the book value asset, set at 0.147. However, there is no significant relationship between ROCE and Market power since the correlation obtained is negative, that is, -0.005. This concept shows that Return on Capital employed is related directly and strongly to employee commitment and Productivity. The book value asset showed a weak relationship since the value is close to 0, unlike the rest of the variables. Second, there is a strong relationship between Productivity and employee commitment with a positive correlation of 0.649. The relationship between productivity and book value asset indicated a weak relationship since the value is close to 0, 0.123892. From the figure, there is no relationship between Productivity and market power since the value recorded is negative.
The correlation matrix indicates that productivity increases when the return on capital employed, employee commitment, and the book value of asset increases. The correlation coefficient obtained between Return on Capital Employed and Employee commitment stands at 0.8911785, indicating an 89.12% increase in Productivity increasing ROCE. Employee commitment and Book value assets increase moderately with correlation coefficients of 0.649079 and 0.146616, respectively. PK Mart records a moderate growth rate of 64.91% and 14.66% on Productivity with an increase in commitment and book value asset, respectively.
2. Chi-square statistics
Chi-square analysis is a statistical metric used to measure the dependency of variables. The null hypothesis in this analysis describes that there is no relationship between the variables. The table below shows the independence between the profit-sharing scheme and the industry using the Chi-square test.
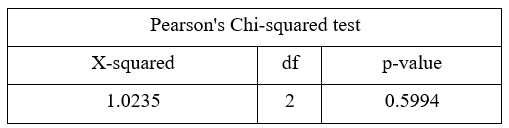
The statistics show that the p-value is greater than the value of α, which is 0.5994 > 0.05. From the rule of thumb, when the p-value is greater than the alpha value, we fail to reject the hypothesis. The null hypothesis represents the significant test conducted (“Hypothesis Testing – Chi-Squared Test,” n.d.). In this case, the null hypothesis is to analyze to test any significant relationship between the profit scheme and the type of industry. The statistical analysis shows that the null hypothesis is rejected since the p-value is greater than α. Hence it is concluded that there is no significant relationship between the two variables. This concept means that the type of industry does not relate to the profit-sharing scheme in PK Mart Company.
Multivariate Analysis
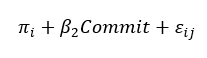
A multivariate analysis is a statistical metric used in analyzing data using more than two optics of measurements. An independent variable is analyzed simultaneously with other variables. The commonly used formulae for multivariate analysis is the logistic regression model. Goudy, Jiramongolchai & Chinnadurai (2016) defines logistic regression as a model of an outcome of non-linear variables in a linear association. Normally the regression technique is used when the dependent variable is binary. This approach is a predictive analysis used to explain the relationship between dependent and independent variables. The following equation relates to the logistic regression model used to determine linearity:
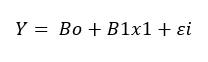
This is the general formula for regression analysis. However, in this case, the three variables are the profit-sharing scheme, the dependent variable, employee commitment, and Productivity, which are the independent variables. The standard errors are also used to generate the equation. Thus;
To obtain logit (p) as;
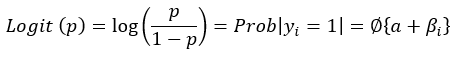
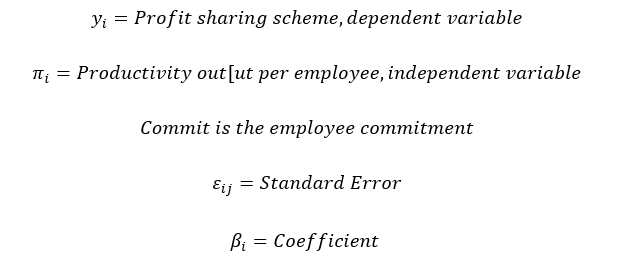
Where;
There are two hypothesis tests in regression analysis used to make conclusions; the first hypothesis is to test the significance of the profit-sharing scheme on Productivity. The null and test hypothesis will be;
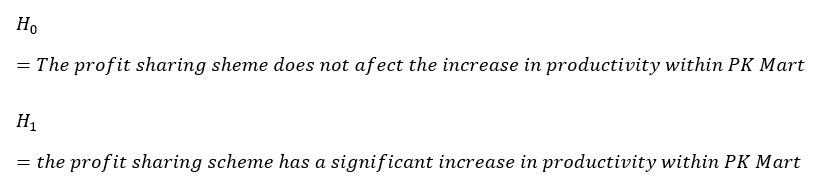
The second hypothesis test wishes to test the significance of the profit-sharing scheme on commitment within the industry. The null and test hypotheses are;

The table below shows the results of the regression analysis model and the likelihood of changes within Productivity and commitment within PK Mart.
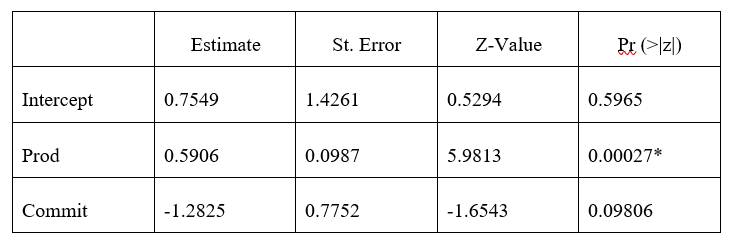
The table above presents the logistic regression output for the multivariate analysis. At a 95% level of significance, the P-value for the logistic regression models is zero for commitment but not zero for production. This means that the profit-sharing scheme influences the productivity output of employees in PK Mart. Thus the estimated coefficient (0.7549) in table 3 means that a unit change in profit sharing scheme results in 75% influence in Productivity. However, the commitment was statistically insignificant to scheme adoption. Thus the adoption of profit sharing scheme did not affect the commitment of employees based on PK Mart’s annual data.
Conclusions and Recommendation
Financial modeling is a broad concept that takes most businesses to a corporate world. With the prevention of prospected financial losses, risks, consistent results, and detailed organizational assessments, most industries adopt financial models to find new strategies to enhance performance. In this context, using a forecasted and budget model will assist the PK Mart board of directors in easily find out whether or not introducing a profit-sharing scheme is important. The graphs represented above through a box plot clearly show that the management might obtain positive results upon implementing the scheme. There might be increased Productivity, employee commitment, and high returns on capital employed. The scheme increases the return on capital employed by 16% and Productivity by 5.46%. The rates are considered good from the general rule of thumb. The correlation matrix, representing a bivariate analysis, indicates a positive correlation between Productivity and the return on capital employed upon implementation of the scheme. There are also significant increases in employee commitment despite a moderate positive relationship to the scheme. Lastly, the regression model fails to reject the null hypothesis of the two test statistics. There is a significant relationship between profit-sharing schemes and Productivity as well as the commitment of employees. PK Mart should adopt the concept and implement the profit-sharing scheme.
Outside the statistical analysis, profit sharing assist workers in working beyond their capabilities and achieving higher results. The concept is a motivation factor that assists employees to increase their engagement activities hence maximizing Productivity. In contrast to revenue sharing options like commissions and bonuses, profit sharing is tied to employee goals reflected in pay plans. Profit distribution Most of the time, a single rule applies to all profit-sharing plans. Some businesses have revenue-sharing plans that pay employees based on how well they perform in specific divisions. Obtaining results will be impossible unless there is a clearly defined profit-sharing structure that everyone knows. Consider how the company’s earnings will be affected after receiving the shares and what elements will be changed. This can have an effect on both taxes paid and money saved for future investments. The profit-sharing plan should state the final goal after employees grow more motivated and take on extra tasks.
References
Beech, D. (2016). Experiences of Correlation Analysis. Applied Statistics, 2(2), 73. doi: 10.2307/2985726
Goudy, S., Jiramongolchai, P., & Chinnadurai, S. (2016). Logistic regression analysis of Pierre Robin sequence patients requiring surgical intervention. The Laryngoscope, 127(4), 945-949. doi: 10.1002/lary.26143
Hypothesis Testing – Chi Squared Test. Retrieved 28 September 2021, from https://sphweb.bumc.bu.edu/otlt/MPH-Modules/BS/BS704_HypothesisTesting-ChiSquare/BS704_HypothesisTesting-ChiSquare_print.html
Novak, S. (2017). On Gebelein’s correlation coefficient. Statistics & Probability Letters, 69(3), 299-303. doi: 10.1016/j.spl.2004.06.026
Obed, A., & Goralczyk, A. (2020). Non-uniform Box Plot. Deutsches Aerzteblatt Online. doi: 10.3238/arztebl.2010.0122a
Sedgwick, P. (2017). Standard deviation versus standard error. BMJ, 343(dec13 3), d8010-d8010. doi: 10.1136/bmj.d8010
Wegman, E. (2018). Special issue of statistical analysis and data mining. Statistical Analysis And Data Mining: The ASA Data Science Journal, 5(3), 177-177. doi: 10.1002/sam.11151