Essay on Business Performance
Number of words: 1530
Analyzes of financial data using a variety of financial tools
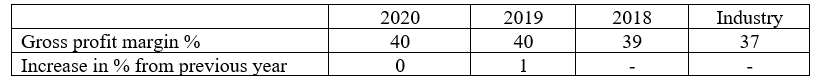
Gross Profit Margin Ratio = Gross profit Margin shows the percentage of gross profit to the net income or sales. Gross profit is calculated by deducting cost of goods sold from sales. If a company’s gross profit margin is increasing, then it is a good sign. A high gross profit ratio indicates it has more left over after deducting the cost of goods sold or cost-efficiently manufacturing its products. The company’s gross profit margin is showing a positive result, and the margin is small more than better industry average.
Formula = (Net revenue – direct expenses)/Net revenue *100
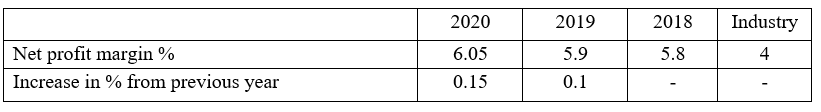
Net profit margin % = It refers to the company’s ability to produce profits from its revenue. When a company’s net margin exceeds the standard for its industry, it has a competitive advantage, meaning it is more successful than other companies with related operations. (Investopedia, n.d.). The company ratio has been continuously increasing form past years which is suitable for it.
Formula = Net income/ Sales or revenue
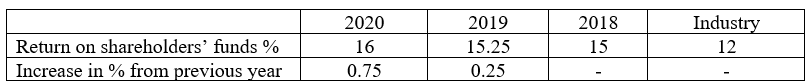
Return on shareholders’ funds = The return on shareholders’ funds compares the amount of profit for the period available to the shareholders’ stake in the company. (Chapman, 2011, p.p 567–571). The higher the percentage it means more money is paid to shareholders. The business has more return on shareholder funds than its industry and has increasing trend from its previous year also. So the results are satisfactory.
Formula = Earnings after tax/ shareholders’ equity *100
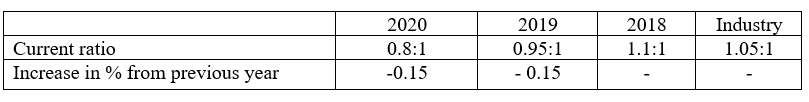
Current ratio – Current ratio shows the amount of current assets in comparison with current liabilities. The exact good ratio depends on business nature, and businesses should keep this ratio higher than one at all time. The ratio of the entity given is declining from last year and it is now in 2020 is 0.8:1 which is not good. Management needs to take all the steps to increase it to industry average.
Formula = Current assets / current liabilities
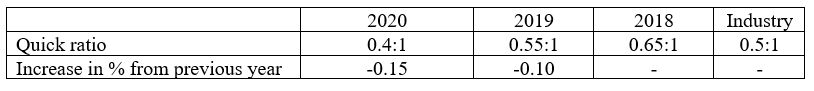
Quick ratio – It is the indicator of the ability of the company to pay its short-term liabilities out of its current assets after deducting stock (Warrad, 2014, pp.9). It shows the capacity of a company to pay its short obligation out of its more liquid assets. Therefore it is called liquid ratio. The company’s quick ratio is also declining due to its fewer current assets after its stock and more current liability. In 2020 it is far below industry standards.
Formula = (Current Assets – Inventory)/ Current Liability
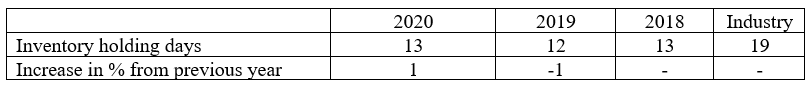
Inventory holding days – It represents the liquidity position of inventory, which means it shows how many days a business’s current stock of inventory will last. (Hayes, 2019). A lower ratio is preferred because it will take fewer days to clear the inventory but varies from industry to industry. Average inventory means opening and closing inventory divide by two. Difference from industry is major nut it is good, as it takes less days to clear the inventory and holding for a short period. Inventory turnover ratio shows whether a business is effectively managing its stock of goods.
Inventory Turnover = Cost of goods sold / Average inventory
Inventory Days = 365*Avg turnover/ Cost of goods sold
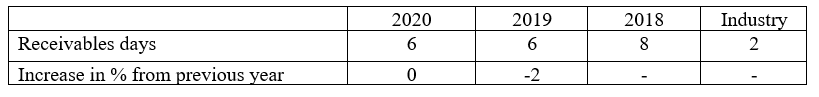
Receivables days – Shows how much time it will take to clear the debtors or receivables. It is the amount receivable in proportion to sales in terms of days. We should optimize our debtors if it is taking enough time to realize debtors. In 2019 the ratio has improved a little by two days. Yet the industry ratio is meager, and it needs to improve a lot to collect payment on time to decrease ratio.
Formula = (Account Receivable / Revenue) x 365
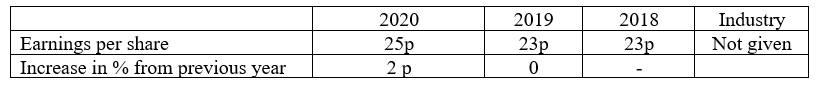
Earnings per share – It is an essential financial tool that shows the profit after tax at last available for distribution to shareholders. Once a company starts earning handsome sums, the equity share will have more and more demand, increasing the market value of the equity ( Bhatt & Sumangala, 2012). It is calculated by dividing the company’s net profit by the number of shares outstanding. It is the portion of net profit allocated to one share. There is slight increase in EPS in 2020 as compared with previous year. Although industry data is not given but EPS is very low. It may be due to a high number of outstanding shares.
Formula = Net Income after Tax/Total Number of Outstanding Shares
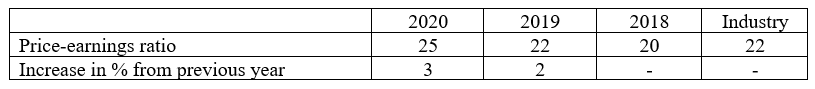
Price-earnings ratio – PE ratio refers to the price-earnings ratio that investors use to analyze the value of a company, which means how much it needs to spend to earn one. It shows whether a share is underpriced or overpriced. A high PE ratio means the share is expensive because of high market price or low earning. The earnings per share are increasing year by year and in 2020 it is three more than industry. So the ratio is satisfactory.
Formula = Market price / Earnings per Share ( EPS)
Dividend Yield % – Dividend ratio is a ratio which shows the amount of dividend per share on market price per share. It indicates how much the entity is returning to shareholders in the form of dividend concerning its current price in the market if the share is sold at present. High dividend yields are good for shareholders, but they may be a risk to company growth. So suitable dividend policy needs to be adopted, which is flexible and matches with industry averages.
Formula = Annual Dividend per Share/ Current Market Price

Evaluation and Final result of various ratio
- Profitability Ratio – Gross profit ratio is good and showing increasing trend, Net profit ratio is also excellent indicating increasing trend from past years. Return on shareholders’ fund is also fine as compared with industry and also increasing.
- Liquidity Ratio – Current ratio needs to be improved as it is declining and less than the industry ratio. Quick ratio is also less than industry ratio and from past year, Care need to be taken to improve this.
- Working capital management – The inventory turnover ratio or inventory holding is less than industry means it is taking less time to realize inventory which is good. On the other hand, receivable days are more than industry it means it needs to focus more on Receivable management.
- Stock market performance (Investment Ratios) – EPS ratio is meager, although it varies from industry to industry it should be near 5. The Price-earnings ratio is also than industry it means than share is more expensive than industry measures. Dividend ratio matches with industry standard.
Few methods to measure business performance
- By analyzing whole financial statements.
- Customer satisfaction can be measured.
- Market goodwill
- Quality of goods and services
- New customers base
Conclusion
We will invest in the company if the share price is average in the industry. But the other ratio is quite good than industry. So we will invest in the company as profit increases, but some risk is also present, like low current and quick ratios.
Referencing
Hayes, A. (2019). Why You Should Use Days Sales Of Inventory – DSI. [online] Investopedia. Available athttps://www.investopedia.com/terms/d/days-sales-inventory-dsi.asp [Accessed 28 Sep. 2021].
Investopedia. (n.d.). How to Calculate Net Profit Margin. [online] Available at: https://www.investopedia.com/terms/n/net_margin.asp[Accessed 28 Sep. 2021].
Robert J. Chapman (2011), Financial Ratios, Simple Tools and Techniques for Enterprise Risk Management, https://onlinelibrary.wiley.com/doi/pdf/10.1002/9781118467206.app5
Warrant, L., 2014. The impact of liquidity through quick ratio on share price: evidence from Jordanian banks. European Journal of Accounting Auditing and Finance Research.
Pushpa Bhatt, P. and Sumangala, J.K., 2012. Impact of Earnings per share on Market Value of an equity share: An Empirical Study in Indian Capital Market. Journal of Finance, Accounting & Management, 3(2).