An analysis of risk on investing $10m in high grade corporate bonds
Set-up
As a portfolio manager at Goldman Sachs Fixed Income, Currencies and Commodities (FICC) division, I was given 10 million USD to invest in a mix of high grade corporate bonds and Treasury securities.
The following bonds have been chosen with careful analysis of markets and past performance of these particular securities. The choice also embodies some desire to differentiate between markets and expose oneself to different rated senior bonds. This does not imply, however, that the bonds are totally uncorrelated. Although the purpose of this assessment is not to calculate the credit risk of the bonds, it was assumed that diversification between markets would result in lower correlation (rho). The intuition behind this assumption is plausible.
- Microsoft Corporation – Software producer
- Boeing Co – Airline manufacturer
- JP Morgan Chase & Co – Commercial and Investment Banking
- Coca Cola Enterprises Inc – Soft-drinks and beverage producer
- US T-bond 8.500% – Treasury security
Portfolio Description
To summarise, high rated bonds: one treasury, one triple – A, one double – A and two single – A were chosen with maturities longer than our investment horizon – 3 years.
| Overview | Microsoft | Boeing | JP Morgan | Coca Cola | US T-bond |
| Price: | 110.3 | 109.63 | 100.7 | 113.41 | 147.33 |
| Coupon (%): | 4.2 | 3.75 | 2.6 | 4.5 | 8.5 |
| Maturity Date: | 1 Jun 19 | 20 Nov 16 | 15 Jan 16 | 15 Aug 19 | 15 Feb 20 |
| Issue Date: | 1 Jun 09 | 20 Nov 09 | 15 Jan 11 | 15 Aug 09 | 15 Feb 90 |
| Yield to Maturity (%): | 2.82 | 2.02 | 2.45 | 2.75 | 2.66 |
| Current Yield (%): | 3.81 | 3.42 | 2.58 | 3.97 | 5.77 |
| Fitch Ratings: | AAA | A | AA | A | AAA |
| Coupon Frequency: | Semi-Annual | Semi-Annual | Semi-Annual | Semi-Annual | Semi-Annual |
| First Coupon Date: | 1 Dec 09 | 20 May 10 | 15 Jul 11 | 15 Feb 10 | 15 Aug 90 |
| Type: | Corporate | Corporate | Corporate | Corporate | Treasury |
| Callable: | No | No | No | No | No |
| Minimum Trade Qty: | 5 | 10 | 1 | 5 | 1 |
Source: Yahoo Finance / Bonds (Date: 1 Dec 2010)
Although data is widely available on the basic overview through the Wall Street Journal or the Financial Times about the corporate and treasury securities, more detailed information for sophisticated users regarding bond covenants and indentures required extra effort in obtaining. Hence, we had to refer to Moody’s Industrial Manual, now renamed the Mergent Fixed Income Securities Database via Wharton Business School Research Database. We can summarise debt covenant information in the table below:
| Covenants | Microsoft | Boeing | JP Morgan | Coca Cola | US T-bond |
| Security | Senior | Senior | Senior | Senior | Senior |
| Global offered | Yes | Yes | Yes | No | Yes |
| Redeemable | No | No | No | Yes | No |
| Fungible | Yes | Yes | Yes | Yes | Yes |
| DEFEASANCE_WO_TAX_CONSEQ | Yes | No | No | No | No |
| Consolidation Merger | No | No | No | Yes | No |
| SALES_LEASEBACK_IS | No | No | Yes | Yes | No |
| SALE_ASSETS | No | No | Yes | Yes | No |
In a nutshell, Coca Cola’s bond seems to have a number of covenants, one of them being redeemable – that is it can be redeemed whenever there is a need. All bonds are fungible, meaning that they are interchangeable, equivalent and substitutable.
Another interesting covenant is with Microsoft. It gives Microsoft the right to defease the monetary portion of the security without tax consequences to bondholders. Coca Cola has another important covenant restricting consolidation mergers with another party.
Sales leaseback restricts Coca Cola and JP Morgan to the type and amount of property used in the leaseback.
Analysis of Risks for individual bonds and portfolio
We can summarise the extent of the impact of various risk on individual bonds as well as our portfolio in the table below.
| Types of Risk | Microsoft | Boeing | JP Morgan | Coca Cola | US T-Bond | Portfolio |
| Interest Rate Risk | High | High | High | High | Low | High |
| Reinvestment Risk | Moderate | Moderate | Moderate | Moderate | High | Moderate |
| Credit Risk | Very Low | Low | Low | Low | Zero | Low |
| Inflation Risk | Low | Low | Low | Low | Low | Low |
| Liquidity Risk | Low | Low | Low | Low | Minimum | Low |
| Other Risk | Low | Low | Low | Low | Low | Low |
Interest Rate Risk
This risk is considered to be high on any fixed income security that is not hedged. Typically, when there is increase in the interest rates, the price of bonds shall fall. As we have limited horizon, fall in the prices entail capital losses if we short our position after three years. We shall discuss further in this paper how sensitive our chosen bonds are to changes in interest rates using different interest rate risk measures. One important thing to note is that in times of excessive increases in interest rates, which happens during economic downturns, investors usually opt for safe-haven securities, like US Treasury bonds, driving the demand for this security and skyrocketing its price and lowering its YTM.
Reinvestment Risk
In contrast to the interest rate risk, reinvestment risk implies that interests from bonds may not be reinvested in the same rate of return as the bond itself. This usually happens when interest rates fall making it less profitable to invest at lower rates. This risk is particularly high for longer-term bonds.
We can see it in the case of US T-Bonds. Being 10 years to maturity and paying the highest coupon rate among the five, they can be more vulnerable to reinvestment risk if interest rates fall in the future. It should be mentioned that Interest Rate Risk and Reinvestment Risk have counter effects, offsetting each other to a certain extent.
Credit Risk
 Credit risk is an important source of risk for fixed income securities, as it can be classified not only as traditional risk of default but also into credit spread risk and downgrade risk. In general, default risk occurs when the issuer (corporation or government) fails to meet its obligation of timely payment of the coupon interest due to the financial difficulty it faces. Our portfolio has highly rated bonds, with AAA rated Microsoft and safe-harbor US Treasury traditionally “assumed” to have zero default risk.
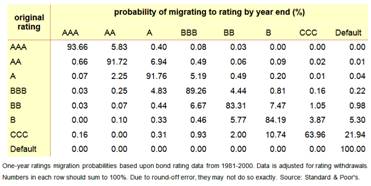
Regarding the downgrading risk, usually, if you look at the ratings matrix prepared by Standard’s and Poors or Fitch, you can see that there is very low probability for such bonds to go into default. If you take A-rated Coca Cola, according to below graph it has 0.04% probability of going into default. But pooled together with other safer bonds, by diversifying our idiosyncratic risk the probability of our portfolio defaulting would go very close to zero. This, as explained above, does not necessarily mean that our portfolio default risk is close to zero. This would be the case when individual bonds were totally uncorrelated, which can be plausible in boom periods. However, in bad times, this does not always hold. The recent financial crisis has shown that even triple A-rated companies can go bust, AIG being an example. Moreover, the current sovereign debt crisis in the euro zone is proving that governments are also not safe, Greece, Ireland, Portugal, Belgium being few examples.
Coming back to our bonds and portfolio, ours seems to be quite stable, since Microsoft (AAA-rated) is not involved in silly things as AIG were, such as overleveraging themselves with toxic waste CDOs and other insurance contracts. In contrast, Microsoft prefers to sit on cash (cash is often termed as negative debt) neither paying dividends to shareholders nor lever-up by buying back the securities. One of our least rated companies is Boeing. Boeing, an aerospace and defense company, was rated in the top five best yielding stock in 2010 by Dow Jones with very high profit figures and good cash flows (Lynch / The Street, 2010).
Overall, the credit risk of individual bonds is low based on their ratings, and assuming that we shall not be in financial crisis for next three years we can assume that correlation between our bonds will be low partly due to them being from different industries. Hence, this makes our overall portfolio less vulnerable to default risk.
Inflation Risk
Inflation risk can also affect our investment decision, as none of the bonds chosen are inflation-indexed. One can argue that inflation was especially important during 60s and 70s when it was at a high rate, but now they are very low, especially in the aftermath of the recent economic downturn. Indeed, this can be true, , considering how the US is boosting its economy by pumping in billions of dollars is likely to drive the inflation rates up and disturb investors with inflation risk. The Federal Reserve initiated its plans of injecting 600 billion USD in November and is still committed to it (Lanman/ Bloomberg, 2010).
Liquidity Risk
Liquidity risk entails inability or difficulty of selling or finding buying counterparties without excessive reduction in prices of the bond or widened bid-ask spread. This has recently been a crucial phenomenon in the markets during the financial crisis as banks and financial institutions had severe liquidity problems. An example can be seen with the UK bank Northern Rock, which became the first bankruptcy in the UK banking sector for 100 years (The Economist, 2007). If we are to hold the bonds until maturity we were not to bother about the liquidity problems.
As for our portfolio of bonds, let’s take the least rated one – Coca Cola. The Coca Cola Enterprises bonds have always been demanded by investors due to its smooth cash flows and diversified worldwide operations. In 2010, Coca Cola sold their bonds with record low coupon rates (Bullock and Mackenzie/ FT, 2010), indicating that liquidity risk is minimum for our chosen company.
Other Risk
There are some other risks that may affect our portfolio, like volatility risk, call risk and risk risk. The impact of all these risks is going to be very small compared to other risks as our bonds do not have embedded options, they are not callable and they are plain vanilla products (not sophisticated instruments that might entail modeling or other unknown risks).
Bond Analytics for individual bonds and portfolio
We have performed some analytical calculations of important measures of bond price volatility, namely:
- Price Value of a Basis Point
- Macaulay Duration
- Modified duration
- Convexity
- Approximate duration and Approximate convexity
Before we start explaining our results, we would like to emphasise in what quantity we purchased each specific bond. In other words, how did we determine the weights? Rather than assuming equal weights of 20% each, we decided to go the extra mile and determine pseudo-optimum portfolio weights1. We tried to identify what are the best responses to (maximum returns from) different scenarios and tried to choose such weights that produce responses that are closest to maximum responses. The graph shown below can help to visualise our weights choice. Intuition here is that Maximum Return can be assumed as Production Possibility Frontier; whereas, Optimum Return is such combination of weights that give closest results to PPF subject to the following constraints:
- Sum of weights should equal 1
- Total value of portfolio cannot exceed 10,000,000
- Minimum trading quantities of each bonds
Our analysis can be summarised in the following table for individual bonds. Full calculations are available in the Appendix.
| Bonds | Price | Coupon | Periods to Maturity | YTM | PVBP | Macaulay | Modified | Convexity | Appx. Dur. | Appx. Convx. |
| Microsoft | 110.30 | 4.20 | 17 | 2.82% | -0.08 | 7.31 | 7.11 | 60.62 | 7.18 | 60.21 |
| Boeing | 109.63 | 3.75 | 12 | 2.02% | -0.06 | 5.46 | 5.36 | 33.68 | 5.36 | 33.12 |
| JP Morgan | 100.70 | 2.60 | 11 | 2.45% | -0.05 | 4.72 | 4.61 | 24.86 | 4.72 | 25.39 |
| Coca Cola | 113.41 | 4.50 | 18 | 2.75% | -0.08 | 7.64 | 7.44 | 66.48 | 7.28 | 62.24 |
| US T-bond | 147.33 | 8.50 | 19 | 2.66% | -0.10 | 7.33 | 7.14 | 64.31 | 6.98 | 60.27 |
| Portfolio | 10,000,000 | 19 | 1.33% | -12904 | 6.40 | 6.32 | 48.29 | 12.91 | 199.50 |
Price Value Basis Point
PVBP is the changes in the price of the bond if required yield changes by one basis point. It needs to be noted, however, that this measure of price volatility implies dollar price volatility. As it can be seen, one basis point (0.01%) increase in yield to maturity results in 8 per cent decrease in the price of the Microsoft Bond. Similarly, one basis point increase in YTM of the portfolio of bonds results in a $12,904 decrease in the value of our portfolio. In percentage terms it can be translated to following:
- Microsoft: 8 cent decrease = 0.0725% decrease in price
- Portfolio: 12,904 dollar decrease = 0.01% decrease in value of portfolio
This implies that our portfolio is less sensitive to small changes in interest rates as compared to the individual Microsoft bond.
Duration
We also measured so-called Macaulay and Modified durations of bonds, which are also useful in determining the interest rate sensitivity of bond prices. Duration approximately equals the percentage change in price for a given change in yield. For example, for small interest rate changes, the duration is the approximate percentage by which the price of the bond will drop for a 1% per annum increase in the interest rate. So a Microsoft bond with a duration of 7.3 would fall approximately 7.25% in value if the interest rate increased by 1% per annum.
Portfolio duration is calculated as the weighted average duration of individual bonds.
Convexity
Although duration is a good approximation of price sensitivity for small changes in interest rates, larger swings in interest rates need to be explained by another measure called convexity. The problem with duration is that it assumes that price changes linear manner, but in reality they change in convex function of interest rates.
Investors highly favour the convexity measure as it gives some insights into the sensitiveness of bonds with respect to change in yields. That is, the more convex is the bond, the more it shall gain from interest rate falls and the less it shall lose from interest rate hikes.
This “resistance to downside and openness to upside” characteristic of highly convex bonds also explains why bonds like Microsoft, JP Morgan and Coca Cola have hte biggest weights in our portfolio.
Approximate Duration and Convexity measures.
We also computed approximate Duration and Convexity measures of bonds, which indeed yielded similar results as actual duration and convexity.
Analysis of Price Sensitivity
| Microsoft | Boeing | JP Morgan | Coca Cola | US T-bond | Portfolio | |||||||
| Change in BP | New Yield | %Price Change | New Yield | %Price Change | New Yield | %Price Change | New Yield | %Price Change | New Yield | %Price Change | New Yield | %Price Change |
| 200 | 0.82% | 15.74% | 0.02% | 11.60% | 0.45% | 10.88% | 0.75% | 16.87% | 0.66% | 16.81% | -0.67% | 30.32% |
| 100 | 1.82% | 7.55% | 1.02% | 5.66% | 1.45% | 5.31% | 1.75% | 8.26% | 1.66% | 8.53% | 0.33% | 13.97% |
| 10 | 2.72% | 0.75% | 1.92% | 0.62% | 2.35% | 0.57% | 2.65% | 1.14% | 2.56% | 1.69% | 1.23% | 1.30% |
| -10 | 2.92% | -0.69% | 2.12% | -0.46% | 2.55% | -0.45% | 2.85% | -0.37% | 2.76% | 0.24% | 1.43% | -1.28% |
| -100 | 3.82% | -6.88% | 3.02% | -5.17% | 3.45% | -4.90% | 3.75% | -6.83% | 3.66% | -5.96% | 2.33% | -11.97% |
| -200 | 4.82% | -13.25% | 4.02% | -10.10% | 4.45% | -9.58% | 4.75% | -13.44% | 4.66% | -12.30% | 3.33% | -22.26% |
When observing the price sensitivity of change in the interest rates, we once again proved four basic properties mentioned in (Fabozzi, 2009).
Property 1: Although bond price moves in the opposite direction from change in the yield, the percentage price change is not always the same.
Property 2: For very small changes in interest rates, percentage price change is approximately the same regardless of direction
Property 3: For large changes in interest rates, percentage price change is not the same regardless of direction
Property 4: For large changes in the interest rate, percentage price increase is larger than percentage price fall
The calculation of price sensitivity analysis for the portfolio of bonds required computation of yield to maturity, which was calculated for a total of 19 payment periods by aggregating all coupon payments and par value payments, with the important assumption that the coupon payment date is the same for all five bonds. The high sensitivity of the portfolio to changes in yields is due the fact that some lump-sum par value payments occur much earlier than maturity (ie. JP Morgan).
Total Dollar Return and Total Return
Finally, we looked at the returns from a different perspective other than yield to maturity in different scenarios with a limited investment horizon.
| US Treasury | YTM |
| 6 Month | 0.17% |
| 1 Year | 0.35% |
| 1.5 Year | 0.50% |
| 2 Year | 0.61% |
| 2.5 Year | 0.75% |
| 3 Year | 0.91% |
| Yahoo Finance |
First we computed individual bond performance. To do so, we needed to identify how much we could sell the bonds for after the three-year period. With six different scenarios we tried to predict capital gains from selling the bonds and the future value of the coupon payments invested at prevailing market interest rates that were assumed constant over three years. In short, we calculated Dollar Return as the sum of capital gains from selling the bond after three years + coupon receipts for three years + interest on coupon interest. When calculating interest on interest, we had to assume a certain rate of interest. However, what we used is different US government securities of different maturities as proxy.
Afterwards, we calculated total return as dollar return over current prices in the root of 1/6 and minus one to get a semi-annual return. We multiplied it by two to get total annual return.
| Bonds | Yield | YTM + 10 BP | YTM – 10 BP | YTM – 100 BP | YTM + 100 BP | YTM – 200 BP | YTM + 200 BP | ||||||
| Dollar Return | Total Return | Dollar Return | Total Return | Dollar Return | Total Return | Dollar Return | Total Return | Dollar Return | Total Return | Dollar Return | Total Return | ||
| Microsoft | 35% | 119.19 | 2.60% | 120.23 | 2.90% | 125.09 | 4.24% | 114.62 | 1.29% | 130.8 | 5.76% | 109.81 | -0.15% |
| Boeing | 11% | 116.04 | 1.90% | 116.62 | 2.07% | 119.31 | 2.84% | 113.45 | 1.14% | 122.39 | 3.70% | 110.66 | 0.31% |
| JP Morgan | 30% | 108.01 | 2.35% | 108.41 | 2.47% | 110.23 | 3.04% | 106.23 | 1.79% | 112.31 | 3.67% | 104.31 | 1.18% |
| Coca Cola | 22% | 122.28 | 2.53% | 123.38 | 2.83% | 128.49 | 4.21% | 117.49 | 1.18% | 134.5 | 5.77% | 112.45 | -0.28% |
| US T-bond | 2% | 158.31 | 2.41% | 159.66 | 2.70% | 165.93 | 4.00% | 152.45 | 1.14% | 173.32 | 5.49% | 146.31 | -0.23% |
| Portfolio | 100% | 10,750,917 | 2.43% | 10,825,083 | 2.66% | 11,168,303 | 3.71% | 10,426,277 | 1.40% | 11,568,627 | 4.90% | 10,082,333 | 0.27% |
For computing portfolio dollar return, each bond return was multiplied by the number of bonds we have purchased (based on the weights we have obtained using excel solver function – See Appendix). Total return was weighted average of individual total returns. As it can be seen, due to proper approximation of weights of the portfolio, in six states of the world (including a sharp surge in the interest rates by 200 basis points) we were able to end up in positive total returns for the portfolio (0.27%).
Conclusions
In conclusion, we have successfully invested 10,000,000 USD of Goldman Sachs’ money in a highly diversified and high rated bond portfolio. By keeping other events constant, we first found out best response strategies for six states of the world and replicated it with unique portfolio weights that were second best (pseudo-optimal strategies) for all six states of the world given certain constraints mentioned above.
We also tried to analyse the sensitivity of the price of bonds and the value of portfolio to changes in the interest rates by various measures like PVBP, Macaulay and Modified Duration, Convexity, etc. Convexity measure of the interest rate risk, once again proved that the right mix and quantity of weights was chosen.
References:
Bloomberg.com (2010), Federal Reserve to Buy additional 600 Billions of securities to aid growth, [Online],
Available from: http://www.bloomberg.com/news/2010-11-03/federal-reserve-to-buy-additional-600-billion-of-securities-to-aid-growth.html
Bodie, Marcus, Kane (2001) Investments, McGrawHill (5th edition)
Economist, (2007), Run on Northern Rock, [Online], Available from:
http://www.economist.com/node/9832838?story_id=9832838
Fabozzi, F (2009) Bond Markets, Analysis, and Strategies (5th Edition)
FT (2010), Corporate Bond Sales rise at year-end, [Online],
Available from: http://www.ft.com/cms/s/0/a7b9e3a4-016f-11e0-9b29-00144feab49a.html?ftcamp=rss#axzz17ZqSBjSm
Lynch/ The Street, (2010), 5 best Dow dividend stocks of 2010, [Online],
Available from: <http://articles.moneycentral.msn.com/Investing/FindHotStocks/article.aspx?post=3311709f-43ea-4c0a-8703-61d2d0bd6a4e&_nwpt=1>
Wharton Database (2010) Online Available From:
http://wrds-web.wharton.upenn.edu/wrds/support/Data/_001Manuals%20and%20Overviews/_080Mergent%20FISD/index.cfm
Yahoo Finance / Bonds (Date: 1 Dec 2010) Bond Selector [Online] < http://finance.yahoo.com/bonds> Last accessed: 5 Dec 2010
1By pseudo-optimum we mean that there was no attempt to value the portfolio using ratings based / fundamentals based / reduced form modeling, rather we used MS Excel Solver and Goal Seek functions to iterate the results.