Low Carbon Footprint
Introduction
A carbon footprint is the overall amount of carbon dioxide (CO2) and other greenhouse gas (GHG) emissions associated with a process or product. This entails, where possible, full life cycle analysis, for example extraction of materials, process of production, transport to site, and possibly in-use and disposal. Across these areas emissions usually result from electricity production in power plants, heating with fossil fuels, vehicle exhaust, as well as other industrial and agricultural processes. (EC, 2007)
The role of carbon footprinting is set to increase dramatically as we push towards the 80% reduction of CO2 emissions set out by UK government. It will not be long until widespread use is seen across all industries and business sectors, with those taking the initiative seeing benefits to themselves, as well as the environment. Companies seen to be conscious over their carbon emissions and seen to be reducing them will be viewed in a better light by consumers. Not to mention other financial benefits resulting from reducing energy demand, and government incentives for example. (CT, 2011)
Aims
This report will focus on the construction of buildings, illustrating the effect of different materials on carbon footprints. The purpose of the piece of work is to show how simple choices with regard to how the building is constructed can create major differences in the amount of CO2 emissions. In the UK there is a tendency for houses to be built using brick. The production of brick requires high temperatures, usually from non-renewable fossil fuels such as coal, oil, or gas. Therefore, there is likely to be large amounts of GHG emitted from these processes, as well as using up finite resources. (Berge, 2009) The extent of this impact will be evaluated in this report using carbon footprints, whilst also assessing the performance of timber cladding as a potential alternative. To do this, a hypothetical site in Cardiff will be used to calculate the carbon footprints for both materials, being used as the external leaf of the façade of a domestic building. For comparison purposes, it will be assumed that the wall structure in each case, apart from the external leaf, is the same. The building itself will be a perfect square with each walls dimensions being 15m by 15m. It is only necessary to calculate the footprint of one of these walls, as the remainder will be the same.
Materials
As mentioned earlier the majority of the wall structure will be the same in each example, it is only the external layer that will change. Figures 1 and 2 illustrate two wall constructions, one with brick and one with timber. These diagrams demonstrate the only major difference between the two is the external layer. It is understood that the other components like insulation, battens, and plaster will have a large impact on the carbon footprint of the wall total depending on, for example choice of materials and location of source. However, the purpose of this study is to compare only the impact of brick and timber, therefore the other components will not be considered in the calculations.
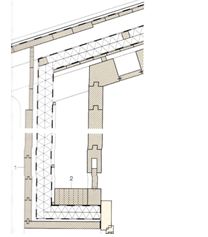
Figure 1 – Timber Construction (Herzog et al, 2004)
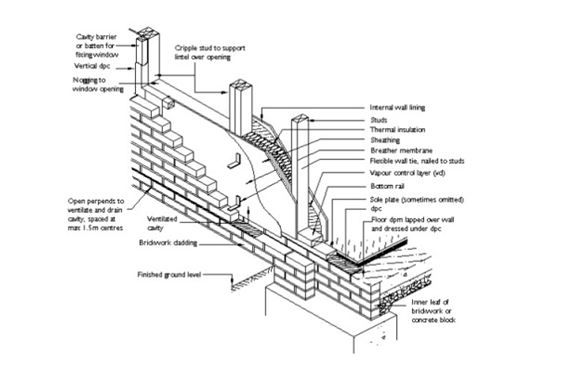
Figure 2 – Brick Construction (BATTG, 1996)
The first step is to calculate the amount of each material needed for the construction of one 15m by 15m wall. Information gathered from the Carbon Calculator (CCC), by the Environment Agency, says that there is 2.4 tonnes per 1000 bricks. Therefore, in order to calculate the mass of brick needed for the wall the approximate number of bricks is required. To do this the dimension of the wall will be divided by the dimension of the brick, as illustrated in the following section.
Construction 1
Bricks
15 / 0.220m = 68.2 bricks
15 / 0.075m = 200 bricks
69 * 200 = 13,800 bricks
Mass = 13.800 * 2.4 = 33.12 tonnes (2.4 tonnes per 1000)
Plus 10% Waste = 36.432 tonnes
Distance – Cradle to Site
The amount of mortar needed to secure the bricks together also needs to be calculated. The dimension of the type of brick used in this situation is 210mm by 70mm by 110mm. Whilst working out the number of bricks, the mortar was added to the size of the brick so that it could also be calculated.
Mortar
Volume of Wall = 15m * 15m * 0.11m = 24.75m3
Volume of Bricks = 13,800 * 0.21m * 0.07m * 0.11m = 22.315m3
Mortar Volume = Wall Volume – Brick Volume
= 24.75 – 22.315 = 2.435m3
Mass = Volume * Density
= 2.435m3 * 2.2 tonnes/m3 (CCC) = 5.357 tonnes
Plus 10% Waste = 5.8927 tonnes
Distance – Hanson Cement, Bedford (294 km)
Construction 2
Timber Cladding
A thickness for the cladding has been assumed as 50mm. Therefore, the volume of timber required can be calculated as follows;
Volume = 15m * 15m * 0.050m =11.25m3
Mass = Volume * Density
= 11.25m3 * 0.5 tonnes/m3 (CCC) = 5.625 tonnes
Plus 10% Waste = 6.188 tonnes
Distance – Wentwood Timber, Gwent (40km)
Steel Nails
It has been assumed that around 30 nails will be used per metre square. 16d nails come in 1lb boxes containing approximately 50 nails. (Lowes, 2011) Using this information, an estimation of the mass of steel to be used will be calculated.
15m * 15m = 225m2
225m2 * 30 nails = 6750 nails
Plus 10% Waste = 7425 nails
7425 / 50 = 148.5lb (50nails = 1lb)
1lb = 0.45kg
Mass of Nails = 149 * 0.45 = 67.05kg
Distance – MIR Steel, Gwent (24km)
Carbon Footprint
The Carbon Calculator produced by the Environment Agency will be used to calculate the carbon footprints of the materials. The calculator uses an emission factor to give an indication of the amount of carbon dioxide emitted over the production and delivery of the material. These emission factors are based on information gathered for the embodied energy of the material. The term ‘embodied energy’ refers to the amount of energy used in the extraction of materials and production of the product. This information can be gathered from sources such as the Inventory of Carbon and Energy (ICE), produced at the University of Bath. A conversion factor is then used to obtain the amount of CO2 this would produce. This conversion factor depends on the type of energy input. This process will be illustrated using brick as an example, before the results from the carbon calculator are presented. In this case the end result is likely to be different to the calculator results due to differing conversion factors, as well ICE data referring to cradle to gate and CCC to cradle to site.
Mass of Brick = 36.432 tonnes (36,432kg)
Embodied Energy of Brick = 3MJ/KG (ICE, 2011)
3MJ/KG * 36,432 = 109,296MJ
1kwh = 3.6MJ = 109,296MJ / 3.6 = 30,360kwh
Conversion Factor (Coal) = 0.32kg/co2/kwh (DEFRA, 2010)
30,360kwh * 0.32 = 9,715kg2CO2
The emission factor can be obtained from this figure and then used with any mass of the same material.
9,715.2 / 36.432 / 1000 = 0.26666t/co2/t
e.g. 36.432 * 0.26666 = 9.7145tCO2
It is upon this basis that the carbon calculator works. However, there are other factors that need to be considered other than just the production of materials. These are transport to site, waste disposal, plant emissions, and personal transport. In the carbon calculator some of the values are given as cradle to gate, meaning transport to site not included, whereas as some do (cradle to site). For those materials that are classed as cradle to gate, details on distance from producer to site have to be gathered personally. It is important that this information is where the material was produced, not sold. The other information is calculated depending on the size of construction site and length of time in operation.
Conclusion
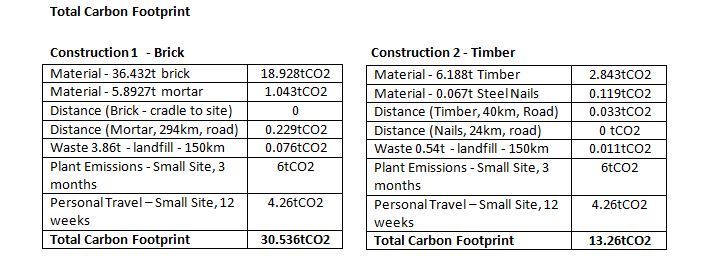
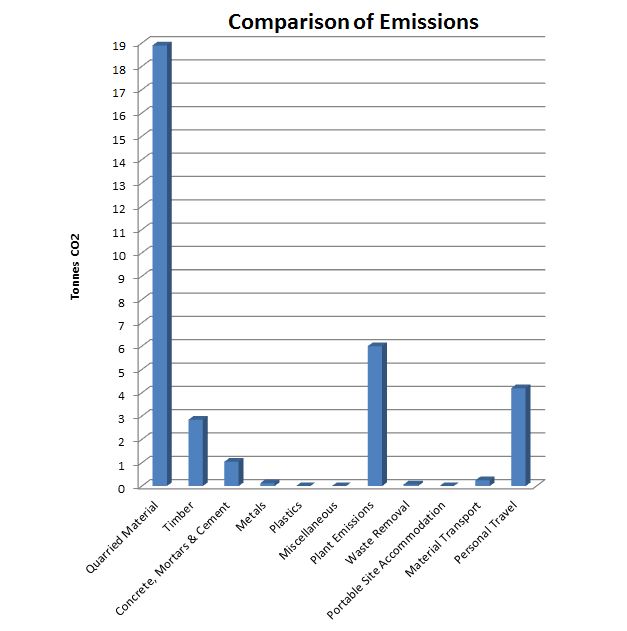
The carbon footprint of the brick and mortar construction is much greater than the timber cladding and nail. This is due to the energy intensive extraction and production processes involved in producing brick and mortar. Whereas, the production of timber has a, comparably, very small impact, it also sequesters carbon during growth. However, it needs to have been sourced from a sustainably managed forest or these benefits are cancelled out. The production of steel is very energy intensive, but there was very little used in this case so the impact is small. There are benefits to building with materials like brick, for example thermal mass generates a more stable internal temperature. However, it seems that with the overwhelming amount of CO2 it emits from cradle to site, we should be looking to build with low carbon alternatives like timber. In this case most of the materials were sourced locally resulting in a small contribution to the footprint. This is not always the case when you start to consider all the building materials, but the benefit of doing so can be seen here. The other major factors were plant emissions and personal transport. An effort to reduce these can be achieved by reducing the timescale of the project, and hiring locally.
The main limitation of using automatic calculators like this one produced by the Environment Agency is that the results are generalised. The carbon calculator assumes a method of production for each material, which could be vastly different from how the material you have access to was produced. However, it does provide an effective tool in illustrating where the majority of emissions come from, and providing a means to compare materials.
Bibliography
- Benfield ATT Group. 1996. Building the Future, together. Wall Panels. Accessed online on 15/02/2011, at; http://www.benfieldatt.co.uk/technical_information/standard_details/wall_panels.html
- Berge, B. 2009. The ecology of building materials / Bjørn Berge; translated by Chris Butters and Filip Henley. Amsterdam; Boston; London: Elsevier/Architectural Press, 2009.
- CT. 2011. Carbon Trust. Cut Carbon and reduce costs. Why Save Carbon? Further Benefits to your Business. Accessed online on 15/02/2011, at; http://www.carbontrust.co.uk/cut-carbon-reduce-costs/reasons/why-save-carbon/pages/why-save-carbon.aspx
- DEFRA. 2010. Guidelines to Defra / DECC’s GHG Conversion Factors for Company Reporting Produced by AEA for the Department of Energy and Climate Change (DECC) and the Department for Environment, Food and Rural Affairs (Defra). Accessed online on 15/02/2011, at; http://www.defra.gov.uk/environment/business/reporting/pdf/101006-guidelines-ghg-conversion-factors.pdf
- EC. 2007. European Commission. CARBON FOOTPRINT – what it is and how to measure it. European Platform on Life Cycle Assessment. Accessed on 15/02/2011, at; http://lca.jrc.ec.europa.eu/Carbon_footprint.pdf
- Hammond & Jones (ICE). 2011. Inventory of Carbon and Energy (ICE). Sustainable Energy Research Team, Department of Mechanical Engineering, University of Bath, UK.
- Herzog et al, 2004. Timber Construction Manual. Part 6, Built Examples; Facades. p299. Birkhauser Edition DETAIL.
- Lowes, 2011. Let’s Build Something Together. Grip-Rite 16D Cut Nails 1lb. Box. Accessed online on 15/02/2011, at; http://www.lowes.com/pd_69209-1278-16CUTMAS1_4294934474+5003695+4294859894_4294937087_?productId=3059155&Ns=p_product_prd_lis_ord_nbr%7C0%7C%7Cp_product_quantity_sold%7C1&pl=1¤tURL=%2Fpl_GripRite_4294934474%2B5003695%2B4294859894_4294937087_%3FNs%3Dp_product_prd_lis_ord_nbr%7C0%7C%7Cp_product_quantity_sold%7C1&facetInfo=$5%20-%20$10%7CGrip-Rite
- Wentwood Timber Centre. 2011. Monmouthshire Green Web. Wentwood Timber Centre, Wentwood, Caldicot, NP26 3AZ. Accessed online on 15/02/2011, at; http://www.monmouthshiregreenweb.co.uk/WentwoodTimberCentre/index.htm