Essay on Hypothesis Testing for Regional Real Estate Company
Number of words: 1746
Introduction
Real estate companies are business agencies that carry out sales of houses through their agents to customers. As a business setup, several factors play a role in convincing customers to buy a home through one agency or region and not the other. One of the key factors used to determine the cost of selling a house is the home’s floor space; this is measured in square footage. Other factors that can be considered while selling a house include the geographical location, number of floors, proximity to resources, infrastructure, availability of parking space (Bouman, 2020). Every Real Estate agency is a business setup that faces stiff competition from fellow agencies. This is why every agency is working harder to offer their services in the best ways possible that would attract more customers to the market (Sanderson, & Read 2020).
This study is aimed to determine if the average cost per square foot of a home for sale by the companies’ salesperson is above the average selling price per square foot in the pacific region. If this holds, more homeowners will be attracted to sell through the regional real estate agency for which the agent is selling. This factor will be used to produce advertisements that will be targeting potential customers in the pacific region. A T-test is used to test the significance of the null hypothesis at alpha equals 0.05 significance level (Pyzdek, 2021).
Setup
There are many houses in the pacific region; it would be time-consuming given that the dataset for all homes would be too big and will take more time to analyze. For this reason, the study focuses on a sample of 1001 homes to establish their sample statistics, which would then be used to draw assumptions concerning the population parameters for the descriptive statistics of the region.
To test the validity of the study objective, the study formulates a hypothesis to be addressed by the findings, the null and alternative hypotheses are as defined below.
H0: The average cost per square foot for selling a home by the salesperson is less than or equals the average selling price per square foot in the Pacific region (H0 ≤ 275).
H1: The average cost per square foot for selling a home by the salesperson is above the average selling price per square foot in the Pacific region (H1 > 275).
The test for the hypothesis is right-tailed because the salesperson holds that his sales are above the average cost per square foot in the Pacific region. We intend to use the sample statistic to conclude the population parameter for a sample dataset and a parameter whose value is known to be 275. One sample t-test is carried out at a 95% confidence interval to find if the test hypothesis is significant. Performing a t-test is supported by the condition that the sample data points are independent (Mueller, 2020).
The selling price per area of one house does not depend on the selling cost of another house, implying that this condition is met by the dataset (Bouman, 2020). The values in the dataset are in dollars per square foot which are in a continuous measurement scale as needed by the second condition for performing a one-sided t-test, and it can also be noted that the sample dataset is assumed to have been obtained using a simple random sampling procedure from the study population by the regional Real Estate salesperson in the pacific region (Sanderson, & Read, 2020).
Data Analysis Preparations
Table 1: Summary statistics for the cost per square foot.
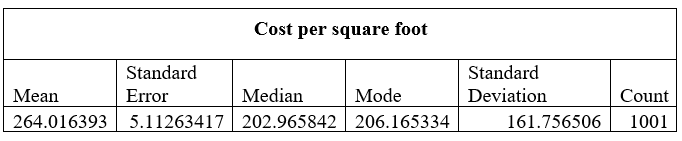
To test the significance of the hypothesis, a sample of 1001 representing houses from the pacific region is drawn from the regional dataset for the house listing prices. It is a representative sample because it is obtained using a simple random sampling procedure that is not subject to manipulation by the researcher. The sample statistics output produced in table one shows that the houses’ mean cost per square footage is 264.02. The median value for the same is 202.97 and has a standard deviation of 161.76 (Pyzdek, 2021).
The value for median and mode is approximately equal, with a significant difference from the mean value of the sample. The presence of a big gap between the mean and median shows that the dataset is skewed. It then implies that the median is the best measure for the center of the distribution. A significant standard deviation indicates that the majority of the data points are far spread away from the mean value (Pyzdek, 2021). The cost per square foot for most homes is approximately $206.17, as presented by the model in the summary statistics table. Mean is affected by outliers in a dataset as it counts for the average of all data points from the sample. Skewness equally shifts the mean value and the mode as measures for the center.
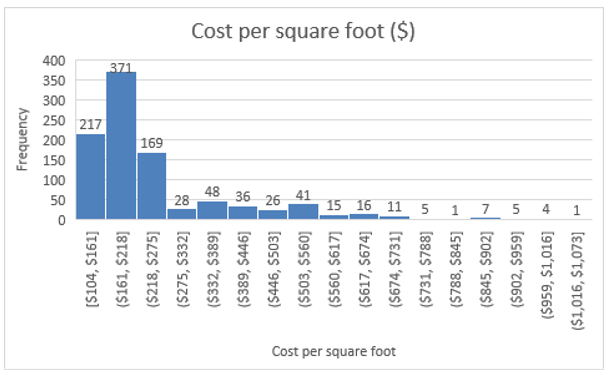
Figure 1: Histogram for cost per square foot for the homes.
From the histogram produced in figure 1, it can be observed that the cost per square foot for the houses in the sample dataset is skewed to the right. It is another evidence to support that median is the best measure for the center of the data. Mean is used when the data points show a normal distribution. A similar condition applies for mode when used as a center measure (Sanderson, & Read, 2020). Median is not affected by the skewness of a dataset like the other two measures for the center. The spread of the data points can be measured using the standard deviation or the range of the summary statistics, which captures the difference between the maximum and minimum values in the dataset (Mueller, 2020).
From the summary statistics table, 167.76 data points are spread far away from the mean value. The figure also shows that out of the 1001 sampled homes, most of them sell at a cost between $161 and $218. The frequency for the houses declines with an increase in the selling price per square foot of the home dealt by the real estate agency in the pacific region. The sampled dataset meets statistical assumptions that must hold to perform a right tail one-sample t-test. It can be observed that the data points are independent of one another as the area of one house does not depend on the area of another one. The sales values are in dollars per square foot, they are on a continuous measurement scale, and the sample dataset is assumed to be obtained using a simple random sampling procedure (Pyzdek, 2021).
Calculations
To find an appropriate test statistic for the sample population, we use the following formula for obtaining a test statistic for a one-sample t-test;
Test statistic = (mean – target)/standard error
Where the target is 275. Substituting the values in the formula we obtain,
Test statistics = (264.02 -275)/5.11
= -2.15
A negative test statistic indicates that the one-sample t-value lies on the left of the sample mean. The absolute value of the t-statistic is used to calculate the p-value. Because our data points are tailed to the right, we apply the following formula to calculate the p-value in a Microsoft Excel spreadsheet. The degree of freedom is obtained by subtracting a value of one from the sample size obtained from the study population (Sanderson, & Read, 2020).
p-value = T. DIST.RT ([test statistic], [degree of freedom])
= T. DIST.RT ([-2.15], [1000])
= 0.98403627
The p-value shows that 98% of the distribution curve lies on the right side of the tail, 2% of the dataset is in the distribution lines on the left side of the curve (Mueller, 2020). This can be illustrated using the distribution curve below
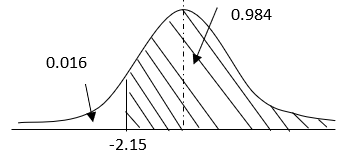
Figure 2: Distribution curve for cost per square feet.
Test Decision
Analysis for this study is based on an upper tail, one-sample t-test for significance at a 95% confidence level. For our test statistic to be statistically significant, the p-value must be greater than or equals to the alpha at a significance level (Volchok, 2020). The hypothesis under study states that;
H0: The average cost per square foot of selling a home by the salesperson is less than or equals to the average selling price per square foot in the Pacific region (H0: µ≤ 275)
H1: The average cost per square foot of selling a home by the salesperson is more than the average selling price per square foot in the Pacific region. (H1: µ> 275)
Our absolute t-value is greater than the alpha value at 95% confidence interval, 2.15 ≥ 1.645. We, therefore, reject the null hypothesis in favor of the alternative hypothesis that the average cost per square foot of selling a home by the salesperson is above the average selling price per square foot in the Pacific region. This means that the statement by the salesperson is valid for concluding the sale of houses in the pacific region (Bouman, 2020).
Conclusion
The alpha level for the significance of our test is α = 0.05 and the critical value = 1.645. The calculated p-value for the data set is obtained as 2.15, which is greater than the critical value. This supports our decision to reject the null hypothesis at a 5% significance level (Volchok, 2020). Rejecting the null hypothesis implies that the decision by the sales agent to advertise his claim is supported as it bears a valid significance which the test results can prove. The conclusion for this study is therefore statistically significant at a 95% confidence interval. Therefore, it can be recommended that the salesperson proceeds with producing advertisements to attract clients who intend to sell their houses as he can prove his claim.
References.
Bouman, J. A. (2020). The best-offer-over pricing method: the best strategy? A case study in the Rotterdam housing market (Doctoral dissertation).
Pyzdek, T. (2021). Descriptive Statistics. In The Lean Healthcare Handbook (pp. 145-149). Springer, Cham.
Volchok, E. (2020). Clear-Sighted Statistics: Module 14: One-Sample Hypothesis Tests (slides).
Mueller, U. K. (2020). A More Robust t-Test. arXiv preprint arXiv:2007.07065.
Sanderson, D. C., & Read, D. C. (2020). Recognizing and realizing the value of customer-focused property management. Property Management.