Dynamic Causal Modelling as an Effective Connectivity Measurement Method
Introduction
In recent years, the idea of functional and effective connectivity measurement of the brain has attracted much attention. Our brain is an interconnected network. The interaction between brain regions is fundamental to brain function and this interaction can be quantified by brain connectivity measurement methods. Brain connectivity usually refers to three basic terms: structural, functional and effective connectivity [1]. Structural connectivity describes the anatomical structure of the brain and the pattern of anatomical links inside the brain [1]. Functional and effective connectivity, on the other hand, relate to signals passing between brain subsections. While functional connectivity refers to statistical dependencies of neural activities between distinct areas of the brain, effective connectivity measures the causality of brain interactions [1]. Different techniques have been introduced to measure both the functional and the effective connectivity [2, 3] of the brain using EEG signals, one of which is Dynamic Causal Modelling (DCM) [4]. DCM measures the influence that one area of the brain exerts over itself or another area. DCM has some advantages over other conventional connectivity methods, such as being a biophysically informed model, accounting for nonlinearities of the neuronal system, and having a known input to the model. Because of this, many researchers have become interested in this approach. The validity of this method has been reported for different sets of brain responses such as visual and auditory responses [3] and it has been used in many studies for varied purposes, such as understanding the neural interactions in psychological disorders [5] or the vegetative state [6]. Whilst DCM has potential advantages over other models, a possible weakness in the approach is the large number of parameters and initial assumptions which may cause instability in the algorithm.
The DCM algorithm has been implemented in the Statistical Parametric Mapping (SPM) software which is a MATLAB-based toolbox [7]. This software is used in this paper to model the effective connectivity of the brain using DCM in response to auditory stimulation.
In preparing to use this approach and the SPM toolbox, we tested the algorithm on different platforms and different versions of the toolbox and of Matlab. The current paper reports on inconsistent results obtained in this way and aims to alert to potentially misleading results arising with the use of this package. To the best of our knowledge, results of similar comparisons do not appear to have been published previously.
Methods
DCM first considers a neuronal mass model for brain regions of interest [8]. Then, using the output response measured by EEG and some prior biological knowledge about model parameters and assuming an action-potential-like input to the system, DCM estimates the parameters so that the model fits the output. For this purpose, a Bayesian framework is employed in which the prior is the distribution of the parameters and the posterior is the probability distribution of the measured output. The prior hyperparameters are set according to knowledge about the architecture and behavioural characteristics of the brains neural networks [8]. The remaining parameters are identified iteratively by minimising the free energy of the system, which can be regarded as the estimation error, using an expectation-maximisation (EM) algorithm. In each iteration, first a posterior distribution is calculated according to the minimum free energy (E-step) and then a new set of parameters are computed according to the updated posterior distribution (M-step). The EM procedure iterates the E and M steps until the decrease of the free energy stops. The important point is that various models (defined as different patterns of connectivity between brain regions) can be defined and compared according to the log-evidence (the probability of the output given a specific model) calculated from the model and the best fitted model is selected as the one with the highest log-evidence [8]. This best model is considered significantly better than other models if its log-evidence is at least 3 units larger than the log-evidence of other models.
Materials
The DCM method was tested on data collected during auditory stimulation of normal-hearing subjects, in experiments that aimed to elucidate changes in brain connectivity during pure-tone and speech stimulation. Only results from the former protocol are reported here.
A. Stimulus Characteristics
Two pure tones were presented binaurally at 55dBHL approximately every 2 seconds at random intervals. The tones were 80ms-long 1kH (120 times) and 2 kHz (480 times) tones with 5ms-long rise and fall times.
B. Data acquisition
The ethical approval was received for this study and the participant consented to take part in the experiment. A 66-channel EEG cap with equidistant electrode positions was placed over the head of a 30-year-old normal hearing male subject. The reference of the system was the nose tip and the ground electrode was placed on the line passing the nose tip and the brain vertex just above the forehead. The subject listened to the randomly played tones with eyes closed while sitting in a comfortable armchair.
C. EEG pre-processing
EEG was filtered in the 0-30Hz band and epoched around the onset of the 2kHz stimulus (200ms pre- and 500ms poststimulus). Data were visually checked and showed the expected evoked potential. Fifteen different sets of data were generated by randomly selecting 240 epochs from the 2kHz stimulus and averaging them. Electrode positions were coregistered to the template MRI map available in the SPM8 toolbox with nasion, right, and left auricular points being the fiducial points which were defined manually.
D. DCM quantification
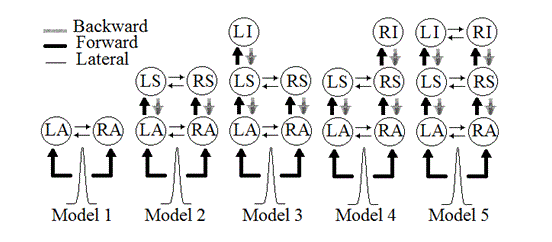
The GUI interface of SPM DCM was used and different models as in Figure 1 were defined with all forward, back ward, and lateral connections present [3]. In these models, Left and Right Primary Auditory Cortices (LA and RA), Left and Right Superior Temporal Gyri (LS and RS), and Left and Right Inferior Frontal Gyri (LI and RI) were used. These areas are shown to be related to sound perception in the brain [3]. Positions of these areas were taken from [9] and RI was assigned a symmetrical position to LI with respect to the sagittal line. Furthermore, the input of the system was defined to occur around 40ms after the stimulus onset and affect both LA and RA. The distributed spatial model was set to Equivalent Current Dipole (ECD) and other parameters of DCM GUI were left to default values.
DCM estimates model parameters and reports a probability value for each parameter being greater than zero. Parameters with probabilities higher than a set value can be considered responsible for the difference between the observed output and the baseline condition which is assumed zero output in this report. Here, the probability level is set to 90%.

Fig. 1: Five different models used with DCM
E. Software systems
Parameter estimations were performed using versions 4667 and 5236 of SPM8 (sv.4667 and v.5236), two versions of MATLAB 64-bit (mv.2011a and mv.2012a), and three Personal Computers (PC) two with Windows 7 64-bit and one with Red Hat Enterprise Linux 64-bit as their Operating System (OS). Note that sv.4667 is older than sv.5236. Note that DCM GUI default values were the same in the two versions of SPM8 used.
Results
A. Reproducibility of DCM
Fifteen generated datasets were used to test the reproducibility of DCM in one subject. Models 1 to 5 of Figure 1 were defined and estimated for each dataset. In all except 2 datasets, model 5 was significantly better than other models.
The fact that 13 out of 15 datasets reported the same model as the best model speaks for the reproducibility of DCM but looking closer at estimated connection strengths of this model (model 5) showed that for each dataset, different connections were held responsible for the output. In the process of investigating this fact further, unexpectedly, some discrepancies were found in the estimation results of the same model when a new PC was used. This event motivated us to inspect the reliability of SPM before going any further with investigating the reproducibility of DCM.
B. Reliability of SPM
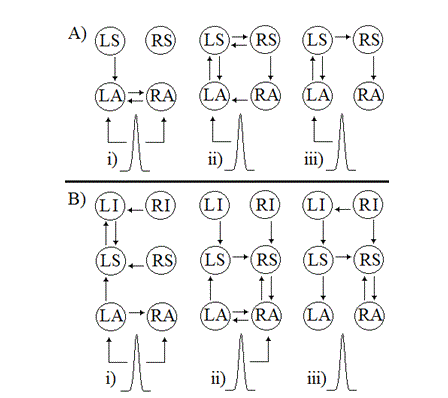
a) Data from the current research: To test the reliability of SPM, models 2 and 5 of Figure 1 were selected. The estimation of these two models was performed using two versions of SPM8 and MATLAB as explained in section III.E for one of the generated datasets. For each model, the results show very different connectivity patterns for this dataset when the version of SPM or MATLAB changes. This discrepancy was observed in both model 2 and model 5. Figure 2 shows examples of these estimates. To help interpretation of the results, only the connections with probabilities higher than 90% are plotted in this figure. For example in Figure 2.A.i, both lateral connections between LA and RA are responsible connections whereas in Figure 2.A.ii only the connection from RA to LA seems responsible and in Figure 2.A.iii no connection between RA and LA is reported responsible. As another example, Figure 2.B.i shows that the input enters both primary auditory cortices but Figure 2.B.ii presents that the input enters RA only. On the other hand, Figure 2.B.iii shows that for the same model, no input is responsible for the observed evoked response. It should be emphasised that all the pre-processing steps taken and all parameters entered the estimation algorithm for different versions of SPM and MATLAB, were the same. It should also be noted that when the same model was estimated more than once in the same combination of software versions, the results were found to be identical.
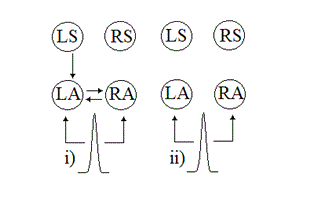
In another test, the versions of SPM and MATLAB were kept unchanged but the analyses were run on two different PCs with the same OS (Windows 7 64-bit). In this case the responsible connections did not vary for either of the two models (models 2 and 5). However, when the OS of one of the PCs changed from Windows 7 to Linux, even with the same SPM and MATLAB version, different results were obtained. The implementation of this condition for model 2 is presented in Figure 3. It is worth mentioning that the log-evidence of the estimated models did not vary in a consistent way across software versions. For example, keeping the combination of mv.2011a and Windows 7 unchanged, the log-evidence of model 2obtained from sv.5236 was significantly larger (greater than 3 units larger – see section II) than the one obtained from sv.4667 but the log-evidence for model 5 in sv.5236 was significantly smaller than the one in sv.4667. So, it cannot be said that the new changes to the SPM version have resulted in higher log-evidence as sometimes newer versions of SPM produce lower log-evidence values.

Fig. 2: Responsible connections in generating the evoked response in A) model 2 and B) model 5 for the same set of data. i) mv.2012a & sv.4667, ii) mv.2012a & sv.5236, iii) mv.2011a & sv.5236. The pulse acts as the input to the model.

Fig. 3: Responsible connections in generating the evoked response in model 2. In both i and ii, sv.4667 and mv.2011a were used for the same set of data but OS was different: i) Windows 7 and ii) Linux. The pulse acts as the input to the model.
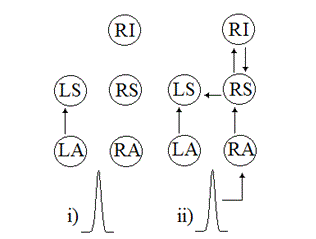
b) Data from the SPM website: Similar analyses were performed on a publicly available EEG dataset in SPM website [7]. This dataset is called the mismatch negativity (MMN) dataset and the EEG is recorded in response to similar stimuli as were used in the current research. More information about this dataset can be obtained from [3]. The data was already pre-processed so no further pre-processing was applied to the data. Model 4 of Figure 1 was used to initialise the DCM algorithm. All interactions were assumed connected in this model except for lateral connections between RA and LA to be consistent with [9]. The input pulse was defined to occur around 60ms after the onset. Other initialisation steps were the same as described in section III.D except that the baseline condition was the averaged 1 kHz response. To analyse the data with DCM, the SPM version and the OS were kept the same but the MATLAB version was changed. Once again, different responsible connections were obtained for the same model and the same set of data. The results of these analyses can be seen in Figure 4.

Fig. 4: Responsible connections in generating the evoked response in model 4 for MMN dataset available in SPM website. In both i and ii, sv.4667 and Windows 7 were used but the MATLAB version was different: i) mv.2011a and ii) mv.2012a. The pulse acts as the model input.
Discussion
Possible reasons behind the variation in results could include different precision of the MATLAB version or the OS or different numbers of computation loops or slightly different estimation algorithms in various versions of SPM.
Another possible explanation for the differing results might be that different versions of the software use different random initialisation values, but the same values are used in each repeat when using the same software setup. While this would be surprising, it does raise questions regarding the robustness of the algorithm. Furthermore, no mention appears to have been made in the documentation that random steps are used in the algorithm or could cause different results.
The current results clearly do not prove that connectivity measures derived from DCM are always unreliable. However, one example showing clear evidence of a lack of robustness raises the possibility of misleading results. To probe this a little further, a second example was tested, using the data made available by the developers of the toolbox. This also indicated large inconsistencies when different versions of the software were used.
It is not yet known what generates this variability in the results but whatever the reason is, caution should be employed in the interpretation of results of DCM using the SPM toolbox.
Conclusion
It is shown for the first time in this paper that the results of estimating DCM parameters using SPM toolbox can vary greatly depending on the version of MATLAB or SPM, or the OS being used. This was observed in auditory evoked potentials and also test data provided on the SPM website: the responsible connections of DCM estimation algorithm may differ considerably if the version of MATLAB or SPM, or the operating system changes. It is thus suggested that the SPM toolbox should be used cautiously when implementing DCM.
References
- Daunizeau J., David O., Stephan K.E., Dynamic causal modelling: A critical review of the biophysical and statistical foundations NeuroImage. 2011;58:312 – 322.
- Sakkalis V., Review of advanced techniques for the estimation of brain connectivity measured with EEG/MEG Computers in Biology and Medicine. 2011;41:1110 – 1117.
- David O., Kiebel S.J., Harrison L.M., Mattout J., Kilner J.M., Friston K.J., Dynamic causal modeling of evoked responses in EEG and MEG NeuroImage. 2006;30:1255 – 1272.
- Friston K.J., Harrison L., Penny W., Dynamic causal modelling. NeuroImage. 2003;19:1273 – 1302.
- Dima D., Roiser J.P., Dietrich D.E., et al., Understanding why patients with schizophrenia do not perceive the hollow-mask illusion using dynamic causal modelling. NeuroImage. 2009;46:1180 – 1186.
- Boly M., Garrido M.I., Gosseries O., et al. Preserved Feedforward But Impaired Top-Down Processes in the Vegetative State Science. 2011;332:858 – 862.
- Statistical Parametric Mapping at http://www.fil.ion.ucl.ac.uk/spm/. Last accessed 24/04/2013
- David O., Harrison L., Friston K.J., Modelling event-related responses in the brain NeuroImage. 2005;25:756 – 770.
- Garrido M.I., Kilner J.M., Kiebel S.J., Friston K.J., Evoked brain responses are generated by feedback loops Proceedings of the National Academy of Sciences. 2007;104:20961 – 20966.