Consultant Report of SONY
Number of words: 16621
Sony entered the decade of the 2010s with financial difficulties due to music and film piracy, the PS3 not reaching targets, and several natural disasters in Asia, which left the firm in need of structural changes that needed to be implemented immediately.
This gave birth to the Transformation of Sony Strategy in 2012, which included three mid-range plans to be executed during the decade that were designed to increase the quality of income by reducing cashflow volatility and increasing profit.
The strategy has proved to be a success, yielding record levels of operating and net income in the fiscal year ended March 2019, which also skyrocketed the share price an average of 29.12% a year, generating very high return on investment for shareholders.
The company’s financial statements of fiscal year ended March 2020 show strong income and cashflow statements as well as a strong financial position, having a high proportion of debt in its capital structure as the main challenge to be carried forward.
Percentage of revenue by segment:
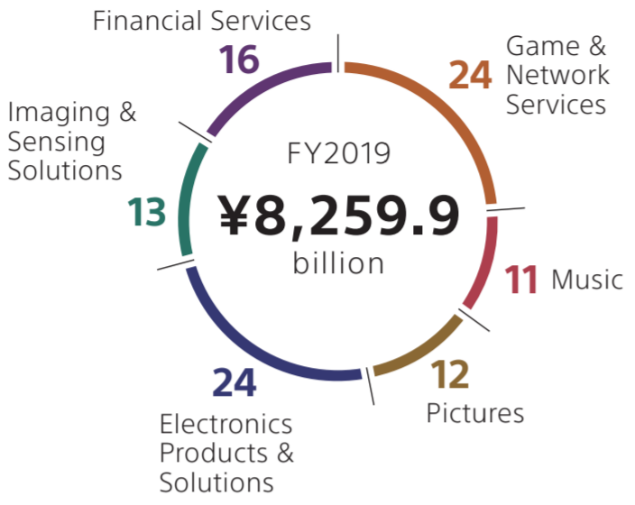
The Electronic Products and Solutions segment has a few challenges that need to be overcome in following years, such as the consistently shrinking market share of televisions and the Mobile Communications division being run at a loss for the last three years.
However, it is expected that upcoming products with new features under 5G and the internet of things (IoT) will help to re-expand this division and make it go back to profit.
Main strengths and opportunities:
- Favourable environment: selling products to hundreds of millions of people around the world generates trillions of Yen in revenue every year, which also maintains reputation and an important customer niche.
- The firm operates mainly in oligopolistic industries, which considerably reduces the threat of new entrants and in some cases helps to yield abnormal profits.
- Customers usually have very little bargaining power.
- Very stable business, some segments being either number one or one of the leading names in industries.
- Partial resilience to economic recessions due to direct to customer services (DTC) and a well-diversified portfolio of products (conglomerate).
- Upcoming decade approaching filled with trading opportunities for the firm due to potential boost of global GDP after the Covid-19 crisis.
Main weaknesses and threats:
- In certain scenarios, suppliers may have some level of bargaining power.
- Other firms of similar size have much lower proportion of debt and a much higher proportion of equity in their capital structure.
- High level of liabilities implies potential reduction of investing opportunities in the future.
- Very high number of substitutes for some products.
Main recommendations:
- Increase TV and mobile phone sales by spending more in advertising, selling cheaper models and including more differentiating features.
- Increase efficiency in the Pictures segment.
- Invest heavily in augmented and virtual realities on your Game & Networks segment to become number one in this new field.
- Improve working and paying policies for artists on the Music segment. Improve industry reputation.
1.Introduction
This report aims to analyse the current situation the company is in and to come up with possible advice strategies that may improve the firm’s performance during upcoming years.
To accomplish this, a report structure derived from the rational model has been used.
Chapter 2 analyses the external environment of the firm using PESTLE analysis, and the industrial environment using Porter’s five forces.
Chapter 3 delivers an analysis of the company accounts in reference to the financial statements and compares it against a main competitors’. It includes a segment analysis, using appropriate competitors for each for the purposes of comparison.
Chapter 4 delivers and investment analysis, using CAPM related measures.
Chapter 5 wraps up the whole analysis showing the strengths, weaknesses, opportunities and threats and uses a balance scorecard to state recommendations and a framework upon which the firm may build their strategies for the following years.
2.Business environment and strategy
2.1. PESTLE-based external analysis
2.1.1. Political factors
Sony benefits from international trade with most developed, industrialised countries in the world, which allows the company to sell their products to great numbers of people, yielding trillions of Yen of revenue.
Political stability and trade deals between countries are factors that pave the road for successful, stable international business. Sony is reaping the fruits of political infrastructures such as trading blocs.
However, not all of the firm’s products are produced within these blocs. The company also exports products to several countries, which means having to comply with a wide range of trading and health and safety requirements, as well as many different taxation policies and exchange rates.
As the company trades with so many nations, the firm may be negatively impacted by political issues tha affect business, such as the increase of tariffs for exports or possible political instability in countries where the firm has operations.
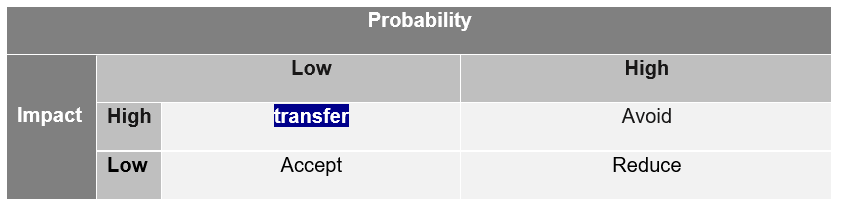
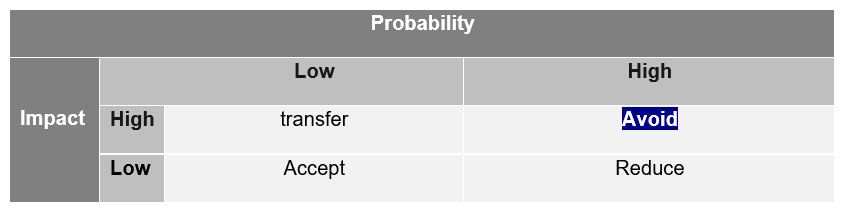
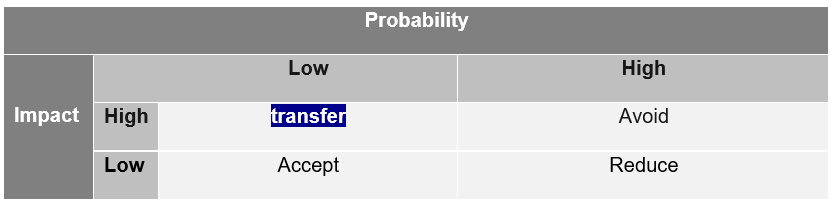
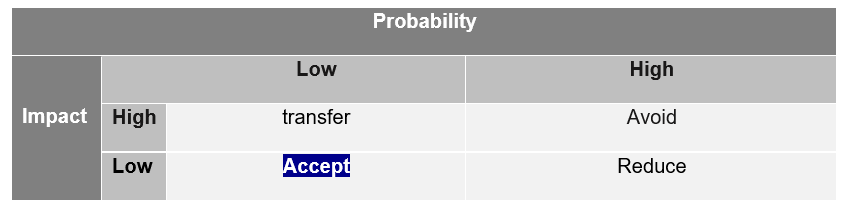
Brexit, one of the most recent political developments, is expected to negatively impact the British economy, possibly leading the British government to raise corporate and other types of taxes.
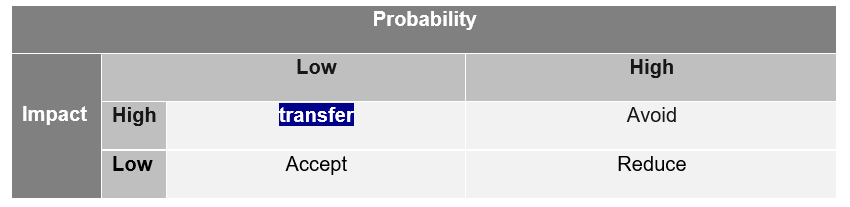
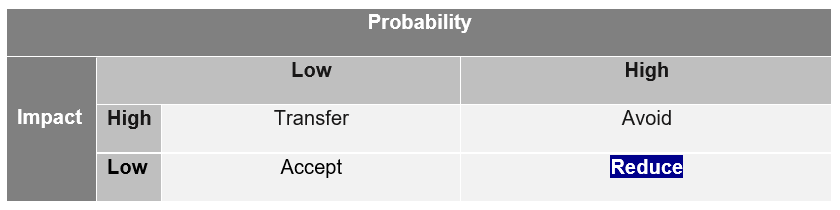
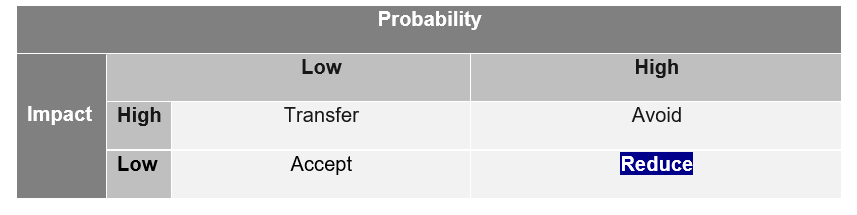
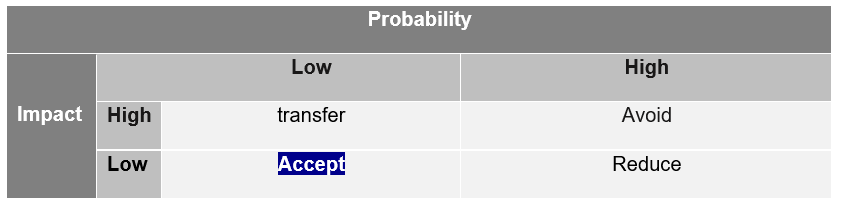
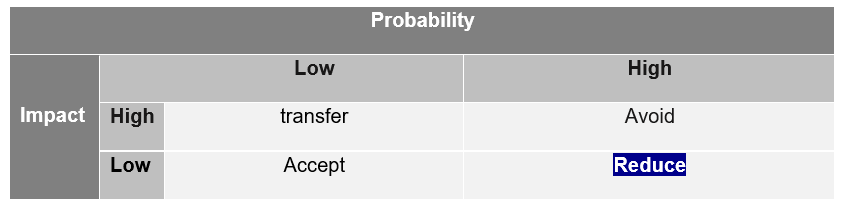
As Brexit is taking place, the threat agent risk assessment (TARA) would categorise it as being of high probability and low risk, with the best course of action being to reduce the impact – which the company has already done by moving their UK headquarters to the Netherlands (BBC, 2019).
List of mentioned political risks and assessment by TARA:
Risk of Brexit
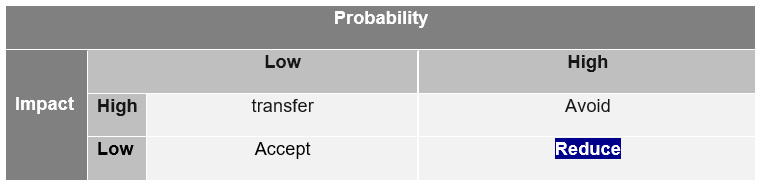
Risk of political instability in countries
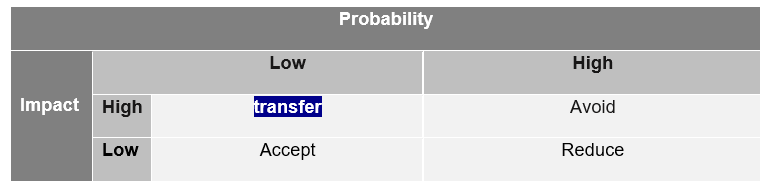
Risk of increase in tariffs

In upcoming years, Imports to the UK should remain mostly the same. Imports to EU countries, Asia and Americas should remain unaffected. There should not be any other significant political changes that could affect Sony’s exports or in-country operations occurring any time soon. Moreover, the firm has a long history of properly coping with tariffs and exchange rates and overall international success.
Unfavourable political factors: Low risk of political instability in countries where the firm operates and low impact of increase in tariffs.
Favourable political factors: Trading blocs that allow the firm to reach hundreds of millions of customers around the world.
The firm’s position in the global political environment is favourable.
2.1.2. Economic factors
As most of the products that Sony sells are not of first necessity, the firm’s income is positively correlated with economic trends. Economic environments where people have high levels of disposable income are ideal for the company’s trading activities. The tables below show the GDP growth of OECD (OECD, 2020) countries over eight years and the growth of firm’s revenue over the same period.
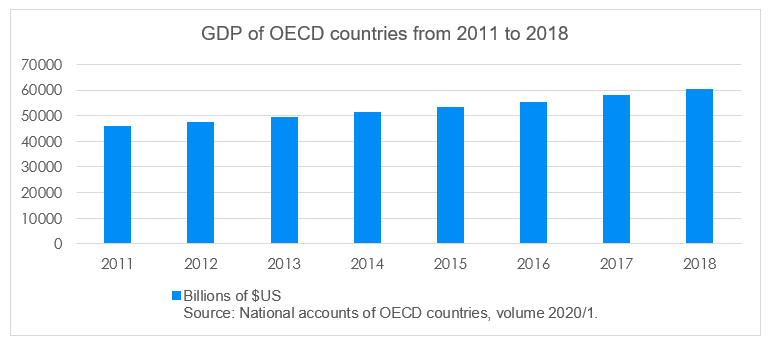
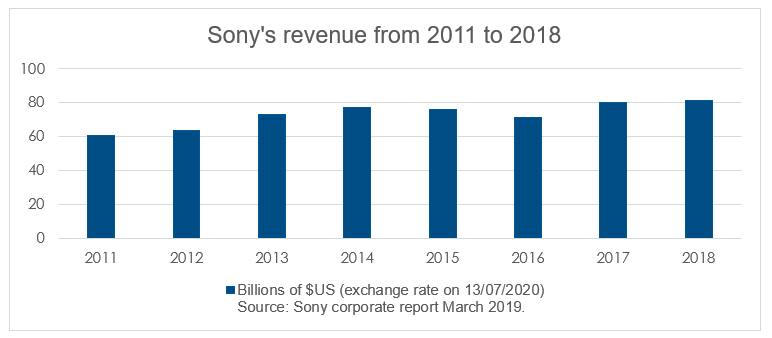
Figure 1: GDP of OECD and Sony’s revenue from 2011 to 2018
These numbers indicate that Sony’s revenue has, on average, grown at a similar pace as the growth of GDP of OECD countries over the same period, with a correlation coefficient of nearly 0.9 (close to perfect correlation) which confirms the relationship between economic trends and business opportunities for the firm.
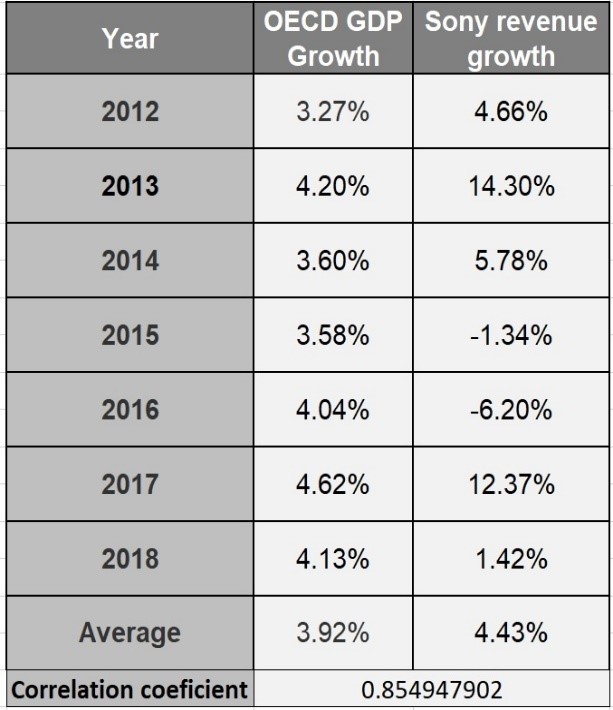
Figure 2: Correlation coefficient between OECD GDP and Sony’s revenue
The growth of revenue for the company and the boost of GDP numbers around the world, origin partially from an economic recovery that started in 2010, after the 2008 credit crunch had hit the global economy.
It has been observed that economies tend to accelerate after economic recessions (Henry et al, 2000) and grow for a sustained period. Looking at the revenue levels over the past decade, it is evident that Sony took advantage of this upward economic trend, generating record levels of net income in 2018.
As the world economy has just begun to wake up from an economic recession caused by the Covid-19 pandemic, the prospects for business growth for the firm are optimistic as a new upward economic trend may commence in 2021, which will launch a new range of products that the firm is currently preparing.
Furthermore, the recent Covid-19 crisis and the shutdown of the economy have proved that when people spend most of their time indoors, Sony products experience a spike in sales as demand for home entertainment increases, especially digital content. In the past months, this has boosted further the most profitable segment of the firm – Gaming and Networks.
‘The video game industry continues to see an impressive jump in both revenue and attentiveness to esports from major media companies as coronavirus-related restrictions roll into May, keeping millions of people at home and searching for new forms of entertainment.’ (Smith, 2020).
This is very convenient as the impact of an economic recession does not impact the firm’s income immediately. The industry will see profit increase for some time before it starts decreasing. This can help to go through a smooth transition from an economic recession into normal trading conditions with a minimum impact on profits, presenting the company with business opportunities during short-term economic recessions.
One factor that affects the firm negatively is changes in exchange rates. If exchange rates increase or the Yen gets devalued against most main currencies, it would lead to a reduction of profits for the company.
Furthermore, increases in interest rates would increase the cost of capital of the firm, reducing the possibilities for expansion and capital investment in new projects.
List of possible economic risks:
Risk of deep global recession
Risk of increase in interest rates
Risk of increase in currency exchange rates and or devaluation of the Yen
Unfavourable economic factors: low risk of long-term economic recessions, stagnation of incomes and possible strong impact of increase in interest rates.
Favourable economic factors: Resilience during short-term economic recessions, generally affordable products and economies of scale.
The firm’s position in the global economic environment is favourable.
2.1.3. Socio-cultural factors
As Sony trades with many countries, socio-cultural factors must be monitored and studied in every society in which the firm trades. This is of great importance as it helps to identify which cultural behaviours in a society are well accepted and which ones are not, since this can help to track changes in consumer preferences and therefore boost business opportunities.
Adapting to socio-cultural environments is not only convenient for business purposes, but a necessary skill for overseas survival.
Johnson et al (2006) commented that the failures of international business were due to the inability to understand the local culture where subsidiaries are established and the inability to effectively communicate with the locals. This means that, in order to be successful when dealing with such high levels of diversity, there needs to be cross-cultural competence (Gertsen, 1990) in every region of the world with which the company interacts.
Sony has successfully set operations and traded around the world for over half a century, which shows how committed the company is when it comes to keeping ties with different societies. This is only possible by understanding and adapting to socio-cultural trends. Diversity has become one of the strengths of the firm. It helps being accepted in a society, builds reputation, and helps to sell products globally.
Additionally, the existence of social media and network services helps to bring societies together. It is not just about diversity at the operational and distribution levels, but also the fact that Sony keeps customers around the world connected with cloud services, boosts the firm’s reputation and validity of their contextual discourse of diversity.
Risk of impact of pressure groups leading to losses/market failure
Risk of impact of changes in cultural trends, fashion and lifestyles
Unfavourable socio-cultural factors: low risk of unacceptance leading possibly to market failure (pressure groups) and probable risk of changes in trends and lifestyles.
Favourable socio-cultural factors: The firm is perceived globally as a diverse, fairly socially responsible company, which maintains good reputation. Also, the company has been adapting to socio-cultural changes successfully for over half a century.
The firm’s position in the socio-cultural environment is favourable.
2.1.4. Technological factors
Since the company mainly manufactures electronic devices and develops software, it bases operating activities in a fast-paced environment where technology changes constantly and products have relatively short life cycles. The firm needs to consistently adapt to these technological changes to thrive. Keeping up with technological trends is essential for success in this industry.
The constant development of better electronic devices makes the price of existing products shrink quickly with the pass of the years, along with operating income. This means that the firm needs to proactively come up with new competitive products and strategies so they can keep up with the trends. Capital expenditure and the use of skilled labour are needed for these purposes.
However, the company has been adapting to these changes for decades. According to historical developments, one would only expect the firm to keep on moving forward as they have and adapt to changing times appropriately. Sony has proved to be a producer of new technologies that have been mainstream for decades. In the case of falling behind, the firm has the capital and know-how that would allow them to bounce back.
Additionally, the implementation and use of 5G technology in upcoming years will allow for new products with new features, opening doors to further business opportunities around the world. Sony can relaunch their currently struggling Mobile Communications division with a clean image and profit-making opportunities, exploiting the internet of things (IoT).
Risk of disruptive technologies
Risk of negative impact by new production processes
Unfavourable technological factors: Fast-paced evolving industries, risk of other firms disruptively innovating before Sony does it first, current relatively small market share of televisions and mobile phones.
Favourable economic factors: Over half a century of experience, resilience and innovation with success. High levels of reserves to deal with virtually any shortcomings related to innovation. Smoothed competitive rivalry due to innovation and product differentiation. Technological breakthrough due to 5G implementation in new devices is forecasted.
The firm’s technological position is generally favourable.
2.1.5. Legal factors
Sony must comply with health and safety and minimum wage regulations in each country where they operate. Tight health and safety regulations and increases in wages would negatively impact the firm’s profits.
However, the firm has countless patents and it profits from them. Patents help to create products that differentiate from competitors’, which is key to protect intellectual property.
The research-based view of the firm explains why different companies in the same industry obtain different levels of profit, that being differences of internal resources in each company.
These resources give firms competitive advantage. In the case of Sony, this advantage is obtained mainly through intangible resources (intellectual property and knowledge), which allows the firm to create tangible resources and trademark these, so they can claim revenue from and differentiate them from competitors’.
‘It is currently believed that for an organisation to achieve competitive advantage on the market, it must have, among a broad range of other competencies, attributes that differentiate it (or its products or services) from other institutions operating in the same market sector’ (Wojciechowska 2016, p. 39).‘
One of the features that allows intangible resources to provide companies with competitive advantage in the market is the fact that they cannot be easily transferred or imitated by other firms.
The ability to legally patent and trademark products that differentiate from competitors’ is a key feature of Sony’s line of business, which time and again proves to be profitable. Patents and trademarks are also known to be barriers to entry.
A wide portfolio of patents and trademarks allows Sony to protect its intellectual property from competitors, to profit from it and to deter potential entrants in the industries where the firm operates.
A common risk that arises using patents and trademarks is releasing something that is similar to a product that is already patented or trademarked, which often leads to lawsuits. However, in this situation, Sony would have the legal resources and capital to face this and to reach an agreement with the suing party.
Risk of trademark lawsuit
Risk of impact of employment laws and health and safety regulations
Unfavourable legal factors: low risk of trademark infringement, low risk of competitor’s patenting something before Sony does. Low risk of significant impact of changes in employment laws and health and safety regulations.
Favourable legal factors: Large portfolio of patents and trademarks to benefit from, deep pockets to deal with changes in legislations.
The firm’s legal position is favourable.
2.1.6. Environmental factors
Section deferred to appendix 1
Unfavourable environmental factors: potential risk of market failure in upcoming decades.
Favourable environmental factors: The firm is on the way to becoming a sustainable entity by 2050.
The current environmental position of the firm is generally favourable.
2.1.7. Ethical factors
Section deferred to appendix 2.
Risk of negative impact of failing to comply with CSR/ethical requirements
Unfavourable ethical factors: Significant unfavourable factors not found.
Favourable ethical factors: The firm already has a strong ethical position due to their CSR policies.
The current ethical position of the firm is general favourable.
2.2. Michael Porter’s five forces external analysis
In addition to the PESTLE analysis, we have included Michael Porter’s five forces (Harvard Business Review, 2008, pp. 23-40) to analyse the position of the firm within the industry in more detail and to determine the company’s market attractiveness (see appendix 3). This section also contains concepts taken from industrial economics – Dobbs (2005), (Lipczynski et al, 2017) and Parking (2019).
2.2.1. Threat of new entrants
Most of Sony’s segments operate in oligopolistic market structures, (industries having a few firms accounting for 70% or more of the total output). See appendix 4.
Oligopolies characterise themselves for having substantial barriers to entry. This gives the firm certain stability as firms entering the industry is not an imminent threat.
The firm has a huge infrastructure that allows it to sell to millions of people all over the world, which helps the company achieve economies of scale. The company is taking advantage of its size and technology to generate profit that is proportionally higher than the average costs of production in the long run. This is a strong barrier to entry as entering the industry would mean competing with Sony’s huge infrastructure and levels of efficiency, which would require a tremendous starting capital that would be difficult to obtain.
Another point to underline is how the company has been vertically integrating itself by mergers and acquisitions, creating synergy; ‘’the two or more units of companies to generate greater value working together than they could working apart’’ (Goold and Campbell, 1998, p, 33).
This is usually done in the search of profit maximisation and know-how. This helps firms to reduce costs between divisions (divisions operate on transfer pricing rather than buying intermediate products at higher prices in the outside market) which in turn helps to reach economies of scale and maintain constant returns to scale. As the firm owns a portion of a given industry, potential entrants may be discouraged from entering due to uncertainty when obtaining resources and accessing distribution channels.
Sony has also obtained controlling interests in companies of many different industries, which makes the firm characterise itself as a conglomerate and benefit from a well-diversified portfolio of products and services while reducing market risk.
Brand loyalty is another important barrier to entry. Advertising helps generating customer loyalty, goodwill and reputation, making people gravitate towards the firm’s products rather than the competitors’, which allows the firm to improve market position, differentiate their products and boost revenue at the expense of competitors.
Investment in research and development also creates barriers to entry as it allows the firm to control the technology that they create via patents or trademarks, avoiding the use of it by other firms. Sony has the potential to take advantage of both sustaining and disruptive innovation.
The firm could also apply a limit pricing strategy if needed as it has deep pockets and could afford doing so.
Another barrier to entry would be high learning curves. Sony specialises in the production of electronic devices and software, which are complex products and require high levels of know-how and skilled labour. Entrants are most likely to struggle going through a high learning curve while trying to compete with incumbent firms. This can potentially dry out the reserves of the entrant, leading to market failure.
Sony dominates such market share in some industries and makes products of such nature that it would take a huge investment for an entrant to compete – this involves buying huge facilities, machinery, etc. If the entrants find themselves in a situation in which they must exit the industry, they will encounter important exit barriers, due to potential illiquidity of the assets acquired.
In accordance with what has been mentioned above, one could conclude this force with the following points:
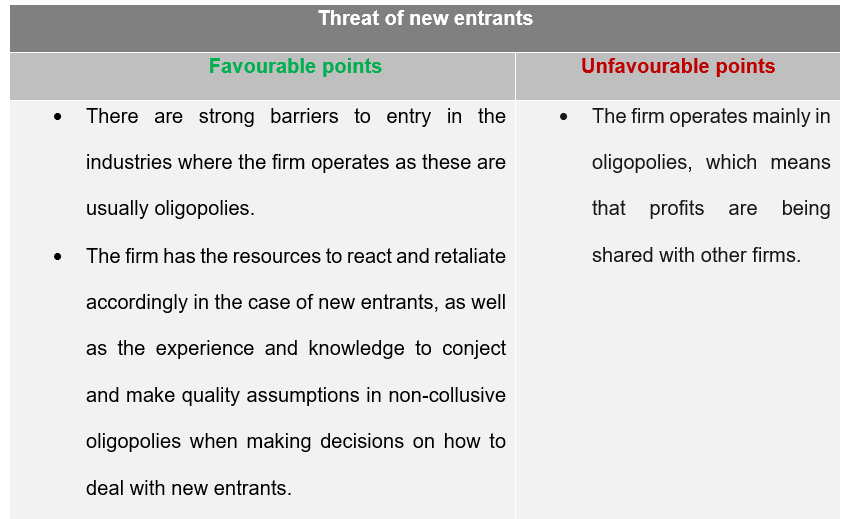
Figure 3: Threat of new entrants
The threat of new entrants is low.
2.2.2. Bargaining power of suppliers
One factor that strengthens the bargaining power of suppliers is the fact that these sell intermediate components that are critical for Sony’s devices, such as processing units and other electrical components.
Additionally, if Sony decided to buy their components from a different provider, the firm could incur high switching costs (breach of contract, increasing training costs, etc) and important inconveniences when it comes to production targets and target sales. Production could potentially be disrupted.
On the other hand, there is no high concentration of providers as there are several companies who produce processing units and other components. This means that there is little chance that providers may want to increase prices or reduce quality of their products.
Sony produces millions of units of each of its products. The firm buys in bulk what it needs to manufacture their final products and probably gets discounts for these (second degree price discrimination). No supplier would be interested in cheating on quality or price agreed as this would mean potential threat of losing Sony as a loyal, regular client. There are usually substitutes for these types of intermediate products and therefore suppliers may be most interested in keeping their contracts with Sony, significantly reducing their bargaining power.
Sony buys intermediate components to produce theirs, which means that the threat of suppliers forwardly integrating and negatively impacting the firm is weak.
In accordance with what has been mentioned above, one could conclude this force with the following points:
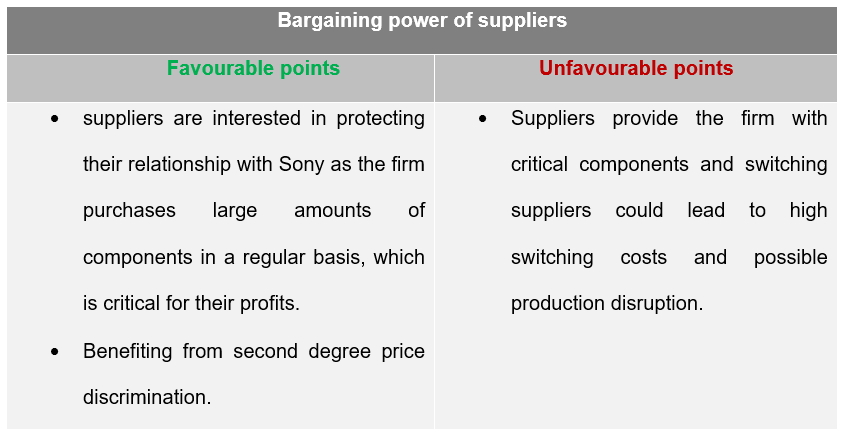
Figure 4: Bargaining power of suppliers
The bargaining power of suppliers is moderate.
2.2.3. Bargaining power of buyers
The biggest issue when it comes to bargaining power of buyers for Sony is low switching costs. Customers can easily switch to products from other brands at no cost to them.
Also, the fact that customers may have perfect information (they could know the prices of substitutes from other brands) can increase their bargaining power.
However, the bargaining power of buyers for Sony gets soothed by the following points.
As customers are not highly concentrated, there is no oligopsony – the firm has a wide portfolio of products which are being sold to hundreds of millions of people around the world. A small number of customers switching to other brands does not necessarily imply a threat to the company.
Most products are differentiated from competitors’, which also reduces bargaining power of buyers as these may prefer the differentiating features of the firm’s products to other firm’s. Horizontal product differentiation is very common in Sony’s products. Even though there are several competitors in every industry in which the firm operates, a proportionally big number of customers prefer Sony’s products as they are perceived to be of high value with a good price-quality relationship.
Sony sells products aimed to final consumers and demand of these depend entirely on the demand set by customers. No customer has real bargaining power as no one really buys one product in large volumes.
As the firm has a large portfolio of products, large differences in costs between products are rare, meaning that costs (especially fixed costs) are being easily covered even if sales of individual devices fluctuate over time.
Buyer’s profitability is not applicable as Sony sets the price of their products at levels that are affordable for most people in developed, high income countries. The company’s products sell because they are convenient, attractive, and differentiated.
It would be extremely rare to find individual customers producing their own electronic devices. This issue is not applicable to Sony, thus reducing the bargaining power of buyers further.
In accordance with what has been mentioned above, one could conclude this force with the following points:
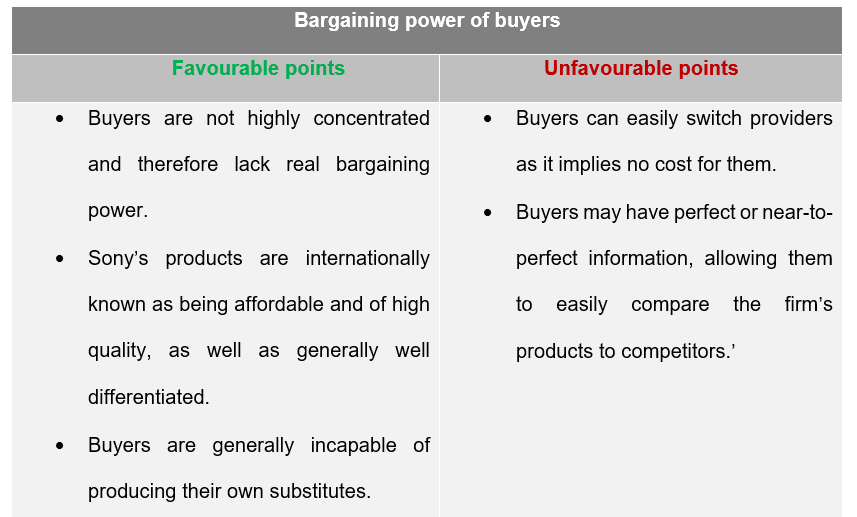
Figure 5: Bargaining power of buyers
The bargaining power of buyers is low.
2.2.4. Threat of substitutes
The threat of substitutes can widely differ depending on the segment or product we look at.
When it comes to videogame consoles, the product differentiation of the device itself (hardware, appearance) is not as important as other differentiating factors, such as the type of software (game genres) being developed for these and the amount exclusive content.
This means that, even if Sony’s consoles were somewhat more expensive than the competitors’ (or somewhat less powerful in terms of hardware), customers could still prefer to purchase the console from Sony as long as this has the content that they enjoy the most. Therefore, the cross-price elasticity of demand between consoles would be somewhat significant but certainly not definitive. The most important differentiating factor is the games that are developed for each system.
However, when we look at mobile phones or televisions, the features and characteristics of these are very similar between brands and, as these products are more homogeneous, if customers do not have a clear preference on differentiating features in Sony’s devices, they may be more likely to choose a cheaper product from other brands, which is what has been happening in the last few years. Sony’s Xperia line of phones and Bravia line of TVs have been more expensive than certain models from competitors, which has led to a significant reduction in sales as people move towards competitors’ products.
Another factor that has influenced this drop in sales is a lack of model variety. Sony has not produced enough models to compete with all the phone and TV models from other companies. This makes competitors more likely to take more of the product space and sell more.
In accordance with what has been mentioned above, one could conclude this force with the following points:
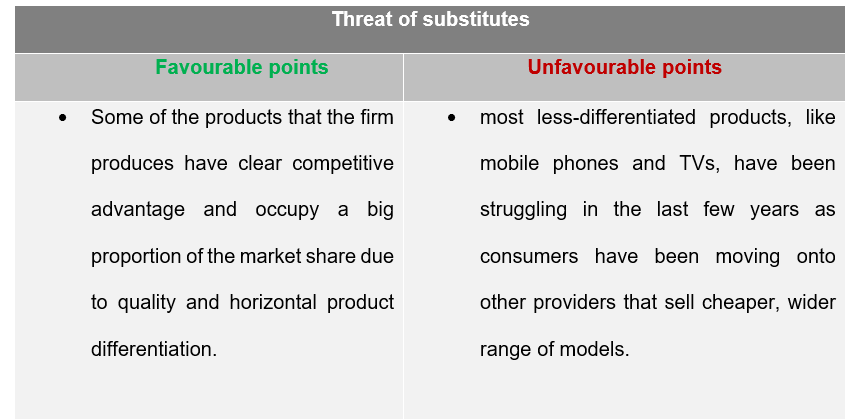
Figure 6: Threat of substitutes
The threat of substitutes is generally high.
2.2.5. Rivalry between competitors
Most of the industries where the firm operates are dominated by a small number of companies, which softens rivalry between competitors.
As most of the segments are related to electronic devices and software, the firm has its business in quickly evolving industries, which also sooths rivalry.
Sony has high fixed costs as it owns manufacturing plants in several countries and highly developed supply chains. The firm is of such size that they unavoidably incur high administration costs. This increases rivalry.
There are high barriers to exit as many of the assets the company owns are of low liquidity and most likely has contracts with suppliers that will not expire in years – Increases rivalry.
Sunk costs are relatively high as the firm spends on advertising and factory/machine maintenance in each of their production plants, which increases rivalry.
Product differentiation is common in all the company’s products. Differentiation sooths rivalry as there will be a niche of customers who prefer Sony’s products over the competitors.
All of the industries in which the firm operates, growth has reached a point in which rapid growth is no longer a possibility, which leads to more intense rivalry as competition for market share grows – although this is somewhat smoothed by product differentiation.
Overall, these factors make the rivalry between firms in the form of price wars, advertising, launching of new products and after-sales customer services, to be intense – as it is typical in oligopolies.
In accordance with what has been mentioned above, one could conclude this force with the following points:
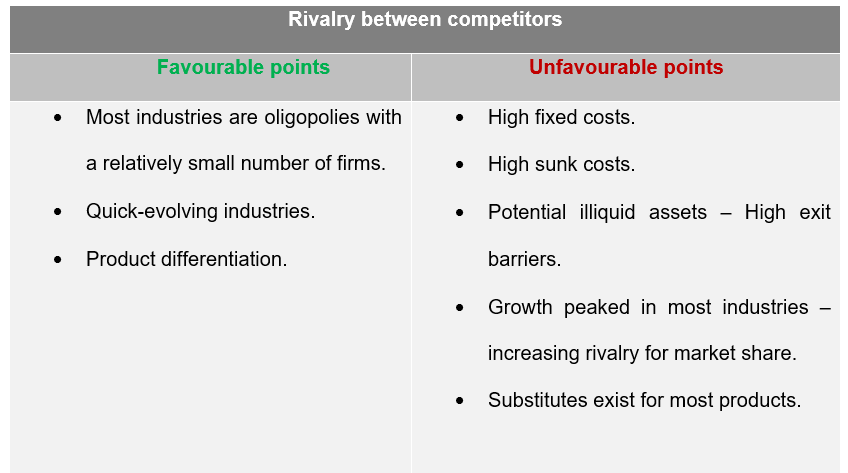
Figure 7: Rivalry between competitors
The intensity of rivalry between firms is moderate.
2.3. Chapter summary
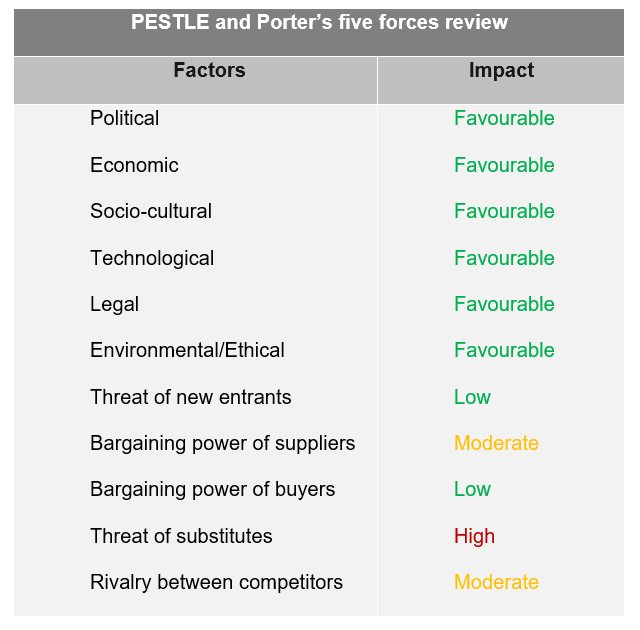
Figure 8: Main points of the external analysis
According to the macroenvironment analysis performed by PESTLE, the overall global position of the firm is favourable.
According to the industry analysis performed by Porter’s five forces, the profitability and attractiveness of the firm is moderate.
The two external analytical tools combined would imply that the firm is, overall, attractive, with most factors running on its favour and owning the necessary resources to react to virtually any potential threats.
3.Analysis of company accounts
3.1. Overall past performance
In 2012, the firm developed the ‘Transformation of Sony’ strategy, which aimed to generate more stable and steadier income (see appendix 5).
Since the firm implemented the strategy, it has seen, on average, every profitability indicator grow as most of the objectives set for the three mid-range plans have been accomplished over the years.
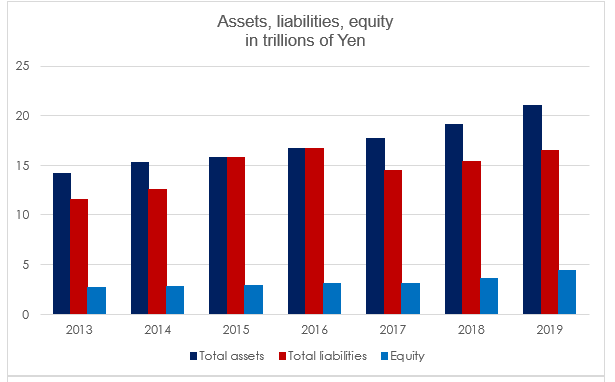
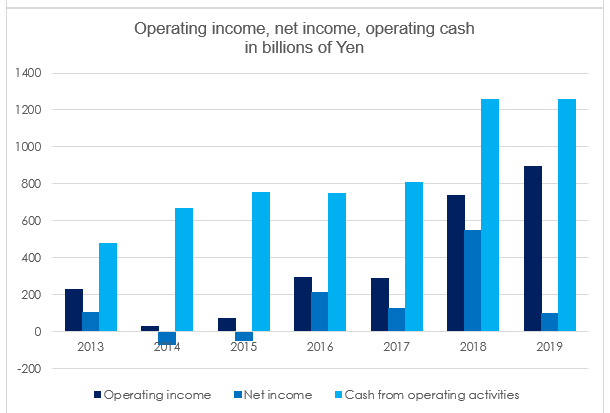
Figure 9: Assets and income. Source: Financial statements ended March 31st of respective fiscal years
As the graphs show above, the assets of the firm have been growing steadily since 2013. Despite of two years of net income loss, the company’s strategy has operated in an efficient and profitable manner, as it can be seen by the record numbers of operating income and cash from operating activities at the end of the fiscal year 2019.
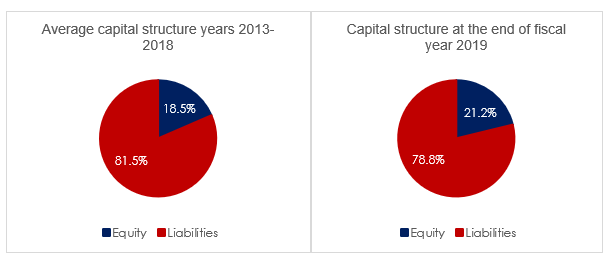
Figure 10: Past average capital structure vs end of year 2019.
Additionally, the firm has kept its assets to liabilities ratio relatively low in comparison with previous years. Even though Sony has been operating with a high proportion of liabilities over equity, equity has improved due to a boost of profit and retained earnings, as well as an increase of assets through the acquisition of subsidiaries and a reduction of costs due to divestment in the computer industry. As of the end of the fiscal year 2019, the firm’s equity was higher than the average of the previous six years, proving the effectiveness of the new strategy.
3.1.1. Common size analysis
See appendix 6, 7 and 8 for financial statements
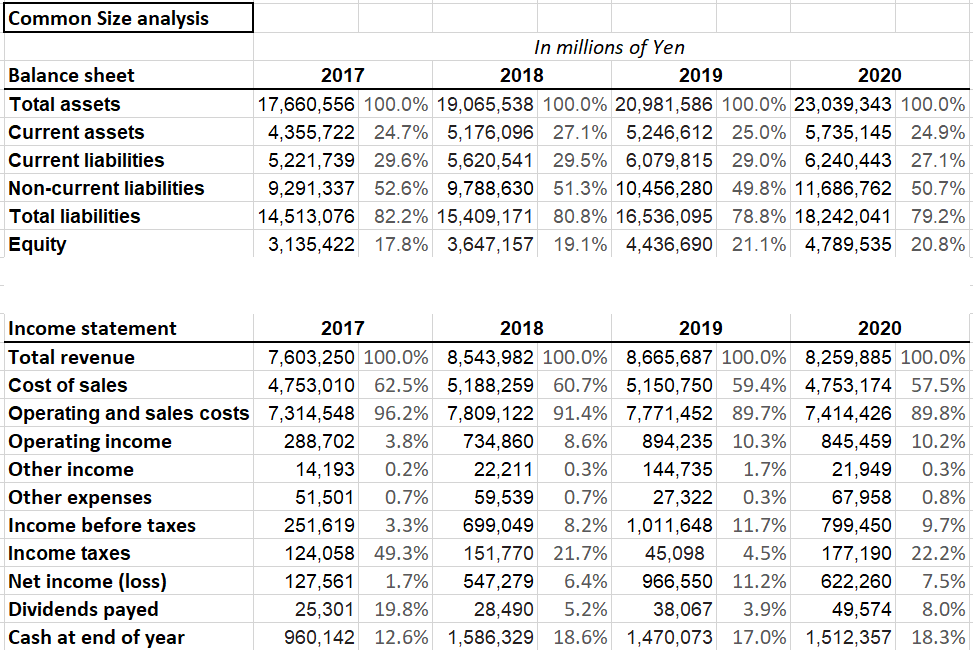
Figure 11: Common size analysis
This analysis suggests that overall, the firm has been consistently reducing their liabilities and increasing equity for the last four years (percentages in relation to total assets).
Additionally, in proportion to revenue, cost of sales has also been going down consistently while operating income and income before taxes have been overall increasing. Net income loos very volatile due to the deferral of income taxes, which seemingly makes the firm pay very different tax rates each year.
The percentage of dividends payed is in relation to net income, indicating that, even though the amount of dividend payments has been consistently increasing, the levels of net income have been increasing proportionally faster.
Cash at year end has been taken in proportion of revenue, showing that on average, cash has been increasing by 16.6% a year.
The rest of the elements shown in the income statement have been taken in proportion to revenue.
3.1.2. Trend analysis
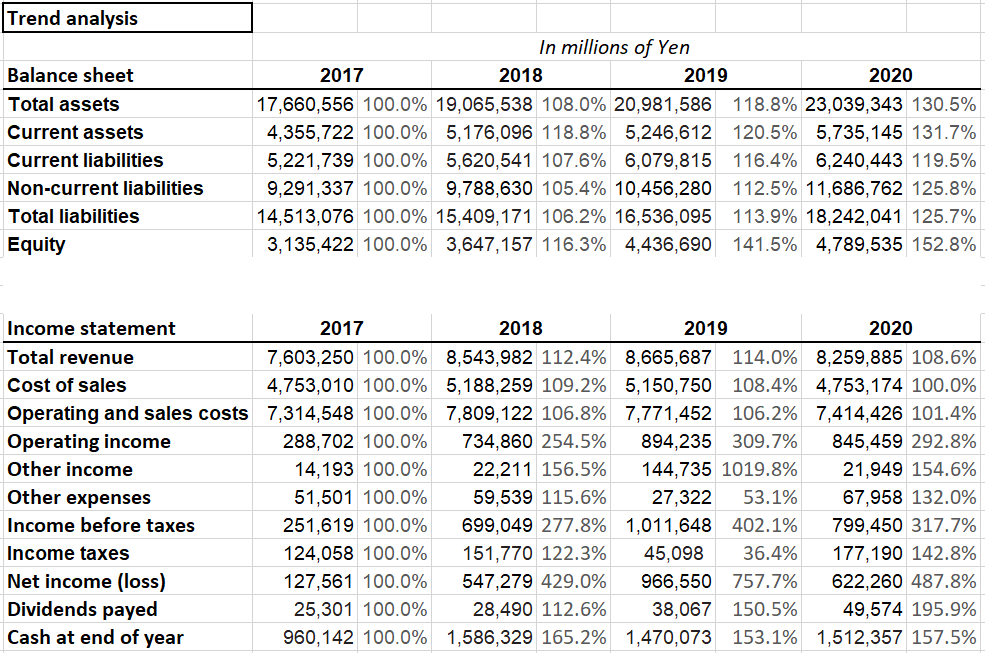
Figure 16: Trend analysis
3.2. Statement of financial position
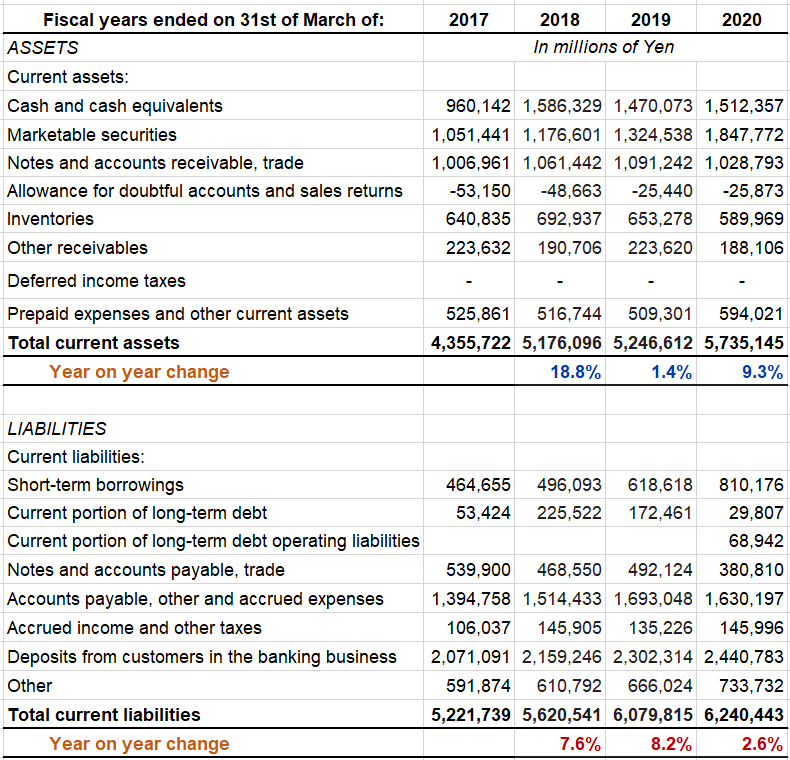
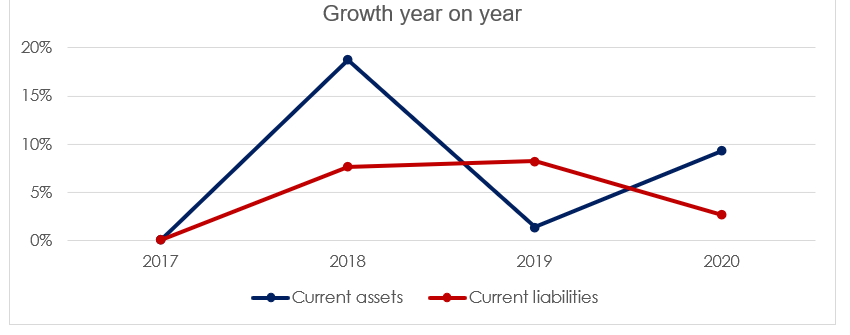
Figure 12: Current assets and YoY change
The firm has increased its current assets an average of 9.8% a year during the last three fiscal years. This is due mainly to an increase in cash and equivalents, securities, and a reduction of allowances for doubtful accounts and sales returns.
This would initially indicate that the company is selling well with returns from customers being under control. Additionally, a moderately consistent reduction in inventories and a steady reduction in accounts receivable indicates good working capital management. The current ratio was 0.8 in 2017 and increased to 0.9 in 2018, staying the same for the following two years. This increase confirms an improvement of working capital.
However, on the liabilities side, one can see that short-term borrowings and the heading named ‘other’ have significantly increased as well, pushing the growth of current liabilities an average of 6.1% a year. Even though the average growth of current assets is higher than the growth of current liabilities, the firm should work to improve working capital by reducing the averages of trade receivables and short-term debt to be more liquid and efficient. It is advisable that a current ratio of at least 1 is reached to make sure that at any given time, the current assets of the company cover for all of the short-term responsibilities at least once.
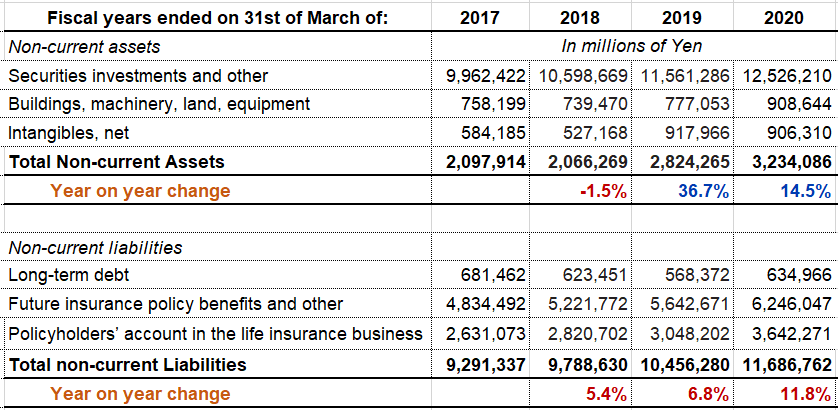
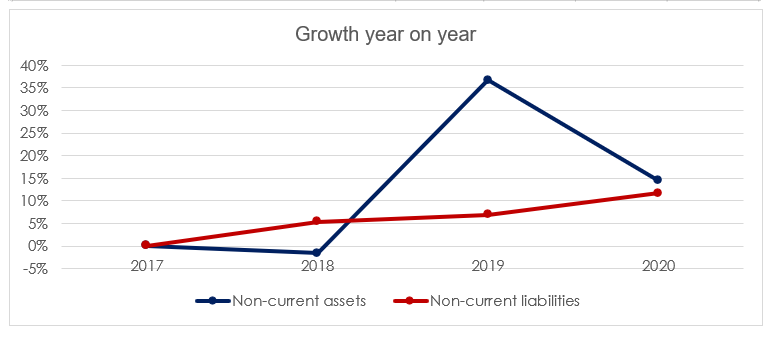
Figure 13: Non-current assets and YoY change
The image above shows the three biggest headings in each of the non-current assets and liabilities section. The totals show the actual total of each heading, non-current assets and liabilities.
Most of the non-current assets are formed by investments in securities, buildings and intangibles. Investments in securities and intangibles are providing the firm with returns. However, it should be noted that buildings and machinery have also been increasing significantly over the years, probably due to the acquisition of subsidiaries. The firm may assess whether it needs all the fixed assets that it currently owns in terms of buildings, machinery and equipment.
Overall, the company’s fixed assets have increased faster than its non-current liabilities during the past three fiscal years.
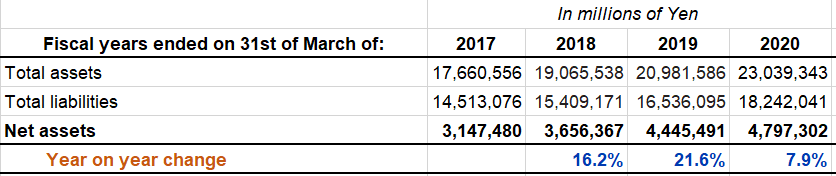
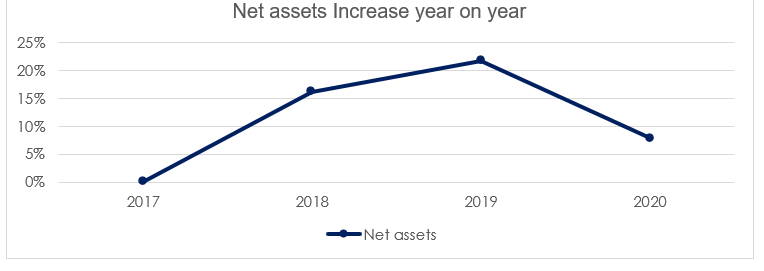
Figure 14: Net assets and YoY change
Net assets have increased an average of 15.2% a year during the last three fiscal years, which means that overall, the firm is operating efficiently – reason why the balance sheet looks strong. However, liabilities should be closely tracked as the current trend indicates that the growth of assets has been slowing down and the firm could potentially find themselves in a situation in which divesting in certain areas may be necessary to maintain a healthy financial position.
In millions of Yen
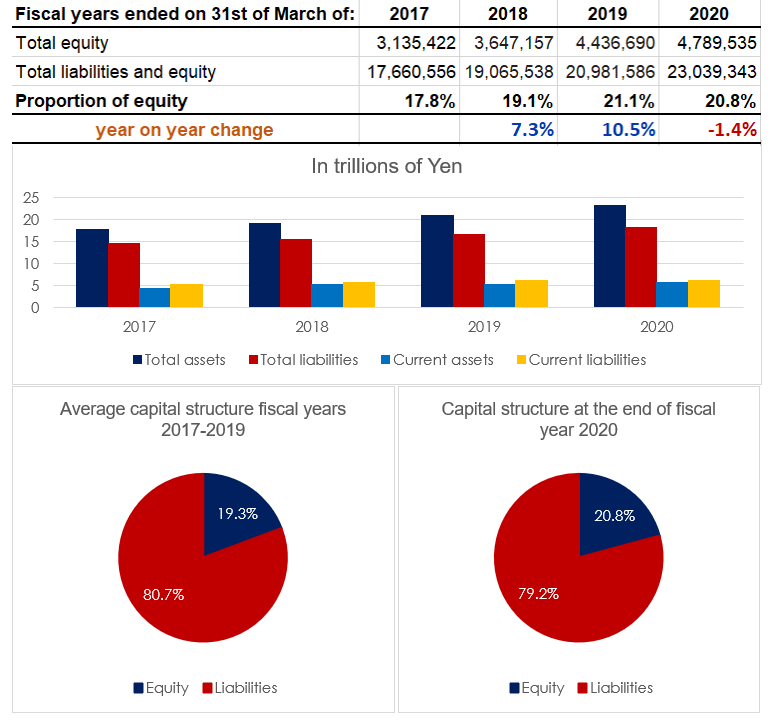
Figure 15: Assets, liabilities and capital structure
The firm has managed to keep its capital structure in the same proportion for years while increasing equity an average of 5.5% a year. This is good as it shows good asset management, especially considering that companies working in the same industries are usually highly geared. However, it is advisable to reduce the proportion of liabilities in years to come for more stability and security given any type of economic and financial environment.
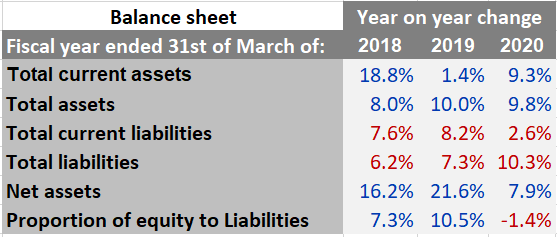
Figure 16: YoY change in assets and liabilities
3.3. Income statement
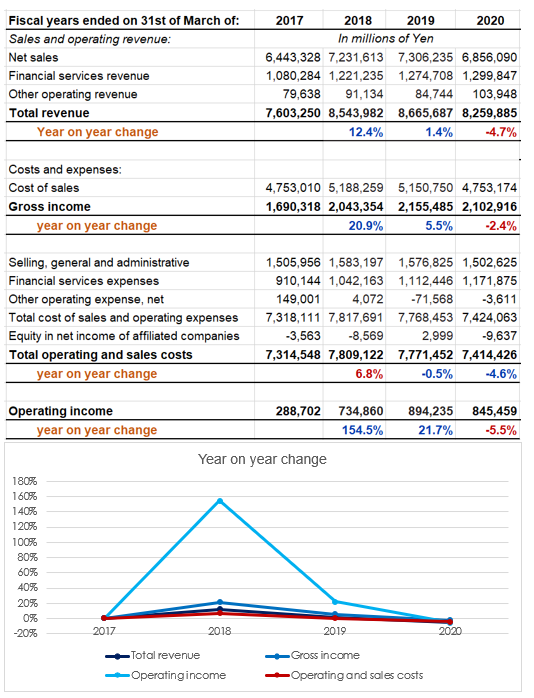
Figure 17: Income and YoY change
The most profitable segment of the firm, game and networks, pushed the levels of revenue, gross income and operating income to all-time highs in 2019 as the sales of gaming hardware reached its peak on the product life cycle. The strategy of developing more triple A, first-party software titles, also contributed to reaching this new record of profits.
The reduction in operating and sales costs of 4.6% at the end of fiscal year 2020 is consistent with the working capital improvement stated in the previous section, confirming an increase of efficiency. The reduction in size of the mobile communications division may have also contributed to lower costs during the last years.
As it stands, the gross margin is 30.7% (accounting only for net sales and cost of sales) and the operating margin is 10.2% (accounting for total revenue and total operating and sales costs).
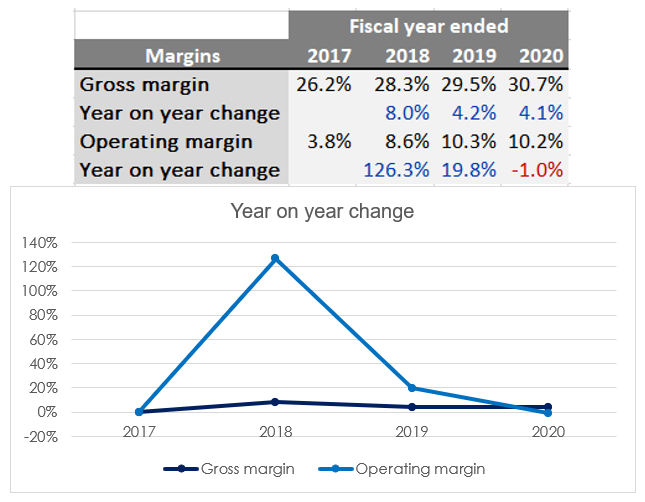
Figure 18: Gross and profit margins and YoY change
The gross margin has been consistently growing. Operating margin, on the other hand, increased considerably in 2018 and then dropped, due to a reduction in sales of gaming and communications hardware.
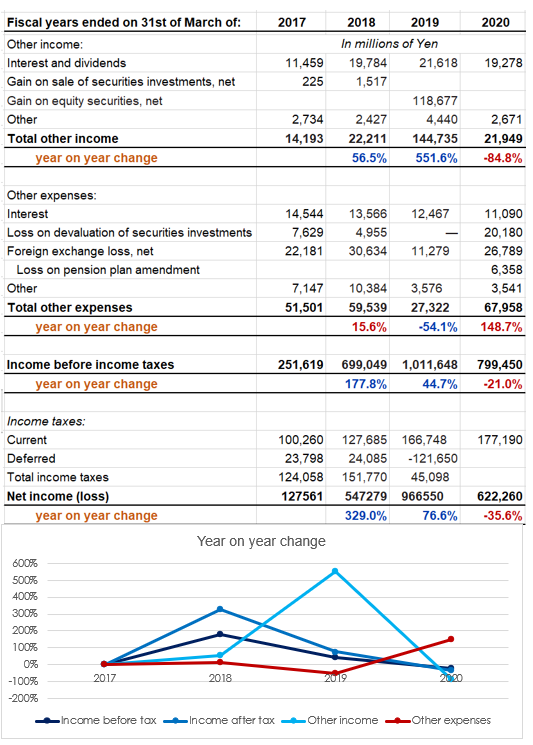
Figure 19: Net income before and after tax, other income and other expenses YoY change
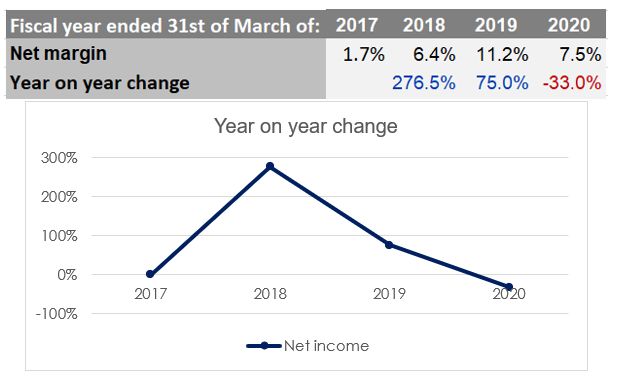
Figure 20: Net income margin YoY change
The volatility present in the net profit margin throughout the last three years is due partially to the deferral of taxes.
However, the level of net income has dropped since the previous year very significantly due to the halt in sales mentioned earlier.
Net income in following years is expected to grow as the firm introduces a new catalogue of products launching later this year that will be trading in a more favourable economic environment as the world economy starts to recover from the Covid-19 recession. In the meantime, it is advisable to keep costs to a minimum and rely on the direct to customer (DTC) services, online subscriptions and digital content as means of collecting revenue.
It is also recommended to reduce ‘other expenses’ over time as these have been practically eating up the full amount of ‘other income.’ Better hedging against currency exchange rates and losses in securities is advised.
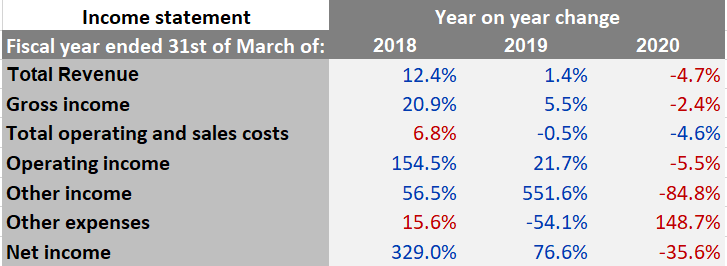
Figure 21: Revenue and income YoY change
3.4. Cashflow statement

Figure 22: Cash from operating activities YoY change
Even though the net income figure for the most recent year has dropped by 35% from the previous year, the cash inflow was 7.2% higher than the cash generated the previous year. The net profit margin of 7.5% allowed for an increase in cash despite the drop in net income, proving the ability of the firm to generate cash from their usual operating activities.
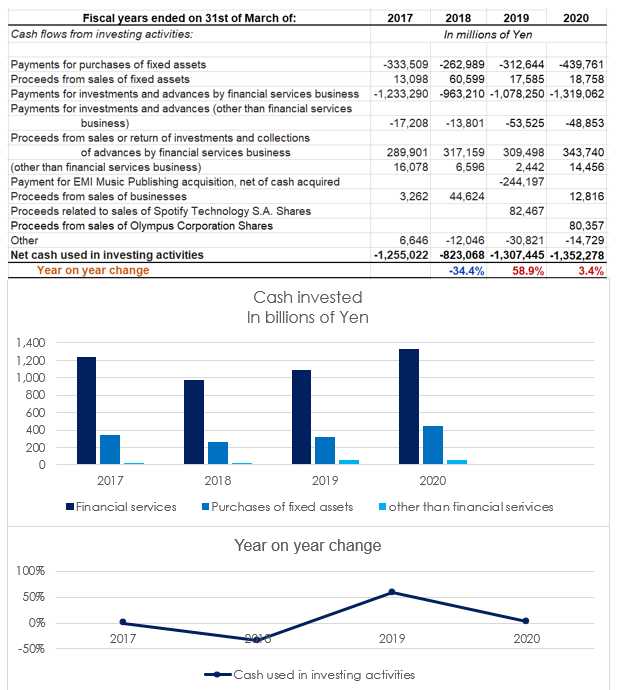
Figure 23: Cash invested
Sony characterises itself as a net investor. It recently acquired the totality of the financial services business (it owned 68% of the shares before they bought the remaining shares), as well as fixed assets through the acquisition of subsidiaries, such as EMI and independent
studios for software production. Furthermore, preparing for the launch of new products coming up later this year have pushed investment in assets other than financial services further in comparison with previous years.
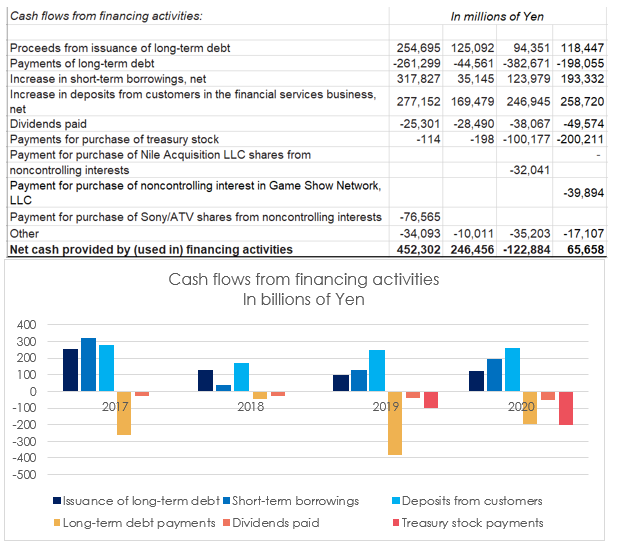
Figure 24: Cashflows from financing activities
The company has been mainly a net borrower except for the fiscal year ended 2019, where a significant increase in treasury stock, repayments of long-term debt and a significant reduction in proceeds from issuance of long-term debt, produced a negative net cash in investing activities. The firm probably used the excess cash generated in 2018 and 2019 to reduce its long-term responsibilities.
The steady increase of dividends year on year indicates that Sony has a progressive dividend policy, which also impacted the negative figure at the end of mentioned fiscal year.
This section of the cash flow statement is particularly robust given that a big part of the cash inflow comes from interests from debt sold by Sony to other companies and deposits to the financial services segment from customers. Part of these cash flows will be recorded as profit rather than cash that will need to be paid with interests in the future.
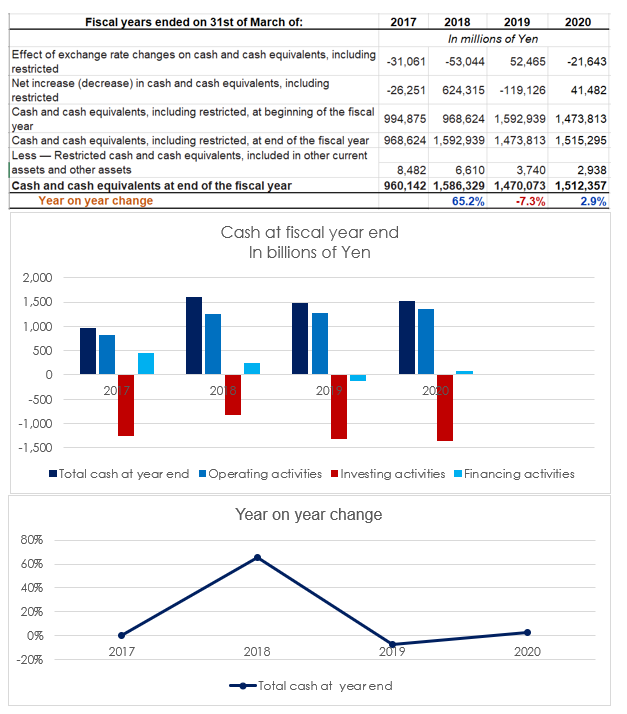
Figure 25: Total cash at fiscal year end and YoY change
The firm has been using its cash reserves wisely in terms of long-term debt repayments. The levels of cash remain stable at around the same level throughout the years despite of a decrease in revenue and operating profit.
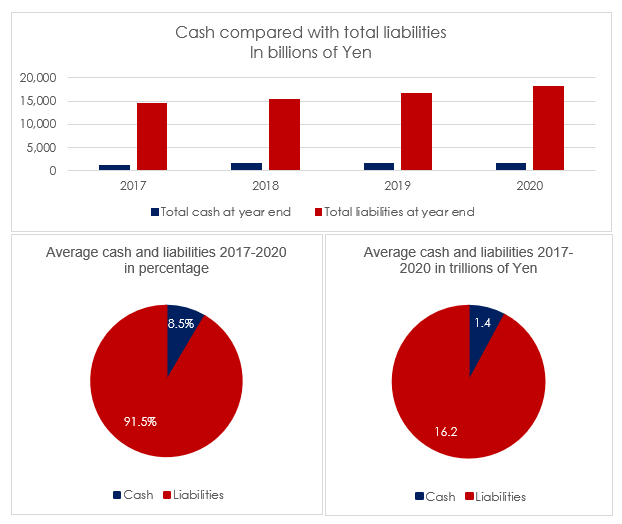
Figure 26: Total cash compared with liabilities
On the other hand, as the figures show above, the burn rate as of the end of fiscal year 2020 is 0.5 with an average of 0.55 during the past four years. Having in mind that the current ratio is barely 0.9, this could mean that the firm may face liquidity problems if they found themselves in a situation in which no income is collected, although this is indeed a very unlikely scenario.
Again, it is recommended to reduce debt and boost equity in the capital structure for a more efficient entity and higher amounts of cash reserves.
3.5. Ratio analysis
3.5.1. Profitability
Two versions of return on capital employed have been used; one uses operating income and the other one uses net income.
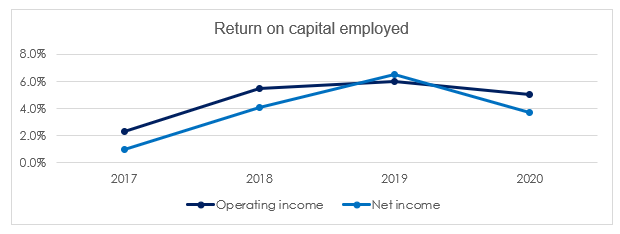
Figure 27: ROCE, net incom and operating income
The operating income ROCE shows an overall increase in return on operating activities. The net income ROCE was slightly higher in 2019 and a bit lower than in 2020 in comparison to the operating income version, reflecting the impact of other sources of income and other expenses.
For a company of the size of Sony, this level of return on capital employed is generally acceptable.
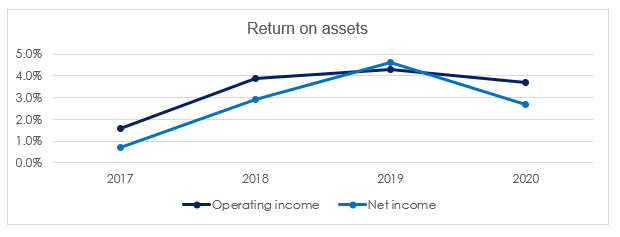
Figure 28: ROA, net income and operating income
The ROA follows a similar pattern, indicating that in the last three years, the firm has been generating a ROA of around 4% from their operating activities. The difference between operating income and net income also reflects the divestment in part of the Mobile Communications division in 2019, reducing the amount the assets of the firm and therefore pushing this indicator upwards. The drop in 2020 represents the acquisition of the totality of the shares of the financial services segment, which increased the assets of the firm, leading to a lower ROA.
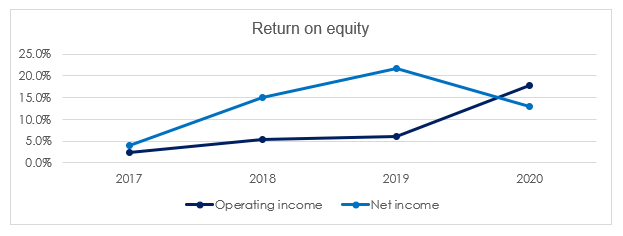
Figure 29: ROE, net income and operating income
ROE was chosen as Sony’s main profitability indicator when the third mid-range plan was executed, aiming to generate a 10% annual return. The operating income version of this profitability indicator shows an average annual return of 9.7% from 2018 (when the third mid-range plan was implemented) and the net income version shows an average annual return of 16.6% from the same date.
In terms of net income, the firm has been getting well over the 10% target. Nevertheless, it would be wise to follow the previous advice of increasing efficiency as this high level of return was obtained partially from divestments. The operating income version shows that the firm, indeed, struggled to obtain an average 10% annual return out of usual operating activities since 2018.
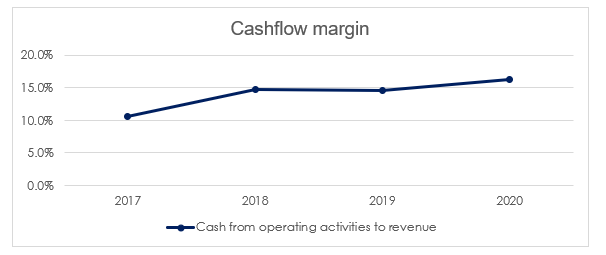
Figure 30: Cashflow margin YoY change
During the last four years, on average, the firm has generated 14 Yens in cash from operating activities for every 100 Yens or revenue, which is decent.
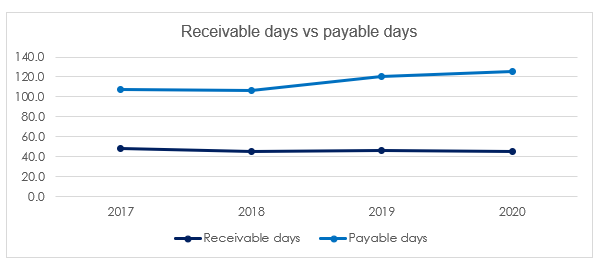
Figure 31: Receivable days vs payable days
The debtor period indicates that the company has been taking an average of 56.3 days to collect all revenue from sales on credit. On the other hand, it has taken an average of 114.7 days for the firm to pay all the money owed to providers, which is an indication of profitability and good working capital management. It also indicates that the firm has healthy business relations with its providers.
3.5.2. Debt and risk
The gearing ratio has been consistent year on year at 0.7, indicating that Sony’s non-current liabilities are 70% of equity and non-current liabilities combined, showing high levels of leverage. Even though high gearing is common in manufacturing firms, it would be advisable to have a capital structure compounded of less non-current liabilities and higher levels of equity.
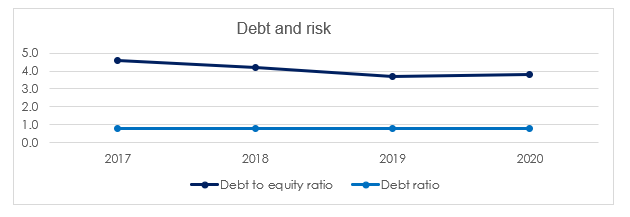
Figure 32: Debt to equity ratio over the past four years
The debt to equity ratio has been improving over time since 2017 and the debt ratio has been steady at 0.8. Still, a lower level of debt over equity would be preferable.
3.5.3. Liquidity
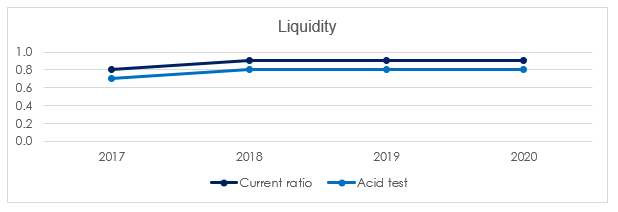
Figure 33: Current ratio vs acid test
As mentioned earlier, the current ratio has been sustaining itself at 0.9 for last three years. The acid test, a version of the current ratio that does not take into consideration inventories, is a tad lower, showing a number close to the current ratio. If the company were to stop obtaining revenue, it would be able to stay afloat for about 8 months before having liquidity problems. It is recommended, again, that the firm reaches a current ratio of at least 1, which would place the acid test ratio just slightly below 1, reducing the risk of liquidity problems.
3.5.4. Ratio and margin analysis summary
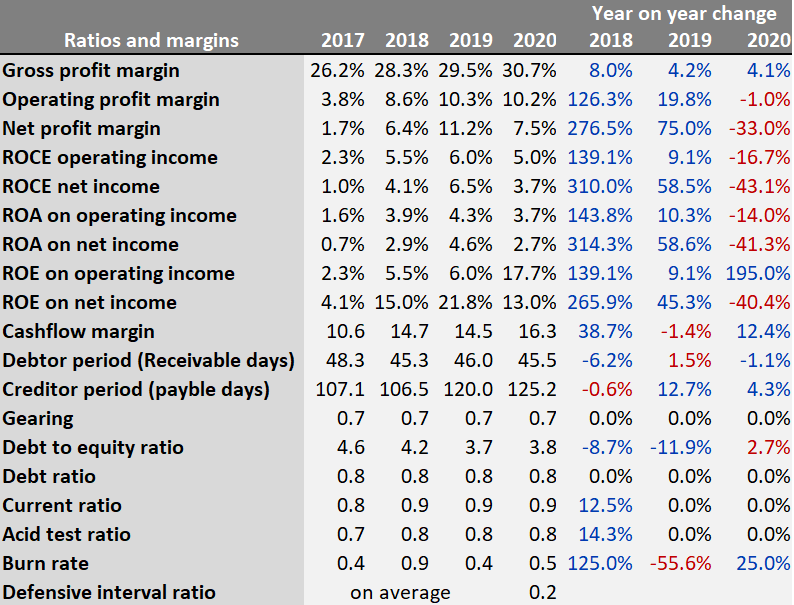
Figure 34: Ratios and margins their YoY change
The profit margins increased considerably on fiscal year end 2018 due to the Gaming & Networks segment reaching its peak on the cycle of its main line of hardware and decreased significantly on fiscal year end 2020.
Despite of this, the operating profit margin, the ROE on operating income and the cashflow margin show healthy operating activities. These indicators are expected to be improved starting the beginning of the next year as soon as the economy starts recovering from the current recession.
The firm has a good working capital rotation and good relationship with its providers.
However, the burn rate and acid test indicate that the company would encounter liquidity problems in just a few months if the firm were to stop generating income – although it is very unlikely that Sony will stop generating income.
Sony should work on ways to reduce their levels of debt to have capital compounded by less debt and more equity.
It is also recommended to have a current ratio of at least 1 to ensure proper coverage of short-term responsibilities.
3.6. Discounted Operating cashflow forecast
A net cashflow forecast has been produced to have a rough indication of the expected net cash from operating activities in the following five years, discounted by an estimated cost of capital.
The cash growth rate has been estimated by taking the average growth from the end of fiscal year 2017 to the end of fiscal year 2020.
The cost of capital has been estimated by using the Gordon dividend model (Benninga, 2011) with the dividends paid in the last twenty years to obtain the cost of equity. The average sum of short-term and long-term debt of the previous two years against the interest paid the previous year has been used to obtain the cost of debt. The average annual inflation has also been added to it (see appendix 9).
This cost of capital has been used as the discount rate for future net operating cashflows.
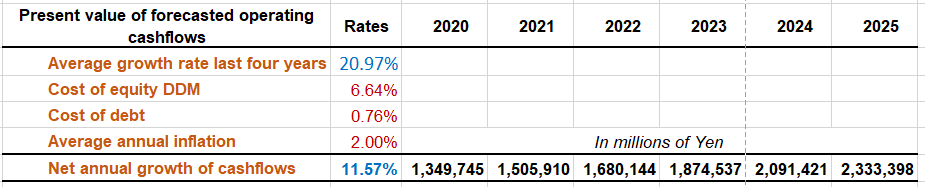
Figure 35: Present value of future operating cashflows
As the forecast presented above indicates, the cost of capital is lower than the growth rate, estimating an increase in the firm’s value of 11.57% a year.
3.7. Credit worthiness assessment
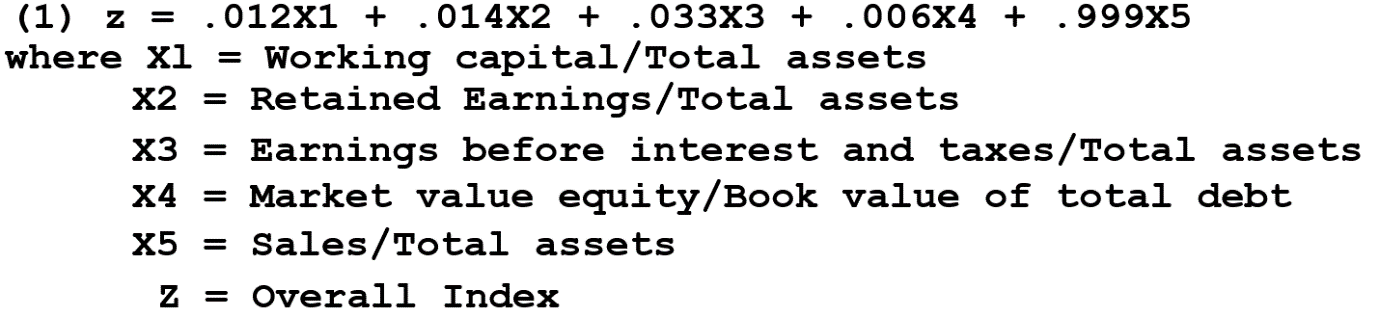
Figure 36: Altman’s credit worthiness model. Source: Altman, 1968
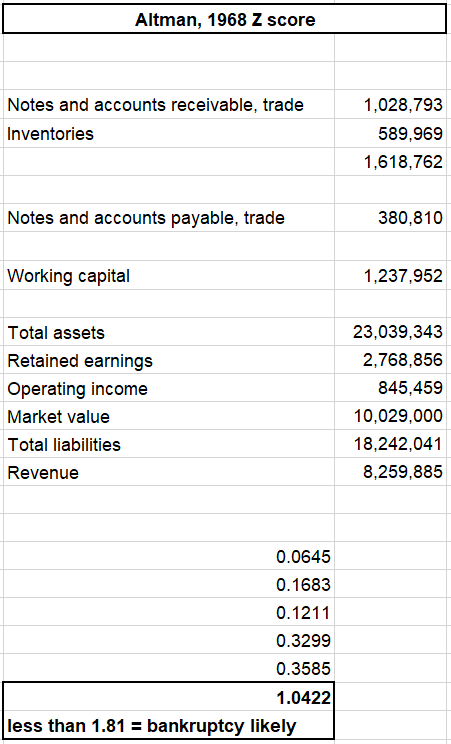
Figure 36 Sony credit worthiness assessment
According to this model, the firm is likely to go bankrupt within the next 18 months. This is understandable taking into consideration the high levels of gearing of the firm. However, the company has been running with very high levels of gearing for the last decade and it has been yielding very good return on investment for shareholders while operating very profitably.
Due to the results of this Z score, some investors may refrain from investing in the company.
The result of this test should improve annually as the firm reduces their levels of debt.
3.8. Summary of accounts analysis

Figure 37 Summary of accounts analysis
The accounts deliver a positive outlook and forecast.
3.9. Segmental information and comparison with competitors
For the purposes of this report, Samsung is the company chosen as the main competitor due to the following factors:
- Many products in common, several industries in common.
- They both have global reach.
- Fairly comparable size.
- Fairly comparable level of market capitalisation.
- Fairly comparable levels of revenue.
- Similar book value.
The US dollar will be the main currency used for all monetary comparisons except for the Gaming & Networks segment, which will be compared to Nintendo, and also uses the Japanese Yen.
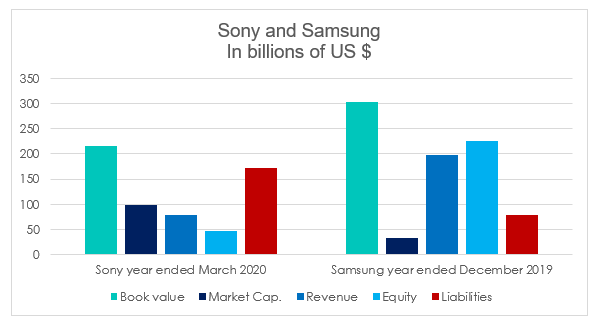
Figure 38 source: Sony and Samsung financial statements. Market Cap taken from Yahoo Finance as of 06/09/2020
The graph above gives a glimpse of the main differences between the two firms in terms of market capitalisation, revenue, and market structure.
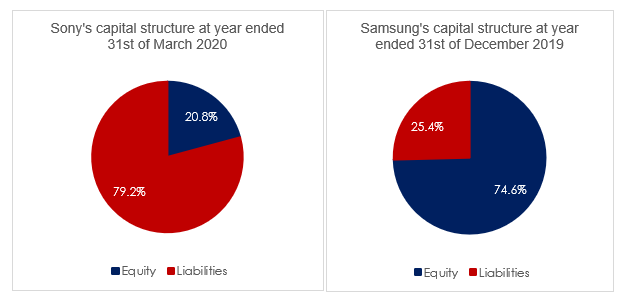
Figure 39: Comparison of Sony and Samsung capital structures
The most important difference resides in the capital structure of the entities. Sony is very heavily geared, having the majority of its structure funded by debt. On the other hand, Samsung seems very healthy in terms of gearing, as only a quarter of its structure is funded by debt (see appendices 10 and 11).
This is why it has been recommended throughout the report to find ways to operate more efficiently. Samsung’s balance sheet looks a lot stronger in this regard, making it look more financially sustainable and readier to take on any market challenges that may arise, while Sony is relatively limited in terms of opportunities that may need of investment, reducing debt being a priority.
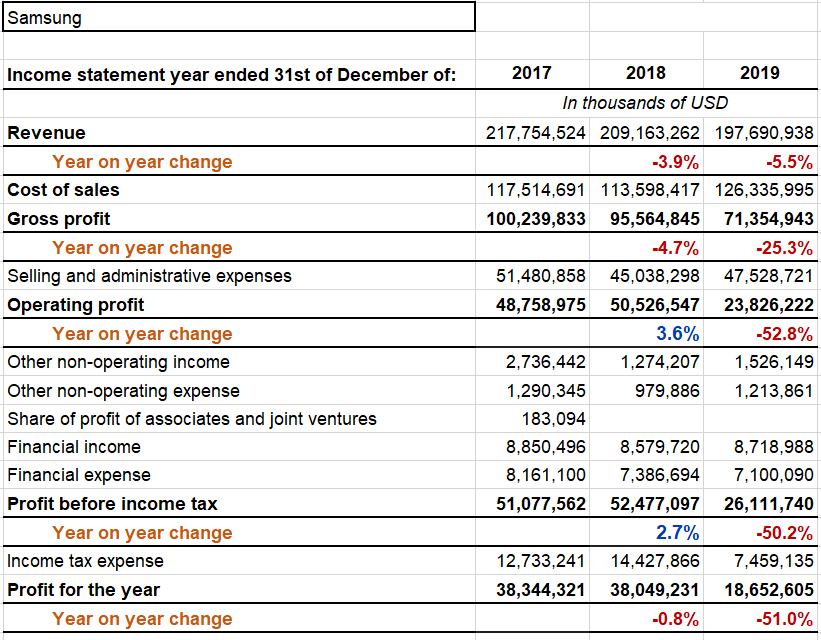
Figure 40 source: Samsung financial statements ended on 31st of December of respective years
However, Samsung’s income statement shows a few surprises. As it was shown in the income statement section, Sony’s operating and net profits went up from 2018 to 2019 and down by 5.5% and 35% respectively during the last year. On the other hand, Samsung seems to have been hit badly as most indicators show diminished returns during both years, reaching drops of up to 52.8%.
The reason for this difference in performance during the last year may be due to the Covid-19 pandemic. Sony managed to get relatively higher returns during the same period as they exploited their DTC services, selling digital content online. Samsung’s returns depend entirely on customers going outside and purchasing goods. The restrictions imposed by governments are not helping Samsung boost their income streams.
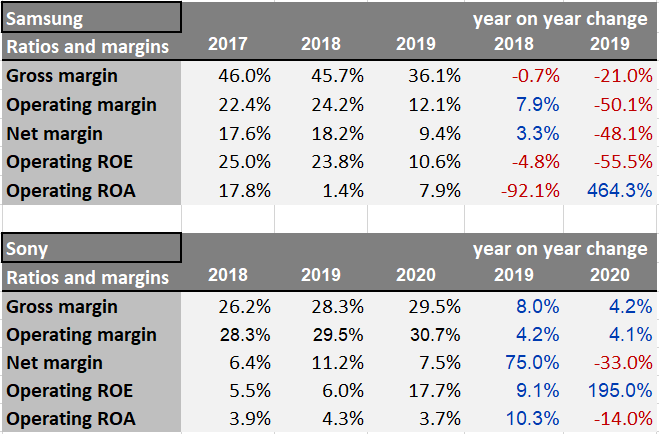
Figure 41: Comparison of Sony and Samsung ratios and margins
The table above shows that overall, Samsung has been generating higher gross and net income margins, as well as higher returns on assets and equity. Sony wins when it comes to operating income, featuring higher numbers in proportion to revenue, which may indicate lower cost of sales and lower operating expenses than its competitor. However, Sony does feature lower net income margins. Extra expenses are reducing total profits, leading to lower profits than Samsung.
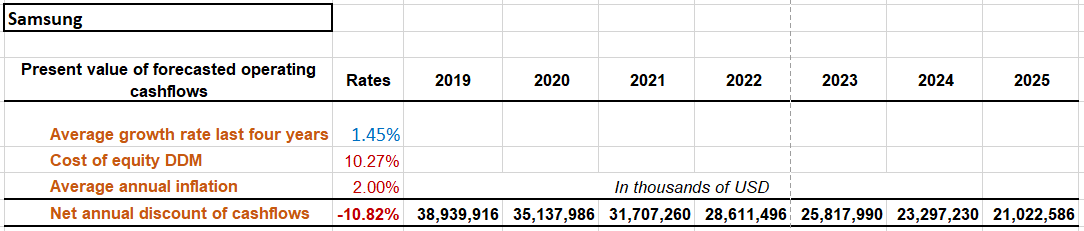
Figure 42: Present value of Samsung future operating cash inflows
According to the cashflow forecast, Sony has a clear advantage over Samsung. During the period 2016-2019, Samsung had an average annual growth of cash inflows of 1.45%, way lower than the rate of growth for Sony’s cashflows. The considerable reduction in cashflows in 2019 led to a very significant shrinkage of the average.
Additionally, the cost of equity seems to be higher as well. Notice that the cost of debt has not been included in Samsung’s cost of capital calculation and it still makes the company’s cashflows deteriorate over time.
One would need to note that this forecast if not entirely relevant as commencing 2021 an economic recovery may boost Samsung’s cashflows, but this also means that it would also increase Sony’s. The cashflow forecast of both companies indicate that Sony will start the next fiscal year from a relative position of advantage over Samsung in terms of how much the value of the company is expected to grow in upcoming years.
3.9.1. Sony’s Segment performance overview
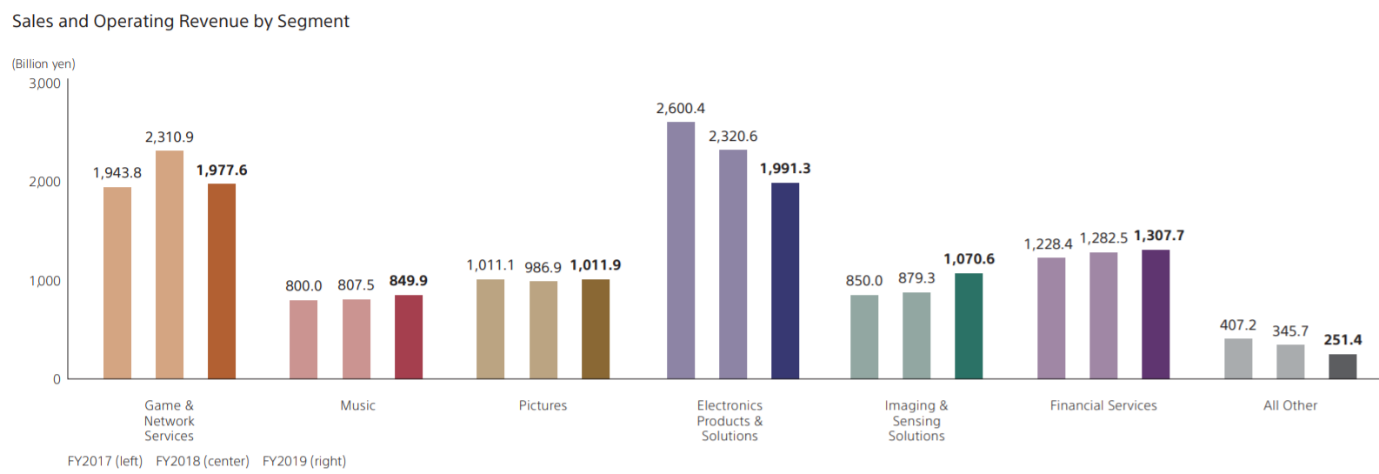
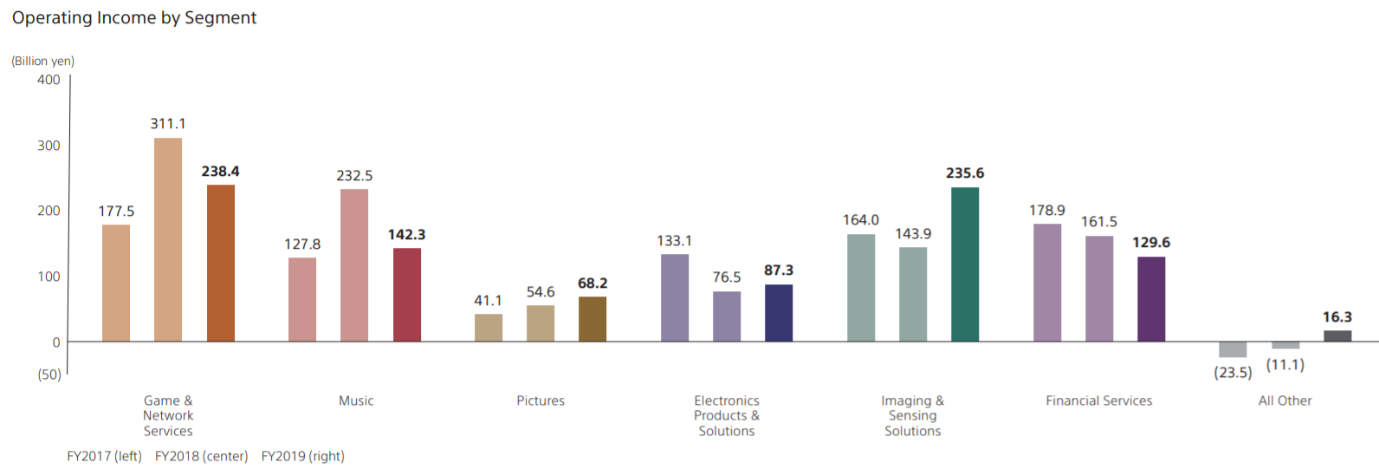
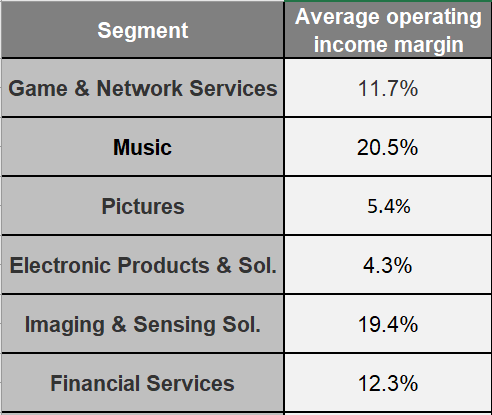
Figure 43: Sony’s segments revenue and operating income
See appendices 12 and 13
One can easily see the impact of the Game & Network Services in terms of revenue and operating income in comparison to all other segments.
Imaging & Sensing Solutions has also been growing in importance as the demand for CMOs and high definition image detectors are growing in popularity.
In terms of efficiency, Imaging and Sensing Solutions and Music offer the highest level of operating income in relation to their level of revenue, showing Electronic Products and Solutions as the most inefficient segment, as it is expected due to the fact that it is manufacturing-based and it has also been absorbing the losses generated by Mobile Communications division.
Game & Network services has an acceptable level of efficiency, also being the segment that has generated the highest amounts of revenue and operating income for the company, making it the most important segment.
Special attention may be needed in the Pictures segment as higher levels of efficiency are recommended.
3.9.2. Game & Network Services
As Samsung does not operate in the videogame industry, the most direct competitor chosen for this segment is Nintendo, as it is one of the three companies operating in this global oligopoly.
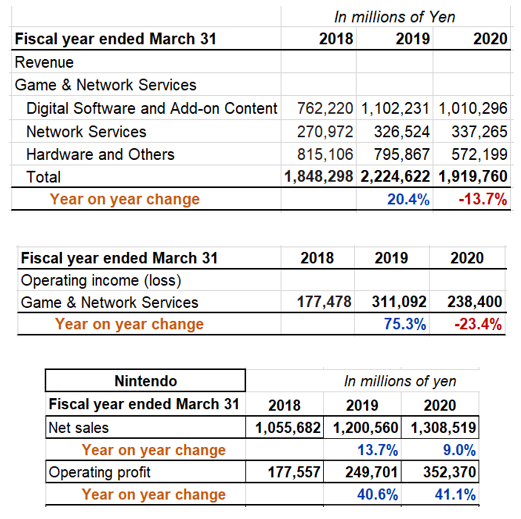
Figure 44: Source: Sony financial statements fiscal year ended on 31st of March of 2019 and 2020.
Nintendo’s financial statements fiscal year ended on 31st of March of 2019 and 2020.
In comparison to one of Sony’s main competitors in this industry, Nintendo has been generating a higher amount of operating profit in relation to revenue (see appendix 14).
However, it needs to be said that the differentiating factor of Sony’s videogame consoles is that they always strive to use the latest technology available every time a console goes under production. Alternatively, Nintendo bets for more affordable and less powerful hardware, reason why the levels of operating profit are proportionally higher. Sony incurs higher amounts of overheads and investment with every piece or hardware released.
At the same time, releasing more powerful hardware implies that it will be more expensive to produce software.
In other words, Nintendo benefits from lower total costs and Sony benefits from pushing boundaries.
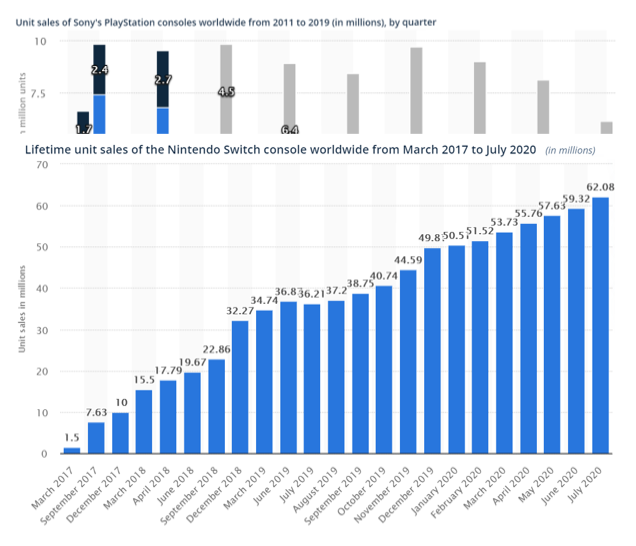
Figure 45: Unit sales of hardware. Source: Statista.com
The graphs above show the number of PS4 and Switch hardware shipped by the millions throughout the years. Sony keeps its dominance in the market having sold over 112 million units of their latest console by the end of fiscal year 2020.
However, it needs to be underlined that Nintendo has been a formidable competitor as it has adapted remarkably well by the challenges set by the industry. If we look at the graphs closely, one will notice that, despite of Sony selling double the units of hardware, Nintendo has been selling theirs faster. PS4 was released in late 2013 whereas Switch was released in early 2017, showing that Nintendo has operated with its latest piece hardware during a shorter period.
During the past two generations of game consoles, Nintendo has shown how capable it is of, at least momentarily, stealing a significant proportion of the market share from the most dominant brands, even selling relatively weak hardware. This is due to their main differentiating factor – innovation in the way that players experience content.
Sony, however, has a tremendous opportunity in this field if they exploit their virtual reality headset with the upcoming generation later this year, offering virtual and augmented reality content.
Additionally, Sony attributes the drop of revenue and operating income year on year to Covid-19 and unfavourable exchange rates. Nevertheless, Nintendo has had a remarkable year on year operating growth of 41.1% during the same period. It may be worth to investigate further and try to understand where such a significant difference in performance during the year comes from.
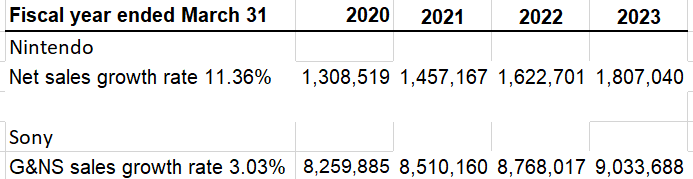
Figure 46: Sales forecast
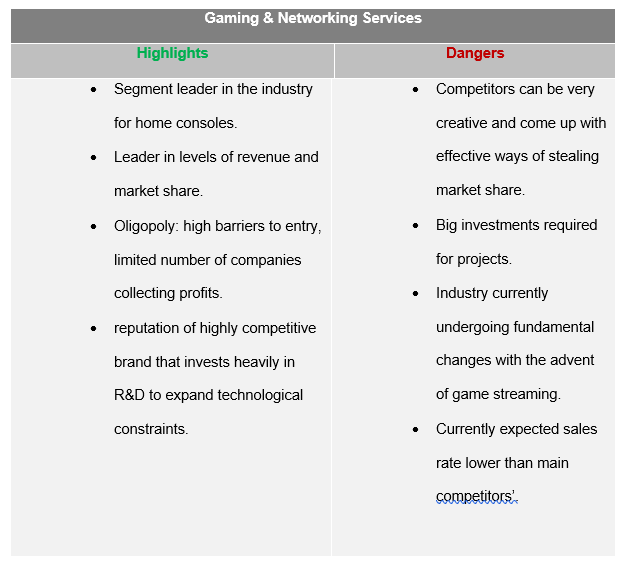
Figure 47: Game and Network Services summary
This segment contributes positively to the company’s profits and status.
3.9.3 Electronic Products and Solutions
This segment is compounded of several divisions and, even though it is being overall profitable, in order to have a more accurate insight, we shall look at the divisions that require the most attention.
3.9.3.1. Home Entertainment
Sony used to be the market TV leader in the industry until the transition to LCD screens started back in the middle 2000s.
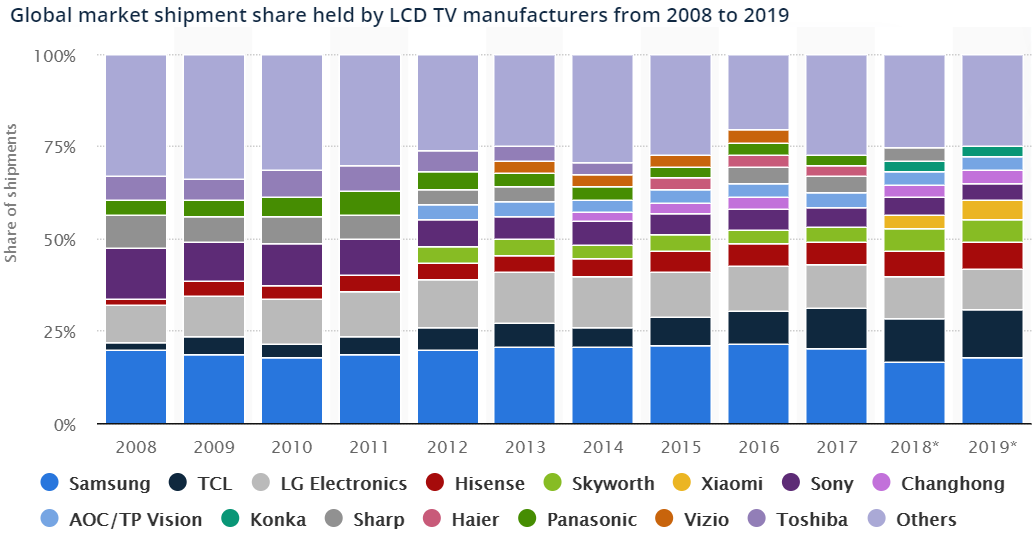
Figure 48: Source: Statista.com
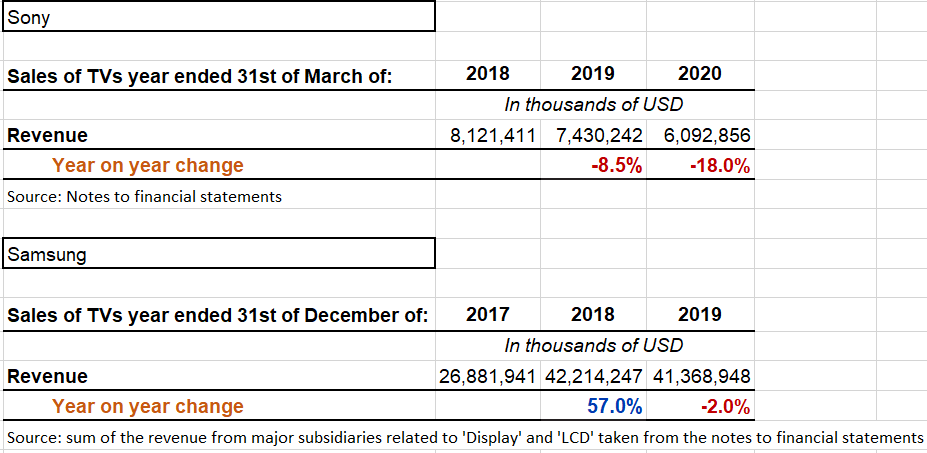
Figure 49: Home entertainment revenue against Samsung’s YoY change
The current relatively small market share in comparison with companies like Samsung or LG reflects the decisions that the firm made over the past decade when it came to the production of televisions.
Deciding to buy most components from providers instead of investing in creating their own sets from scratch, eventually became relatively unprofitable. Sony bought TV sets from other companies, which only contributed to higher prices in the retail sector.
When TV manufacturers reached economies of scale, they started to create their own brands, selling very competitive sets at lower prices.
This only exacerbated the situation when many companies appeared selling many different cheap models, which filled the market space with a considerably big catalogue of TVs, most of them being cheaper than Sony’s.
Samsung invested in production of LCD and OLED screens, which allowed them to sell their sets at lower prices. Also, Samsung has been spending more in advertising their televisions. It is a well-known economic phenomenon that the more a product is advertised, the more desirable it becomes. Customers have a wide range of TVs from different brands to choose from at more competitive prices.
Therefore, the firm targets higher classes who are willing to pay a premium, but the fact of the matter is that the shipment of TVs has been shrinking since 2008. Adding differentiating features linked to gaming could mean a boost in sales, since the Game & Networks is the biggest segment. Sony’s 4K TVs are a good start. However, given the circumstances, more should be done to recover some of the lost market share (ie, release a wider range of more affordable sets, make exclusive features for the PS5).
3.9.3.2. Mobile Communications
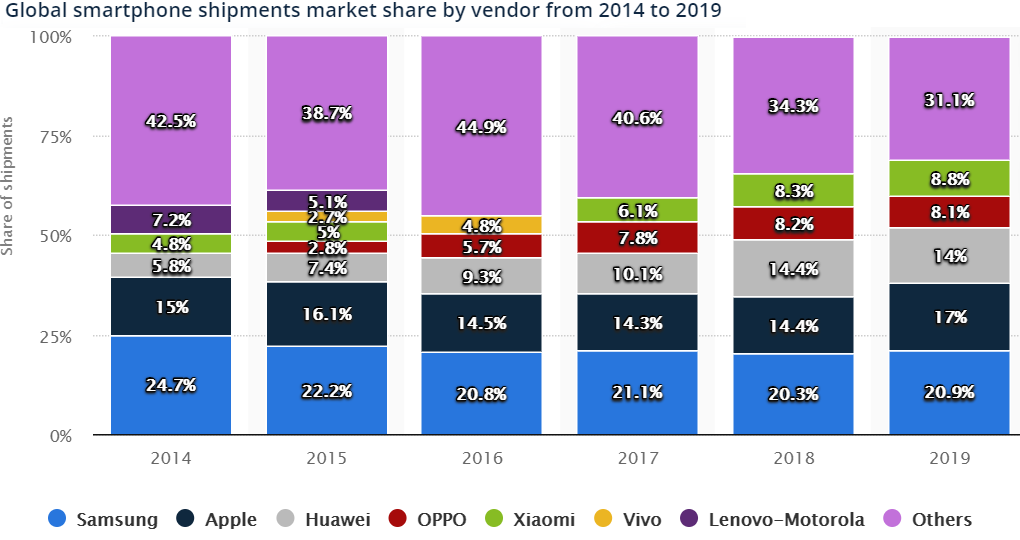
Figure 50: Shipment of mobile phones by vendor. Source: Statista.com
The mobile phone industry has been obtaining lower profits year on year for four years now. Things are worse for Sony in this field as it has been generating losses for the past three years.
As the Mobile Communications division stopped meeting the IFRS 8 requirements to be disclosed as a segment (appendix), Sony conveniently included it as part of the Electronic Products & Solutions segment, camouflaging the losses in this division.
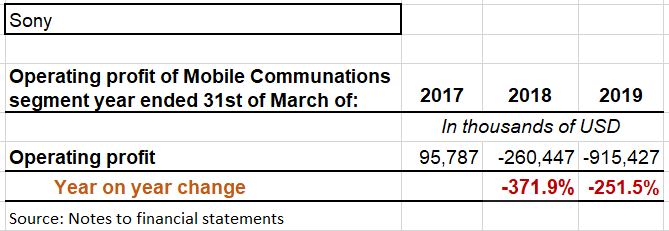
Figure 51: Mobile Communications division’s losses
The problems are caused once again by a small catalogue of models, high prices and a lack of advertising.
However, there is hope for this division as the currently settling 5G technology is expected to revive the mobile phone industry with devices that will revolutionise the industry, taking advantage of the Internet of Things (IoT).
3.9.3.3. Segment summary
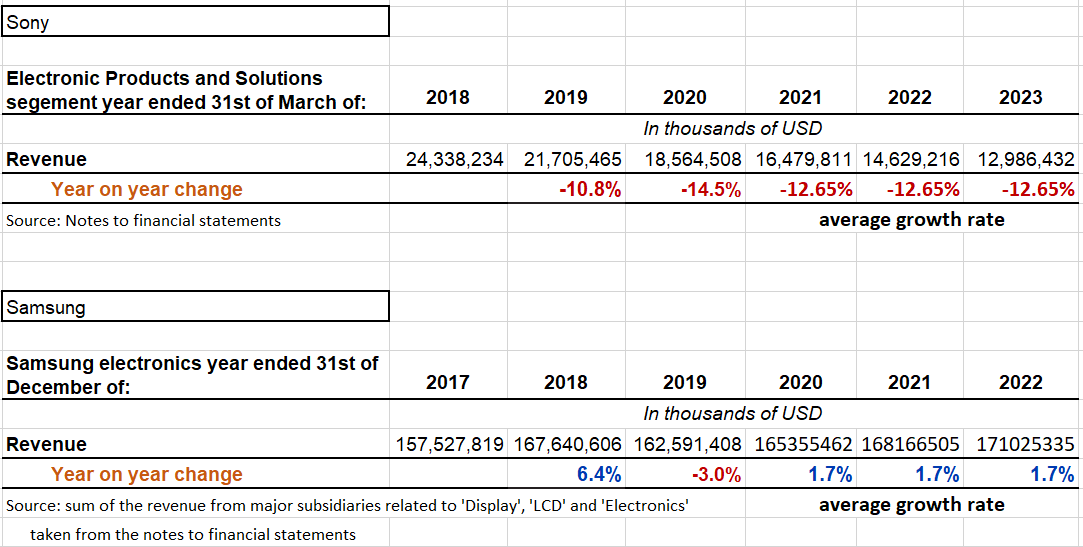
Figure 52: EP&S and Samsung’s revenue forecast
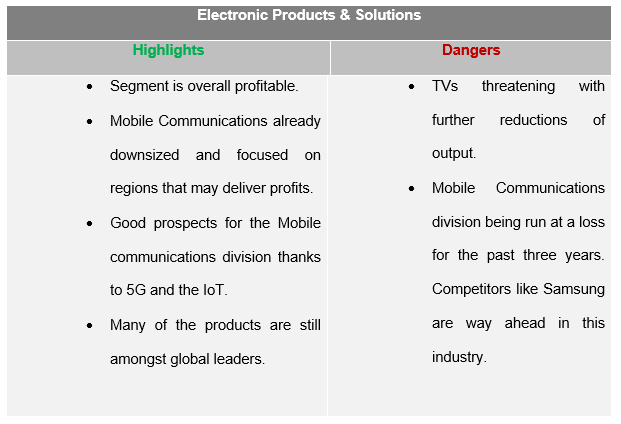
Figure 53: EP&S Summary
Overall, this segment contributes moderately to the company’s profits and status.
3.9.4. Pictures
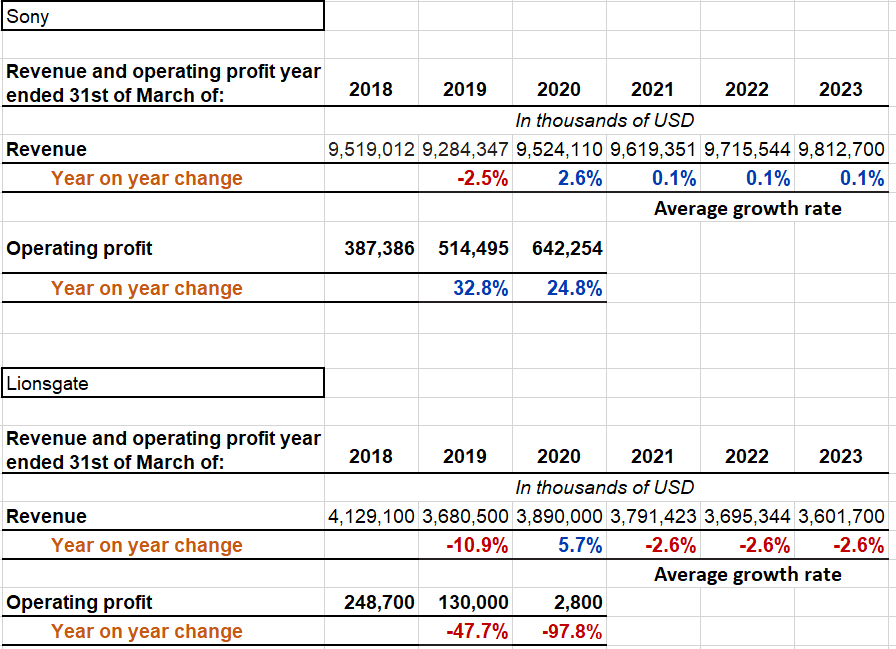
Figure 54: Pictures segment and Lionsgate revenue and operating income, with revenue forecast
Sony is one of the companies leading the global picture and televisions industries. The table above compares the revenue and operating profit generated during the past three fiscal years comparing it with that of one of the firm’s competitors, Lionsgate.
Relatively speaking, Sony has had it easy if one considers the considerable increase of operating costs that Lionsgate has been incurring in the last three years (their income statement reports net losses).
The picture segment was needing of a reform to make it operate more efficiently. The profit is very low in relation to revenue and operating income, but so Lionsgate is. Considering that Lionsgate is also one of the leading firms, It is understood that the picture industry has high levels of overheads and operating expenses.
Nevertheless, the firm has been increasing the proportion of operating income over revenue, which means that Sony’s efforts have been worthwhile. Still, further efficiency is desirable.
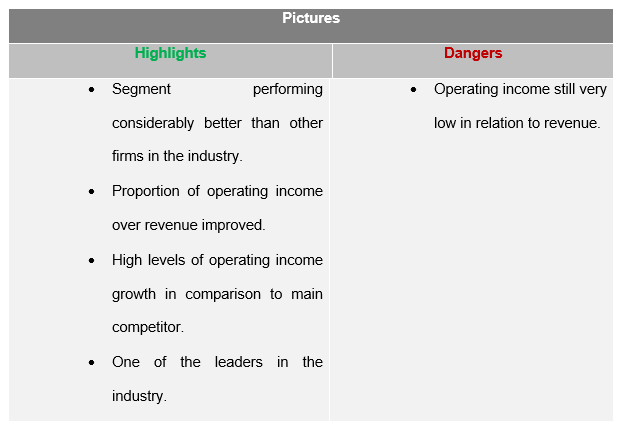
Figure 55: Pictures segment summary
This segment contributes positively to the company’s profits and status.
3.9.5. Music
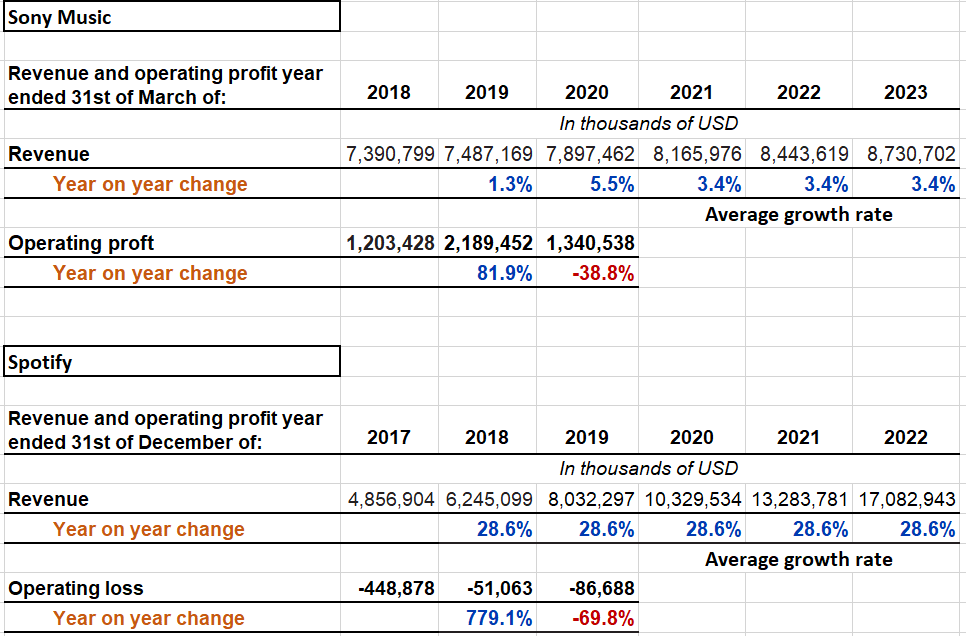
Figure 56: Music segment and Spotify’s revenue and operating income with revenue forecast
Spotify has been sustained by investors for years. Sony has the upper hand as it generates very attractive profits. It is unclear how a company like Spotify can be run at these loses for such a sustained period, but it is safe to say that Sony music is in a position of advantage.
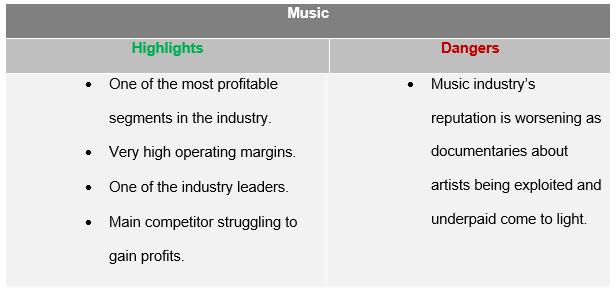
Figure 57: Music segment summary
This segment contributes positively to the company’s profits and status.
4.Investment analysis
This section has been deferred to appendix 15.
4.1. CAPM related measures
The capital asset pricing model (CAPM) is used to determine the return (or cost of equity) of a security in relation to its systematic risk. In this section, we are using CAPM related measures to analyse expected and abnormal returns on the firm’s shares. The content in this section has been written using Body (2014), EDHEC (2008) and The Hedge Fund Journal (2008) as reference.
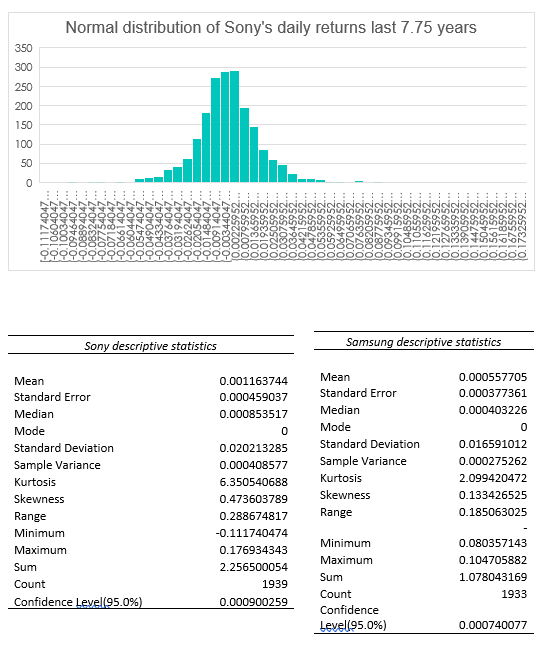
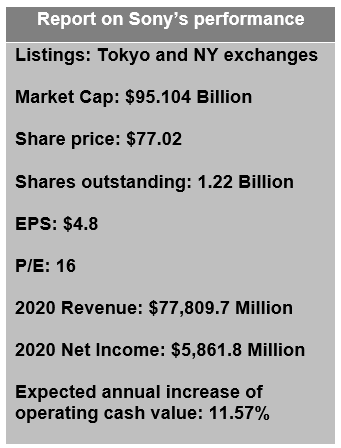
4.1.1. Security market line and return to systematic risk
The risk-free rate will be the annual return on 10-year US treasury bonds of 0.74% as of the 4th of September this year. We will use the average annual return on the NYSE composite index for the last 7.75 years (from November 2012 to July 2020, taken from the daily close of each trading day during the period) as our return on the market.
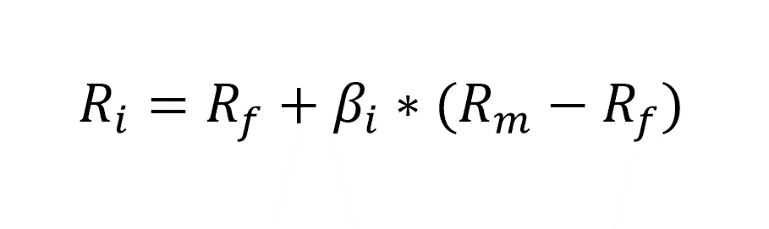
0.0074+1x(0.0651-0.0074)=6.51%.
As the CAPM model suggests, the expected return on the security for next year equals to 6.51%. It is the same return as the NYSE composite index since the beta is the same, therefore the security moves alongside the market. For every unit of market risk that moves up or down, Sony shares follow.
It would be represented on a diagram as follows:
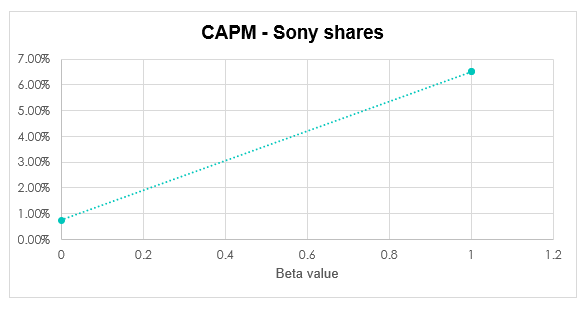
Figure 58: Expected return on Sony shares using CAPM
We can see how Sony’s shares fall exactly on the same point on the SML (the greenish coloured line) as the market index. This means that investors would consider buying Sony’s shares because the level of risk-reward is the same as that for the market index. According to CAPM, this is an efficient security.
4.3.2. Jensen’s Alpha and excess returns
However, for the last 4 years, Sony shares have grown by an average of 29.12% a year.
This means that this last year, we have seen an unexpected excess return of 22.61%. Using Jensen’s Alpha on CAPM:
0.2912-[0.0074+1x(0.0651-0.0074)]= 22.61%
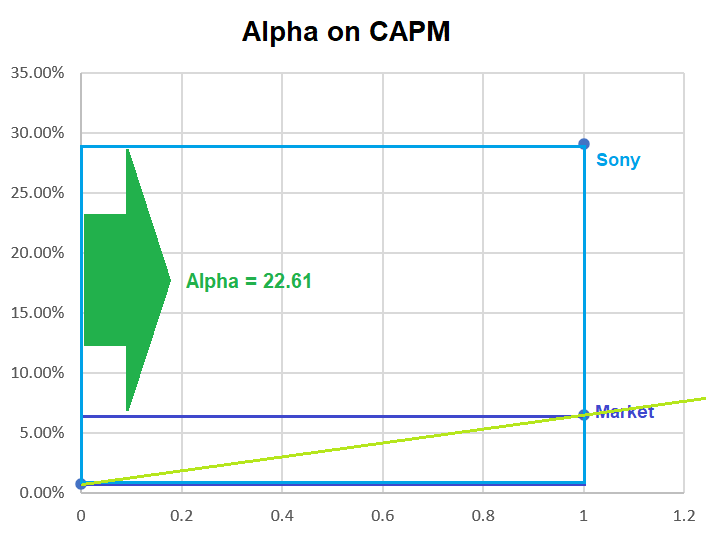
Figure 59: Excess return on Sony shares, Jensen’s Alpha
To investors using the CAPM to decide what shares to invest in, Sony’s equity has grown off the charts, realising an annual unexpected excess return of 22.61%. According to CAPM, the shares are placed way above the SML, meaning that as shares are not efficient, investors should refrain from investing as the unexpected returns may end up realising loses later on.
However, the shares have been yielding these returns for such a long time that it would be unreasonable to think that CAPM is being constant. There must be factors that the model is not considering that have been pushing the share price further upwards.
One obvious factor would be market sentiment. Institutional investors may have been aware of the possibilities for growth in the company in 2012, buying shares in bulk and therefore pushing the price forward. Retail investors joined in after them, lifting the shares further.
This market sentiment may have been boosted by stimulus packages and an economic recovery after the 2008 credit crunch.
As we stated in the PESTLE analysis earlier in this report, Sony’s revenue is correlated with the GDP movements of developed countries, with a correlation coefficient of 0.85. If one had forecasted Sony’s return on equity shareholders of 6.51% for the year 2019 and also forecasted that the GDP growth was going to be 4%, this could have been added to the expected return (0.0651+(0.04×0.85)) = 9.91%. This adjustment would have made a slightly more accurate prediction and would have reduced the value of the unexplained alpha return.
4.3.3. The Treynor and Treynor squared measures
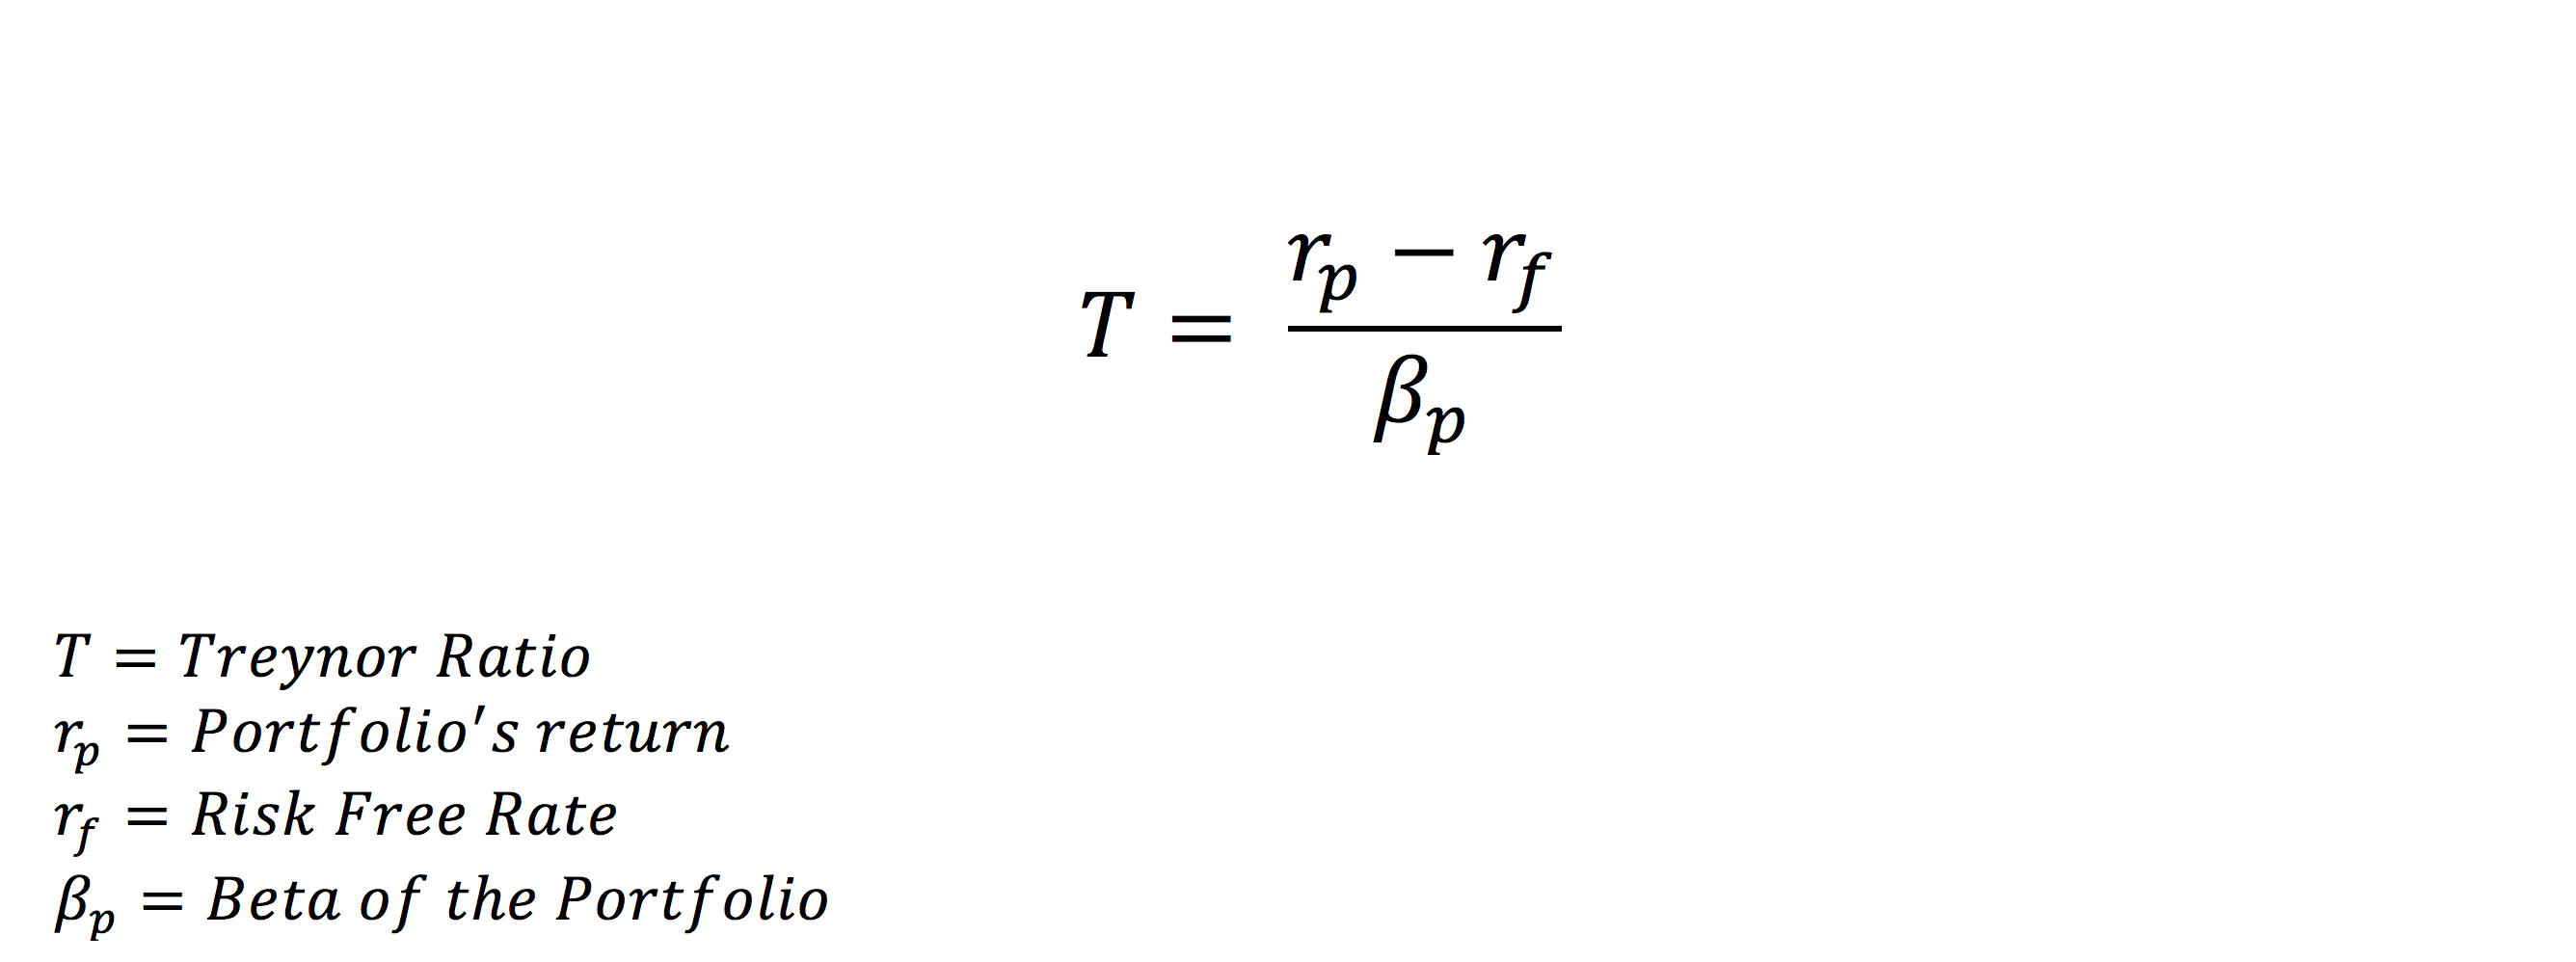
(0.0651-0.0074)/1=5.77%
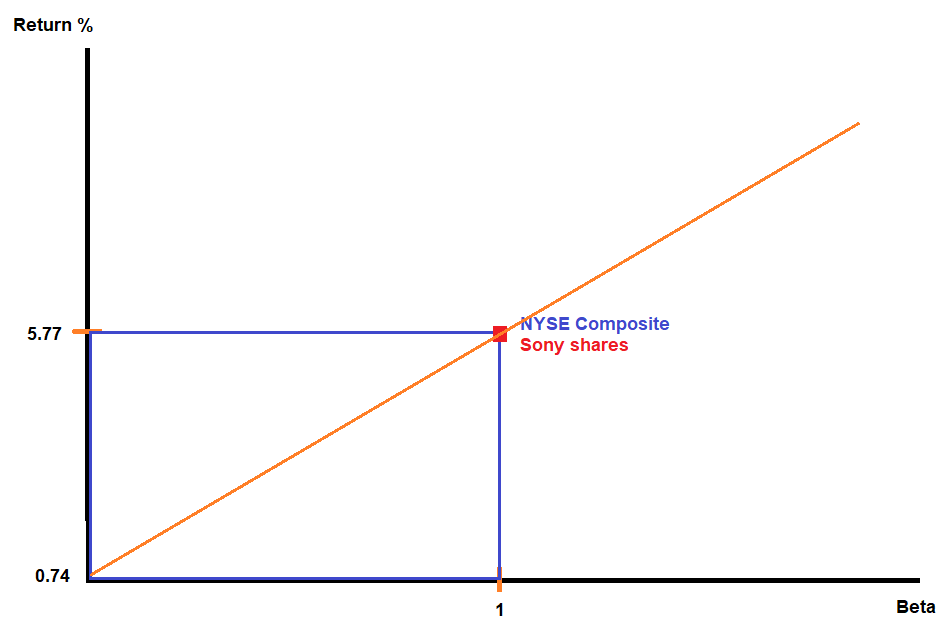
Figure 60 Treynor ratio plotted on the SML
The Treynor ratio measures the systematic risk to reward ratio, indicating the expected return on a security per unit of systematic risk in excess of the risk-free rate. In this case, we can see that for every unit of market risk, the expected return on the security is 5.77%.
Using the actual average return in the past 4 years, the Treynor ratio would be as follows:
(0.2912-0.0074)/1=28.38%
The Treynor squared measure does the same thing, but shows the return on the security in excess of the return on the market:
0.0074+0.0577×1-0.0651=0%
This would have given has an excess return of 0, as CAPM is predicting Sony shares to yield the same returns as the market index. If we were to use it with the actual annual average return, we would have obtained the following:
0.0074+0.2838×1-0.0651=22.61%
4.2. Chapter summary
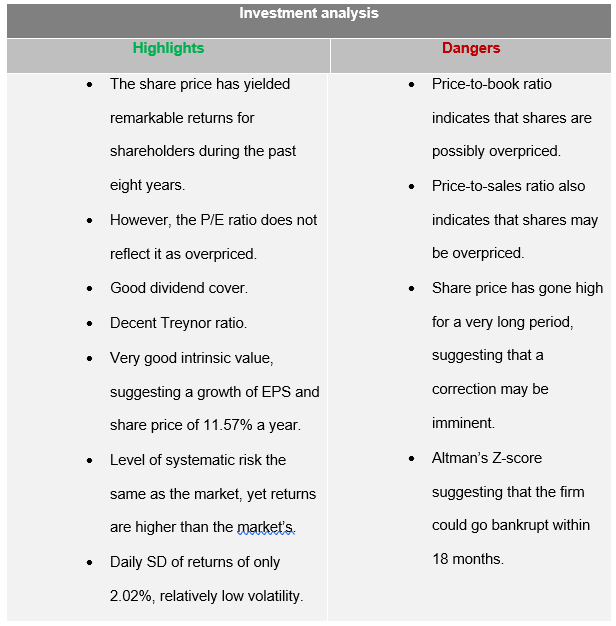
Figure 61: Investment analysis summary
This section suggests that it should be relatively easy for the firm to obtain funding through issuing shares, as investors may be interested in investing the firm. The share price is expected to keep on growing, with an EPS growth well above discount rates, which will increase the market value of the company.
5.Conclusion and recommendations
5.1. Wrapping up with SWOT analysis
After having carried out the analysis above, one can conclude with the following.
5.1.1. Strengths
There is a low threat of new entrants in the markets where Sony operates, which allows for better control of competition and for potential higher profits.
Strong financial statements, showing strong levels of revenue, operating profit margins and net income margins, with a forecasted net growth of cash inflows of 11.57% a year.
The business model is well diversified and partially protected from economic recessions thanks to DTC services.
Expected boost in revenue and market value of the firm as an economic recovery is expected to start in early 2021, which will be ideal for launching the new catalogue of products.
The Pictures segment is running more efficiently than in previous years. Many competitors losing money while Sony continues to be profitable.
Very high levels of operating profit in the Music segment while some main competitors are reporting important losses.
Very strong Game & Networks segment with huge prospects, number one in the industry.
Electronic Products and Solutions segment profitable even after absorbing losses from the Mobile Communications division. One of the industry leaders of several of the products it sells.
Mobile Communications division already downsized and with a positive forecast due to 5G and IoT.
Impressive share performance, yielding very high profits for shareholders with low volatility, market risk being equal to the market’s.
5.1.2. Weaknesses
Existence of an important number of substitute products from competitors, many of them being more economical than Sony’s.
The firm is very highly geared, 70% of the capital structure are liabilities. Potential reduction of investment opportunities at some point in the future. Companies like Samsung have a proportion of equity that is a lot higher than their liabilities.
The firm needs to keep on generating cash at all costs. Very limited sustainability if the company were to stop generating income.
Competitors like Samsung have been generating higher margins of gross income.
Game & Networks segment in constant threat of disruptive innovation.
Pictures segment still needs to generate higher operating profit margins.
Mobile Communications division has run on operating losses for the last three years and the subsequent downsizing may hinder the opportunities for growth here onwards, as well-established competitors may yield most of the profits.
Music segment’s reputation being threaten by the release of documentaries shedding light on the dirty ropes of the music industry.
Share price potentially overpriced, as some ratios have shown.
Altman’s Z-sore would indicate that the firm could go bankrupt within 18 months.
5.1.3. Opportunities
The firm operates in favourable political, economic, socio-cultural, technological, legal and environmental spheres, which is convenient to keep on releasing products in most of the world, making trillions of Yen of revenue a year and maintaining its influence in the industries where it operates.
The upcoming 5G and IoT technologies present a unique opportunity where Sony will have the chance to introduce a new line of phones and other devices with features that have never been seen before. The firm has a shot at re-adapting their Mobile Communications division and make it profitable again, potentially becoming one of the industry leaders.
The evolution of the videogame industry to virtual and augmented realities surely presents an opportunity to expand the already successful Game & Networks segment and make it even more profitable.
The firm has the opportunity to adapt to the situation and come up with a proper revenue system that pays artists fairly, potentially attracting more artist and therefore more variation to the music portfolio and higher profit.
Expected boost of global GDP to commence in early 2021, which means opportunity to sell more.
The expected cashflows will grant the firm with the opportunity to reduce their debt and create a healthier capital structure, making it more resilient to any market conditions.
5.1.4. Threats
Many competitors offer substitutes to Sony’s products, usually for a lower price. In some industries, the product space is so saturated that customers are tempted to choose cheaper versions of the product, ending up purchasing other brands. This is especially true when it comes to televisions and mobile phones.
The firm is entering a new generation of videogame consoles, releasing their new piece of hardware in November this year. As the industry is going through important changes in terms of distribution (digital downloads and streaming), there is a possibility that the firm may be negatively affected by disruptive innovation.
The firm recently invested in the design of a car that has several entertaining features (Sony corporate report 2020). This new investment has the risk of not being successful, which may carry a significant amount of losses.
As the firm operates mainly in oligopolies, if it does not collude with competitors, competition can get tough.
5.2. Balanced scorecard with recommendations, and final conclusion
Recommended targets have been outlined in the following balanced scorecard:
5.2.1. Organisational capacity and growth
- Focus: To increase sales volume and revenue and increase market share.
- Performance indicators: sales volume, sales revenue, proportion of market share.
- Target: To increase sales of all products by 10%, except for televisions and mobile phones, which should increase by 20%.
- Initiative: Invest to be the first to release phones with features that use 5G to become the market leader and gain competitive advantage. Invest in facilities to produce own television sets that can be sold at lower prices and include more differentiating features. Be the first in investing and release content that uses augmented reality to gain competitive advantage.
5.2.2. Internal processes
- Focus: To increase efficiency in the EP&S and Picture segments.
- Performance indicators: Operating profit margin, cost of goods sold, operating expenses.
- Target: To raise operating profit margin by 15%.
- Initiative: Constantly review performance of the segment very closely and come up with ideas on how to reduce total costs.
5.2.3. Customer
- Focus: To increase customer niche.
- Performance indicators: Sales revenue, social media tracking and analysis, surveys.
- Target: To further polish Sony’s reputation and attractiveness in order to increase sales.
- Initiative Invest more in advertising, especially in products from the EP&S segment. Release surveys periodically and use the results to build and shape customer trends.
5.2.3. Financial
- Focus: To increase ROE, operating and net profit margins and to reduce debt.
- Performance indicators: Operating and net profit margins, equity to liabilities ratio, ROE, ROA, cash burn rate.
- Target: Increase operating margin by 10% and net income margin by 7%, reduce total liabilities by 5% and increase equity by 7%.
- Initiative Use what has been discussed above to increase sales and efficiency, do not increase long-term debt, focus must lay on reducing debt.
5.3. Conclusion
The company is on the right track.
End of report
References
Alexander, G., & Bucholtz, R. (1978) ‘Corporate social responsibility and stock market Performance’, Academy of Management Journal (November), Vol 21 no 3, pp. 479-486.
Altman, E. I., (1968) ‘Financial ratios discriminant analysis and the prediction of corporate bankruptcy’, The Journal of Finance, Vol. XXXIII no 4.
BBC (2019, January 23rd), Sony to move Europe headquarters to avoid Brexit disruption.
Retrieved from https://www.bbc.co.uk/news/business-46968720#:~:text=Sony%20will%20move%20its%20European,from%20the%20existing%20UK%20operations
Benninga, Simon (2011), Principles of Finance with Microsoft Excel (Second edition, Oxford
University Press).
Bodie Z., Kane A. and Marcus A.J. (2014) Investments, (tenth edition, McGraw-Hill).
Dobbs, I. (2005) Managerial Economics: Firms, Markets and Business Decisions (Pearson).
EDHEC (2008) ‘Performance measurement practices: Call for reaction’, The EDHEC European investment practices survey, https://risk.edhec.edu/
Flammer, C. (2015) ‘Does corporate social responsibility lead to superior financial performance? A regression discontinuity approach, Management Science (November), Vol. 61 no. 11 pp. 2549-2568.
Freed, J. R. and Sussman, F.G. (2008) ‘Adapting to climate change: ‘A business approach’, Pew Pentre on Global Climate Change (April): pp. 1-35.
Goold M., and Campbell A. (1998) ‘Desperately seeking synergy’, Harvard Business Review, Vol. 76 No. 5, 131-143.
HBR’s Must-Reads on Strategy (2008) Harvard business review, (product 12601, reprint 96608) pp. 23-40.
Henry O. T. and Olekalns, N. (2000), ‘The effect of recessions on the relationship between output variability and growth’ Southern Economic Journal (May), Vol. 68 no. 3, pp. 683–692.
Johnson, J.P., Lenartowicz, T. and Apud, S. (2006), ‘Cross-cultural competence in international business: toward a definition and a model’, Journal of International Business Studies (May), Vol 37 pp. 525–543.
Lipczynski J., Wilson J. O. S. and Goddard, J., (2017) Industrial Organization: Competition, Strategy and Policy (Fifth edition, Pearson). McGuire B, Sundgren A. and Schneeweis T., (1988), ‘Corporate social responsibility and firm financial performance’, The Academy of Management Journal (December), Vol. 31, No. 4, pp. 854-872.
OECD (2020), National Accounts of OECD Countries, Volume 2020 Issue 1, OECD Publishing, Paris, https://doi.org/10.1787/629805bc-en.
Parking, M. (2019) Economics (Thirteenth edition, Pearson).
Smith, N. (2020, May 12th), The giants of the video game industry have thrived in the pandemic. Can the success continue? Retrieved from https://www.washingtonpost.com/video-games/2020/05/12/video-game-industry-coronavirus/
Smith, N.C., Read, D., and López-Rodríguez, S. (2010), ‘Consumer perceptions of corporate social responsibility: The CSR halo effect’, INSEAD Working Papers Collection, No. 16, pp. 1-22.
Solomon S, Plattner K, Knutti R. and Friedlingstein P. (2008) ‘Irreversible climate change due to carbon dioxide emissions’, Proceedings of the National Academy of Sciences of the United States of America (February): Vol. 106 no. 6, p. 1709.
Sony corporate report (2019, March 31st), (2020, March 31st). Retrieved from https://www.sony.net/SonyInfo/IR/library/corporatereport/CorporateReport2019_E.pdf
Spicer, B. H. (1978) ‘Investors, corporate social performance, and information disclosure: An empirical study’, Accounting Review (January), Vol. 53 no. 1, pp. 94-111.
Sturdivant, F. D. and Ginter, J. L. (1977). ‘Corporate social responsiveness: Management attitudes and economic performance’, California Management Review, (April) Vol 19 no. 3, pp. 30-39.
The Hedge Fund Journal (2008) ‘Measuring performance and the sharpe and Information ratios’, issue 37.
Wojciechowska, M (2016), Intangible Organizational Resources: Analysis of Resource-Based Theory and the Measurement of Library Effectiveness, p. 39.
Appendix 1.1
2.1.6. Environmental risks
As it is well known, Sony manufactures electronic devices and semiconductors, which unfortunately makes the firm a contributor of global warming – reason why the company is constantly looking for ways to mitigate the effects of gas emissions and climate change.
As stated in the corporate report released in March 2019, the firm implemented the ‘Road to Zero’ environmental plan, which aims is to have no environmental footprint by the year 2050. This is helping to keep the company in the right track to transition into a fully sustainable entity by 2050.
Global warming is a serious issue as it would potentially completely disrupt the firm’s profits in upcoming decades. ‘’Irreversible climate changes due to carbon dioxide emissions have already taken place, and future carbon dioxide emissions would imply further irreversible effects on the planet’’ (Solomon et al, 2008, p. 1709).
These irreversible effects would take place in areas of the world where Sony sells to hundreds of millions of people, including Asia, North America and Southern Europe.
Also, Freed (2008) indicated that climate change will affect operations, production processes and supply chains of businesses, disrupting utility networks, especially electricity. Customers accessing electricity is vital for Sony’s business as well as a fully operational supply network.
Appendix 1.2
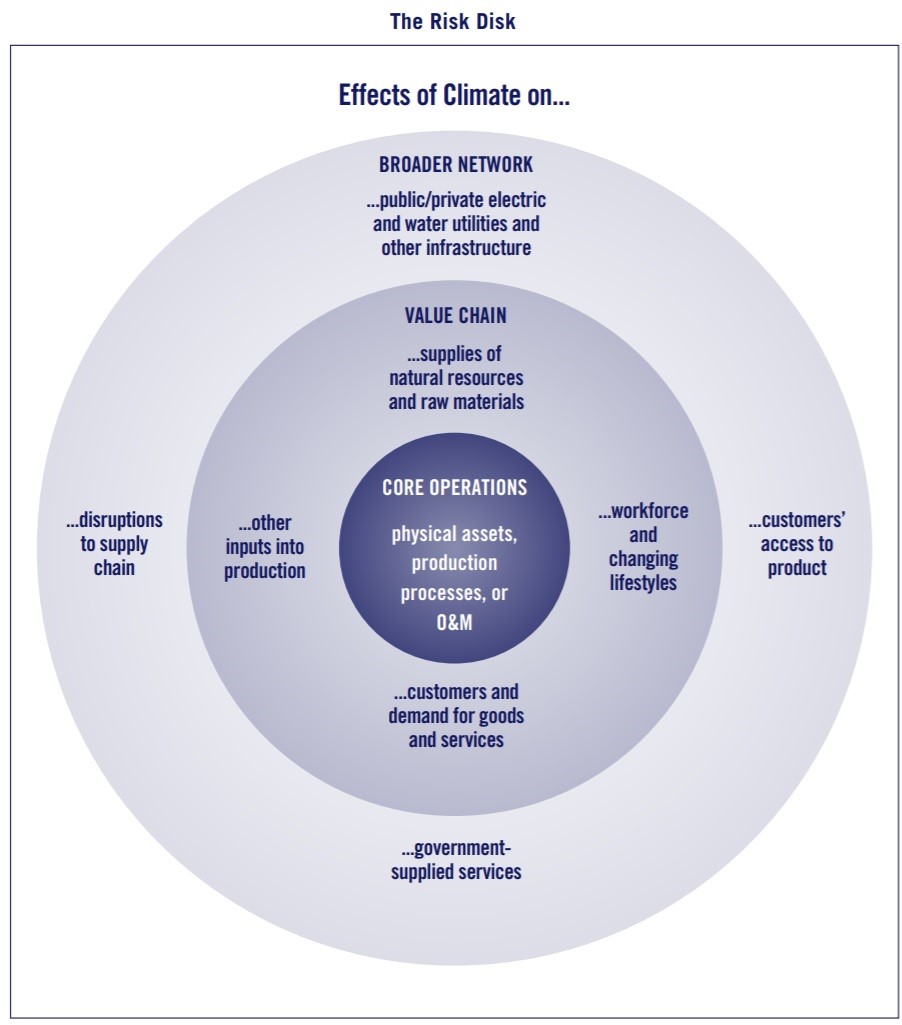
’The risk disk’, Adapting to climate change: A business approach (2008)
In order to have a picture of how to tackle this problem, one might be tempted to use the threat agent risk assessment (TARA) as it is commonly used in businesses to assess risks. In this case, TARA would look as follows:
Appendix 1.3
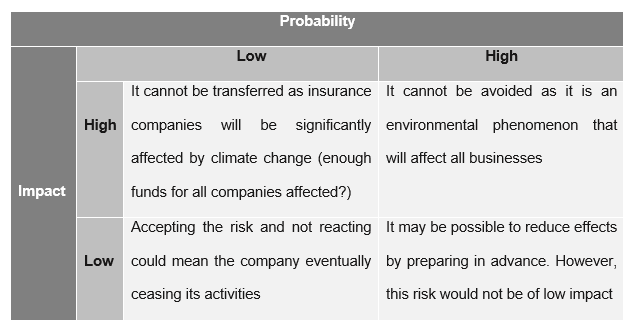
TARA may not be the best tool to assess this threat as it does not fit in any of the categories. The nature of this environmental risk is more complex and needs a tool that better suits the circumstances. Consequently, Freed’s climate risk screening has been included:
Appendix 1.4
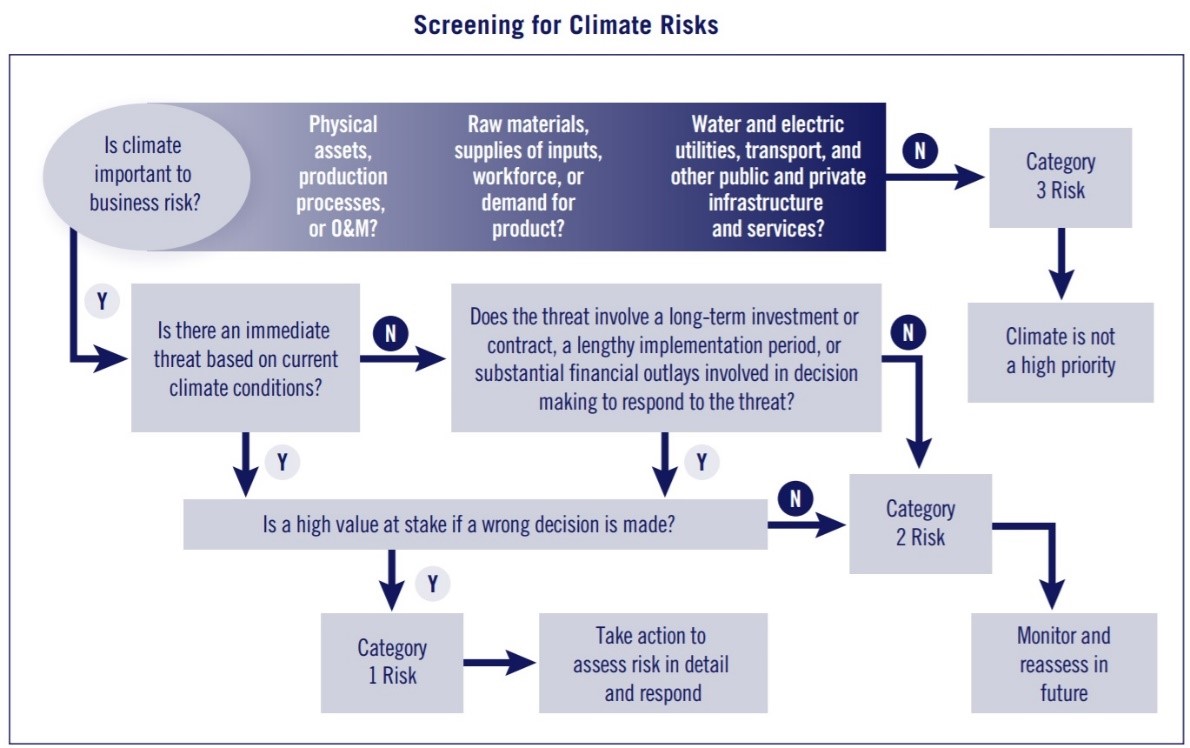
‘Screening for climate risks’, Adapting to climate change: A business approach (2008)
Even though climate change is not an imminent threat to the company, it does involve a long-term investment and lengthy strategy implementation. Given the fact that the future of the company could be at stake once the threat hits the firm, this should be considered of high value, leading us to category risk 1 – take action.
‘Road to Zero’ is a great initiative that sets the company in the right path to become a sustainable entity. However, as studies already suggest, the effects of global warming will not be mitigated even if gas emissions were to stop as of this moment, which will impact businesses around the globe (flooded cities, electricity scarcity).
Re-engineering the supply chain worldwide and relocating offices and manufacturing facilities will be essential for the continuation of operations further into the century. As this will be costly, it is advisable to start allocating capital for these plans and start acting as soon as possible. See appendix 1 for more information.
Appendix 1.5
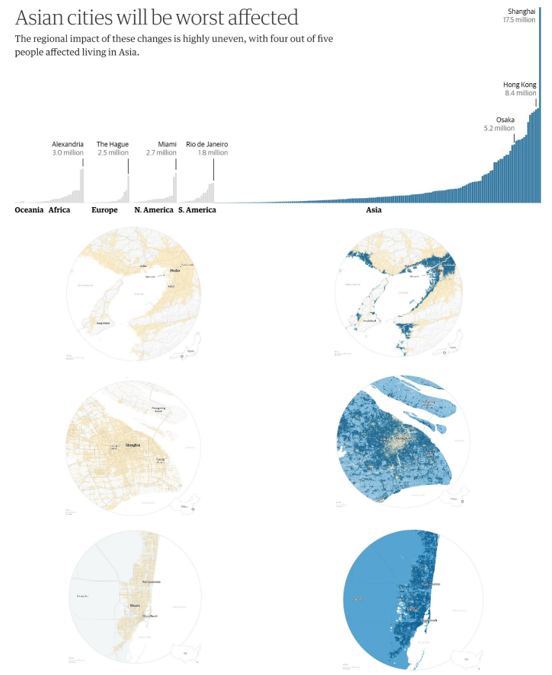
From top to bottom, the cities of Osaka, Shanghai and Miami. The left side shows what the cities look like now. The right side shows what the cities will look like in a +3C post-industrial world. It is estimated that Osaka will lose about $1 Trillion in assets by the decade of 2070 (as of March 2019, Sony had net assets of $44.71 Billion as of the exchange rate on 14/07/2020) and will affect over 19 million people. Source: https://www.theguardian.com/cities/ng-interactive/2017/nov/03/three-degree-world-cities-drowned-global-warming
Appendix 2.1
2.1.7. Ethical factors and corporate social responsibility
Sony currently ranks high in corporate social responsibility (CSR) and ethics. The firm’s code of conduct helps to set the right environment inside the organisation for growth.
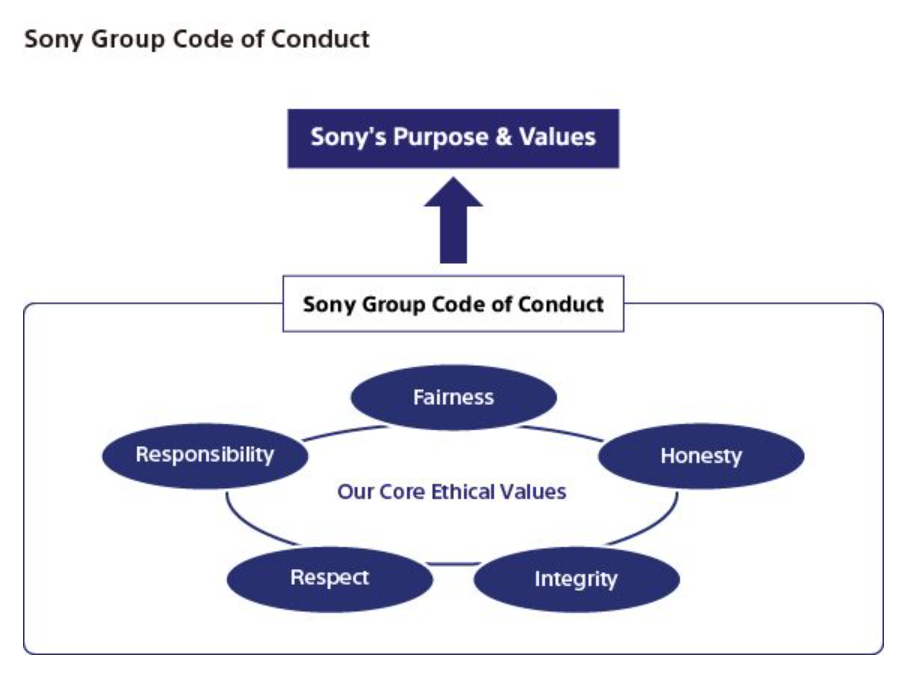
Source: Sony.net
Also, the firm makes emphasis on the importance of an ethical and responsible supply chain and establishes business relations with firms that cover the requirements of their ethical supply chain list.
This is something that the company must preserve over time as it helps the company to maintain competitive advantage.
As Spicer (1978) and Alexander and Bucholtz (1978) indicated, companies which do not comply with CSR are more likely to be perceived as having poor management and higher risk, which may deter investors from investing in the firm, making it more difficult for the company to obtain funding. On the other hand,
Appendix 2.2
‘a high degree of corporate social responsibility may permit a firm to have relatively low financial risk as the result of more stable relations with the government and the financial community’ (McGuire et al, 1988, p. 856).
Sturdivant and Ginter (1977) also found that there is a positive correlation between companies with high CSR and measures of accounting performance. There is also ‘’support for the hypothesis of a positive relationship between financial performance and social responsibility’’ (Lipczynski et al, 2017, p.153). Flammer (2015) observed that soon after a vote is passed at a shareholders meeting to implement a CSR policy, labour productivity and sales growth increase.
Apart from accounting and financial performance, CSR helps companies to build reputation, which is imperative for the company to maintain their income streams and competitive advantage. For example, Smith el al (2010) commented that when consumers know about a company’s CSR policy, they are influenced by their perception of the company in a way that it makes them think that the firm is also socially friendly when it comes to other issues, picturing an overall image of socially responsible entity (halo effect). This can only be good for the firm’s reputation and performance.
Appendix 3 – Michael Porter and his work on competition
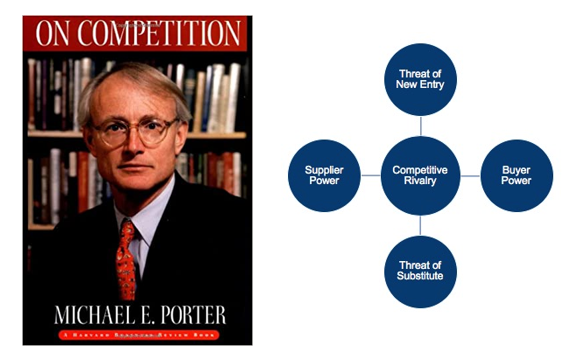
Michael Porter, an American academic known for his theories on economics and business strategy, developed the five forces framework in 1979 to be used for microenvironment analysis of firms and its competitive intensity in the industry. Porter’s five forces have been used to analyse countless businesses as it helps creating an overall picture of where a company stands within the industry in relation to suppliers, customers, threat of substitutes and threat of new entrants, focusing on barriers to entry and exit as well. Porter’s analysis has been included in this report for its usefulness when creating competitive strategies.
Appendix 4 – Oligopolistic industries
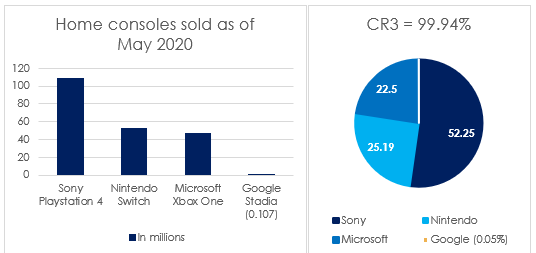
Source of numbers: PlayStation 4 and Switch – Forbes.
Source of Stadia numbers: Google.
The gaming and networks segment (the firm’s most profitable segment for the last five years) is a clear example of the market structure of most industries where the company operates. This industry is a non-collusive oligopoly with a concentration ratio of three (CR3) firms accounted for an output of 99.94% of the global market (sales of software and online subscriptions not accounted for).
Appendix 5 – Transformation of Sony’s mid-range plans
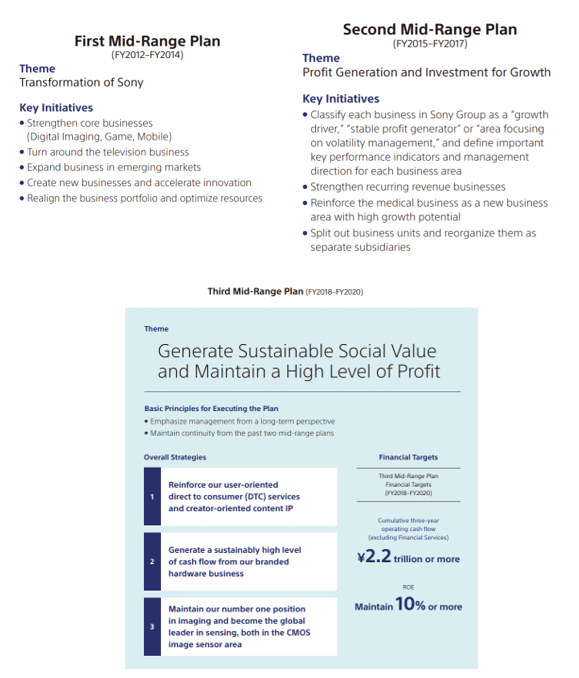
Appendix 6.1 – Statement of financial position 31st March 2020
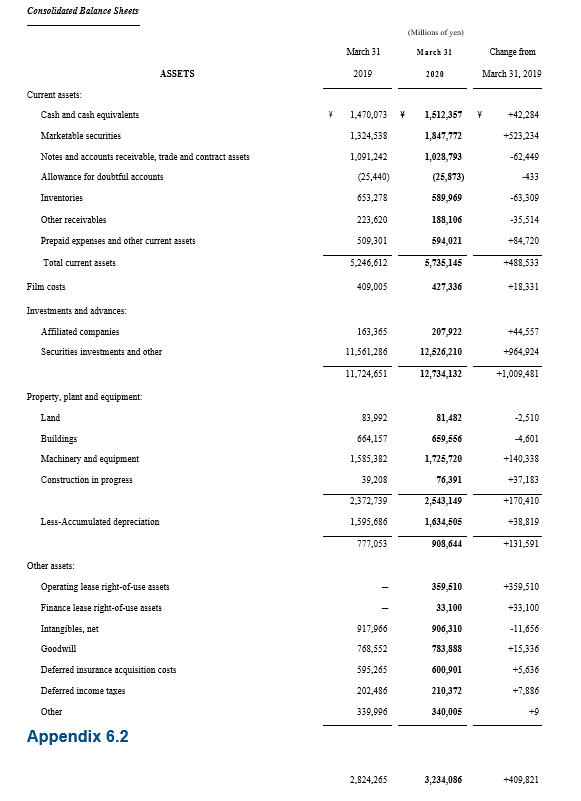
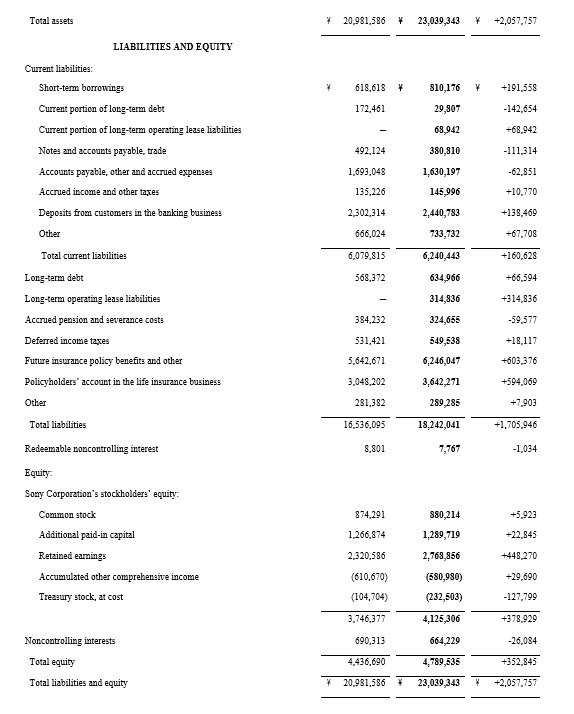
Appendix 7 – Statement of profit and loss
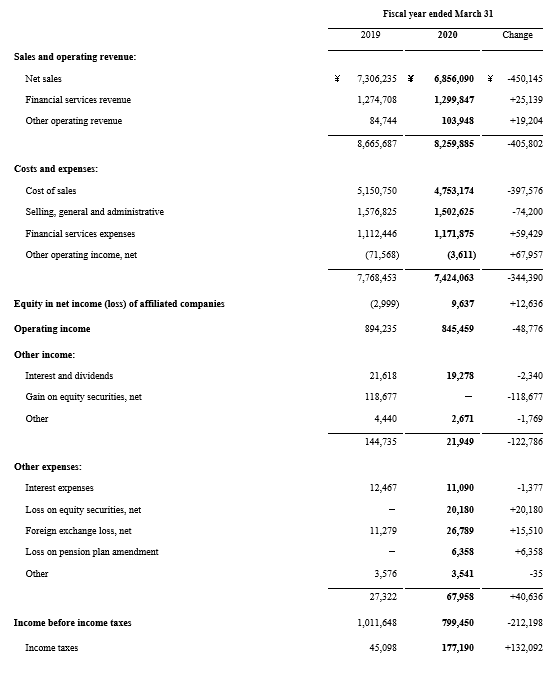
Appendix 8.1 – Statement of cashflows
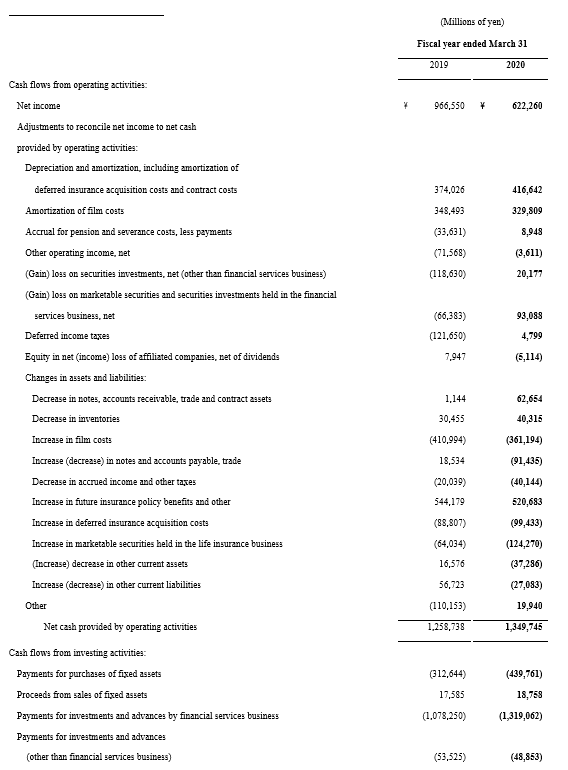
Appendix 8.2 – Statement of cashflows
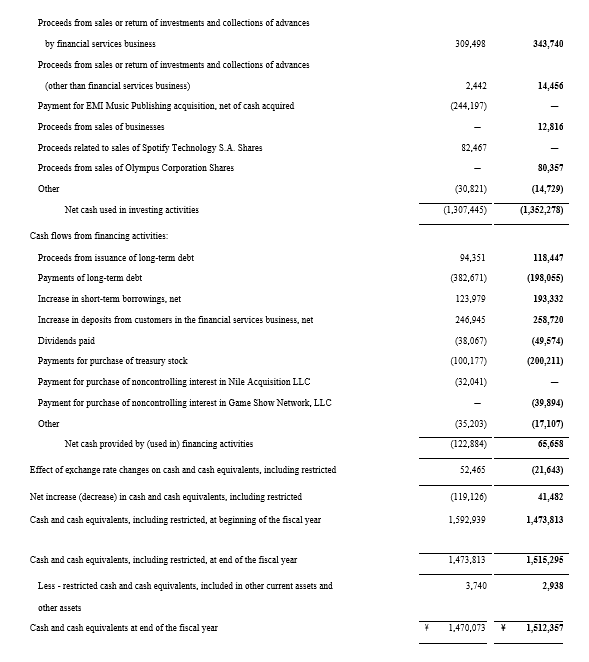
Appendix 9 – Cost of equity using Gordon’s dividend model
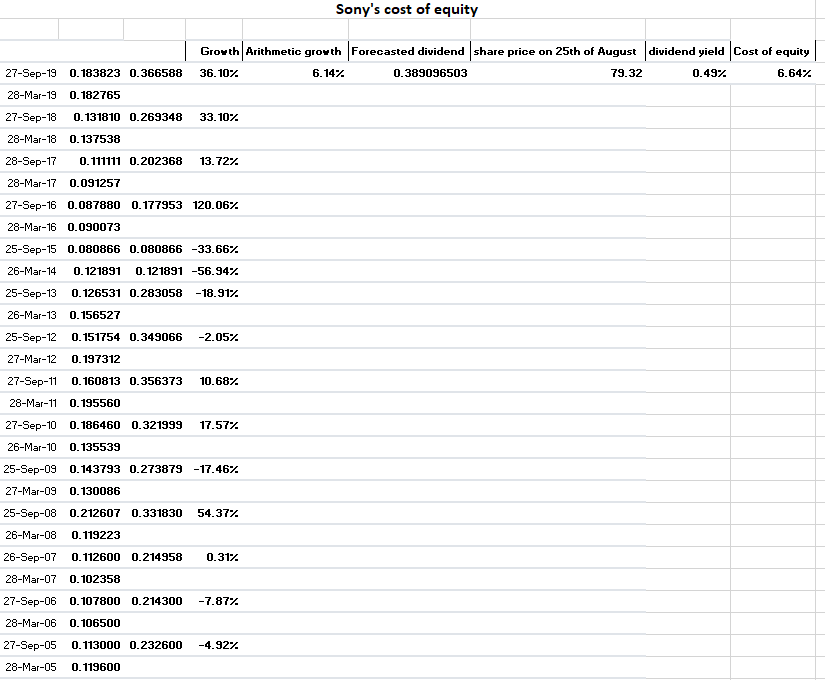
The cost of equity has been calculated using the dividends paid for the last 20 years (picture does not show the full list, it goes all the way down to 2000). This information has been retrieved from Yahoo Finance.
Gordon’s dividend model uses the geometric average return on dividends during the period to forecast next year’s dividend. Then, the dividend yield is obtained using the current share price. To that percentage, the arithmetic average rate is added. That is what constitutes your cost of capital
Bare in mind that, due to the fact that the arithmetic average return added to the dividend yield resulted on barely 1%, the arithmetic average return has been used to obtain a much more realistic cost of capital (6.14+0.49).
Appendix 10 – Samsung’s statement of financial position
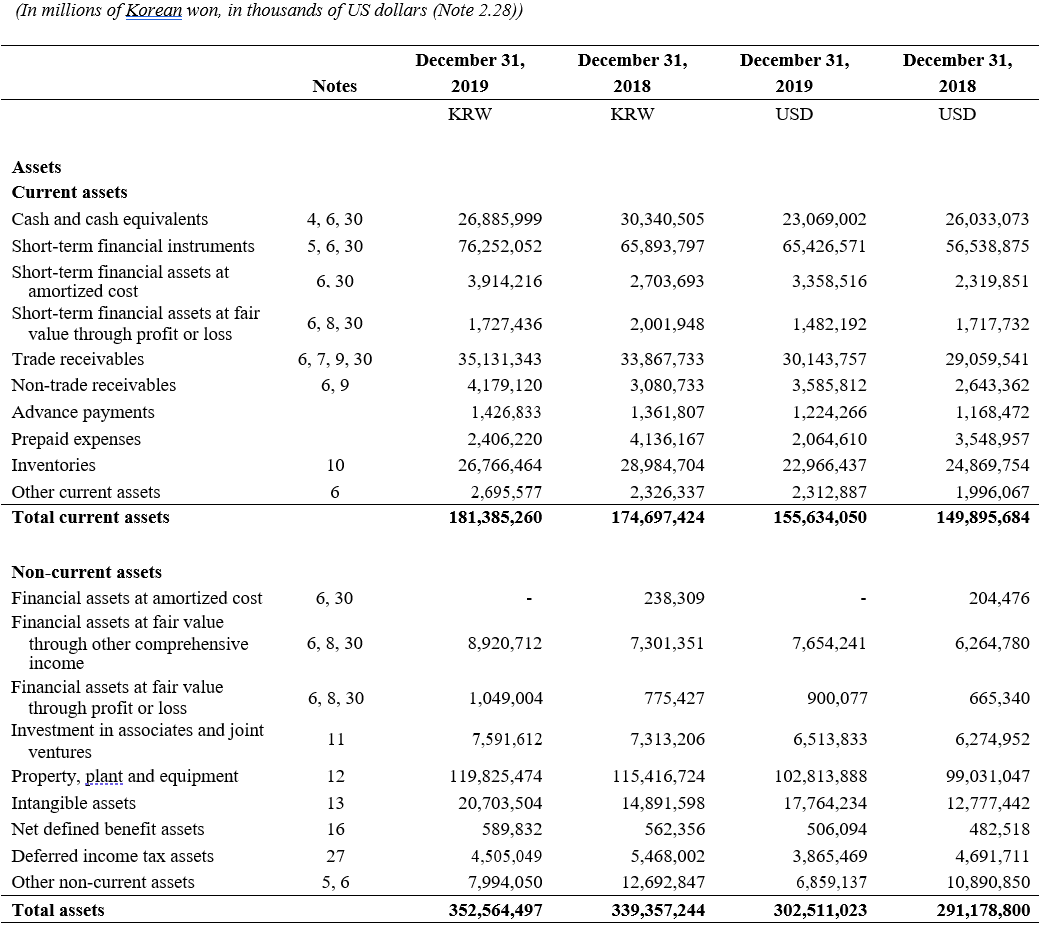
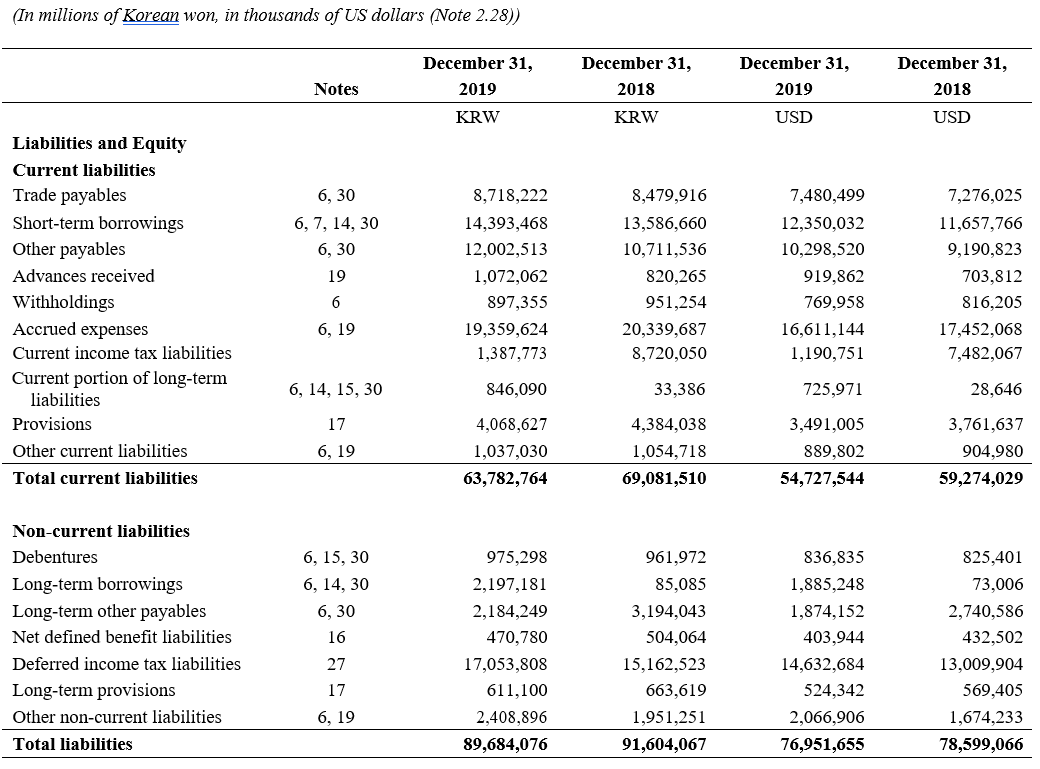
Appendix 11 – Samsung’s statement of profit and loss
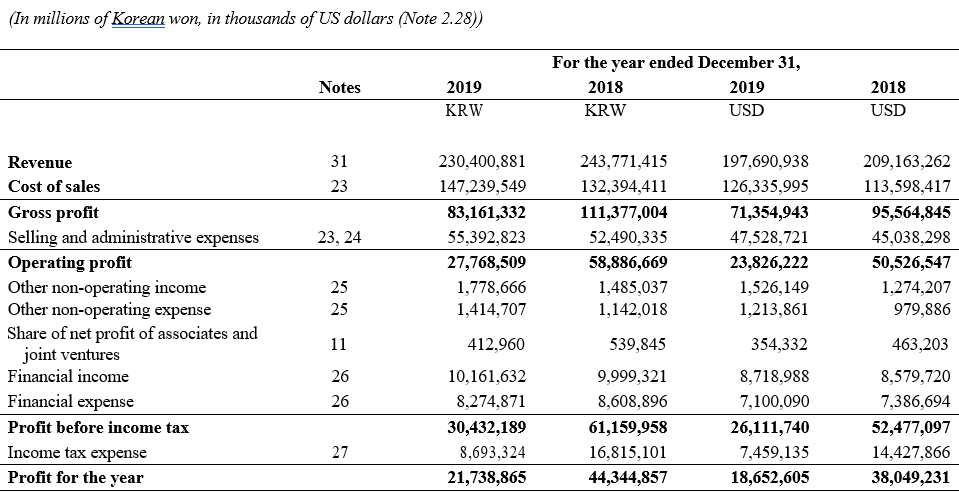
Appendix 12 – Sony’s sales by segment
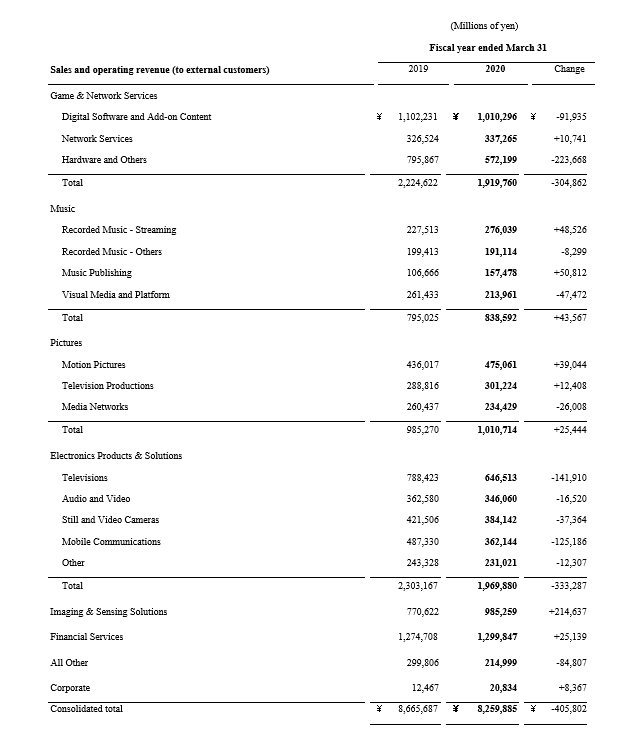
Appendix 13 – Sony’s operating profit by segment
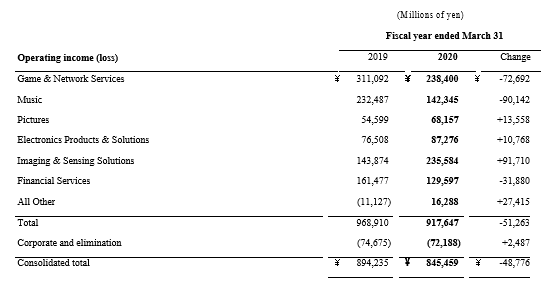
Appendix 14 – Nintendo’s statement of profit and loss
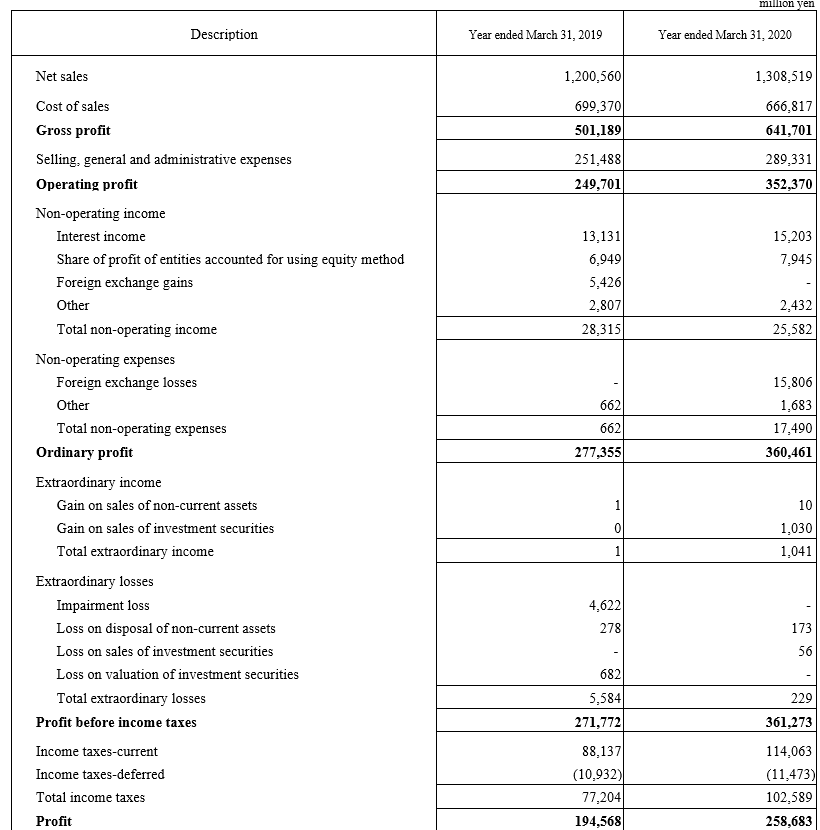
Appendix 15.1 – Share overall past performance
The performance of Sony’s shares has effectively reflected the boost of earnings generated by the Transformation of Sony strategy implemented back in 2012. On the first of November of the same year, at a closing price of $9.70, it started to move upwards all the way up to a closing price of $76.85 as of the 29th of July 2020, even after accounting for the negative impact of Covid-19 in the global markets. For shareholders, this is a gross return on investment of 692% over the eight-year period (not adjusted for dividend reinvestments).
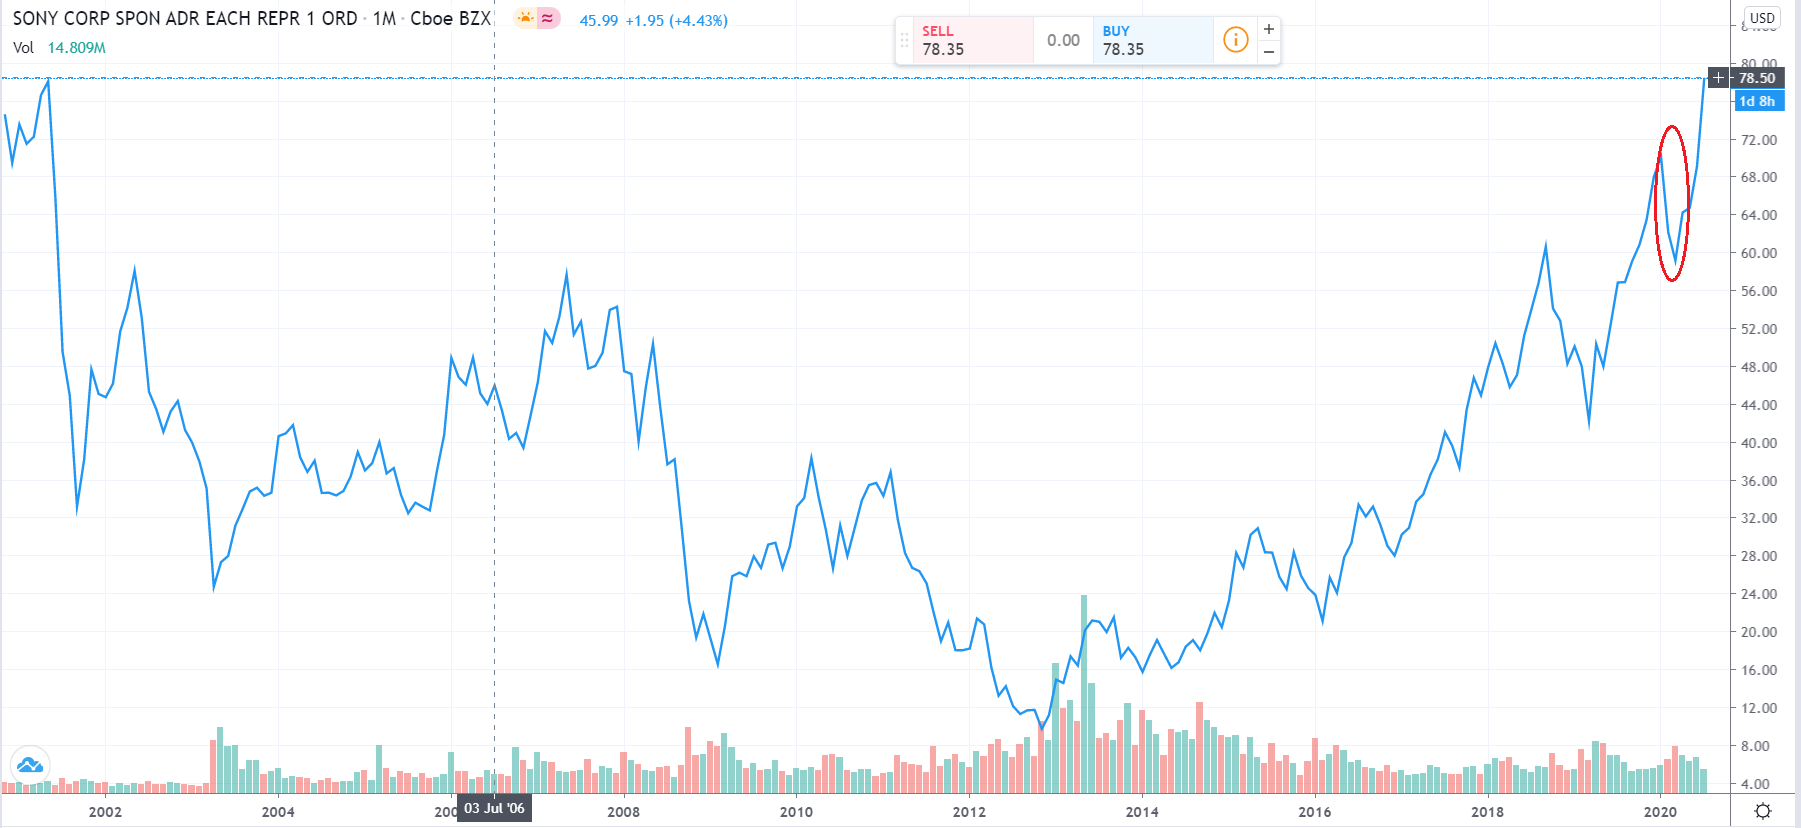
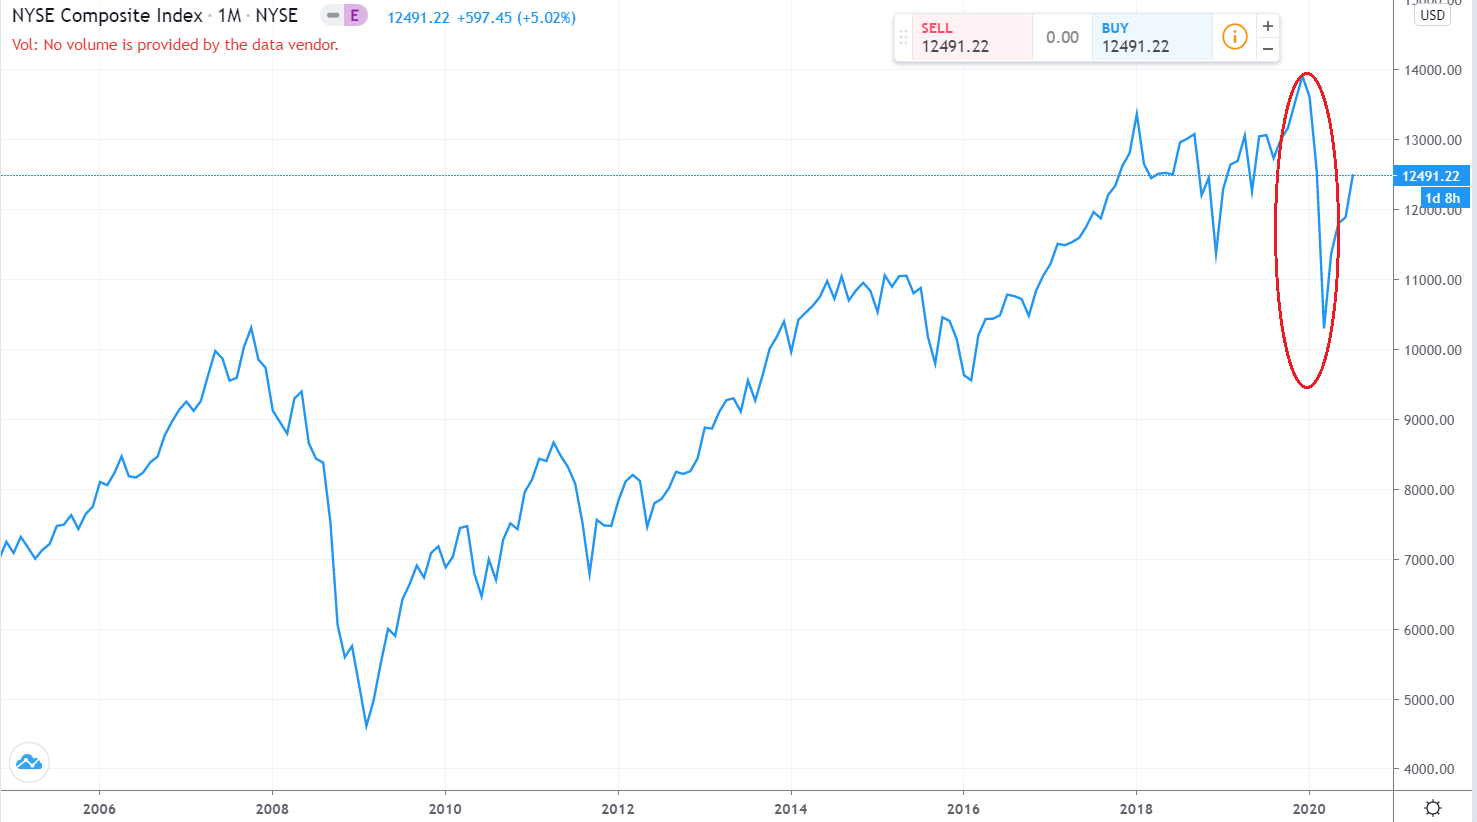
Retrieved from tradingview.com
Appendix 15.2 – Share overall past performance
The red circles on the graphs above show the rapid correction of the broad NYSE composite index due to Covid-19. Comparing the two graphs, one can easily see how as of the 29th of July of 2020, the market has not recovered from the impact of the pandemic, whereas Sony’s shares have already gone over pre-recession levels. This is most likely due to the firm’s relative resilience to economic recessions thanks to their digital DTC products, as previously commented on the PESTLE and company accounts analysis.
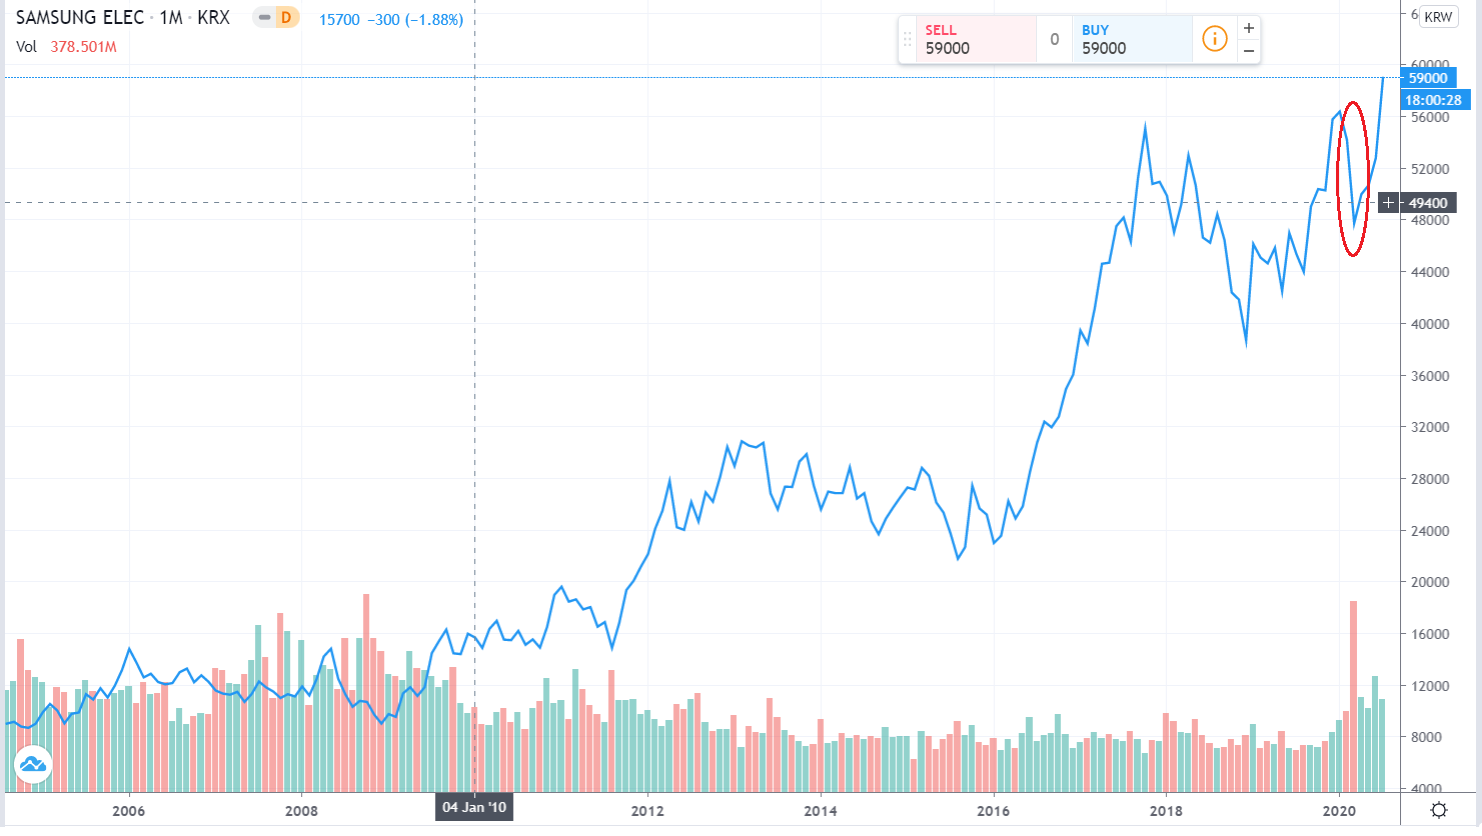
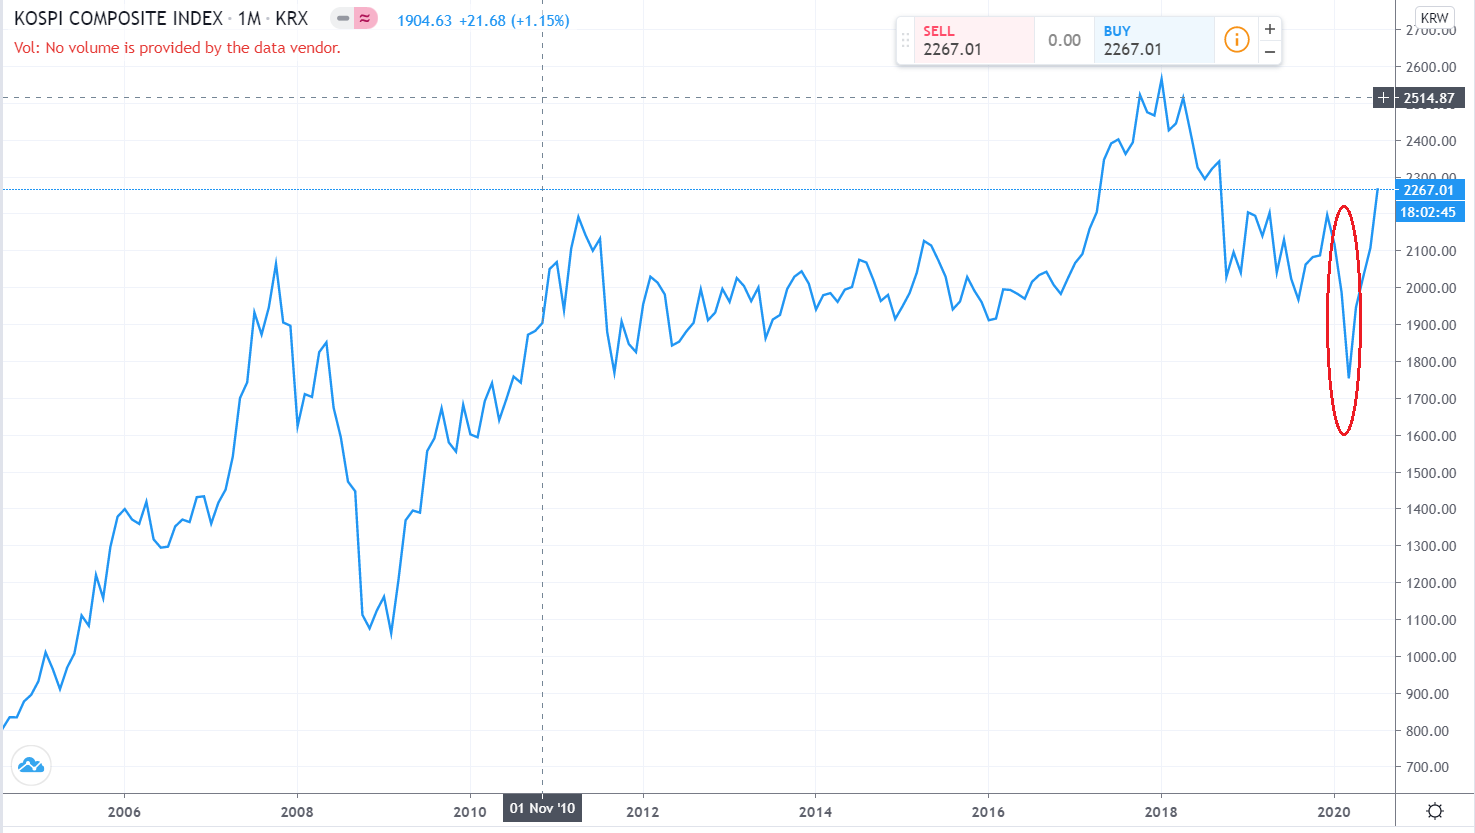
Retrieved from tradingview.com
Appendix 15.3 – Share overall past performance
Comparing Sony’s share performance with that of comparable companies such as Samsung, it is shown that Samsung had a share price increase of 108% during the same eight-year period. Even if one were to go back to the point where Samsung’s share price started to increase, back to the 1st of December of 2008, the increase up to the 29th of July of 2020 is 549% (not adjusted for dividend reinvestments), suggesting that the market has higher expectations for Sony.
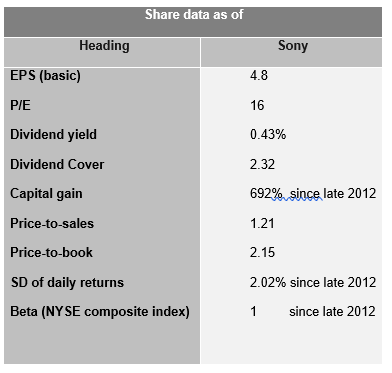
The dividend cover is at a good level, showing that the latest earnings would be able to cover 2.15 times the dividend for this year.
The dividend yield is low, but very high capital gains compensate for this low dividend yield.
As the table above shows, the price-to-sales ratio is over 1, which indicates that the share is overpriced.
Appendix 15.4 – Share overall past performance
The price-to-book ratio also indicates that the shares are overpriced, showing that investors are currently paying 2.15 times the value of the firm’s assets.
However, the P/E ratio is at around the market average, indicating that the shares are not overpriced. Investors are getting mixed signals coming from the P/E and the price-to-book ratios
Intrinsic value
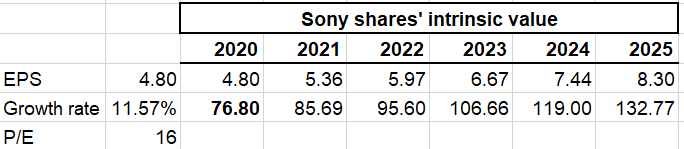
The EPS has been compounded at the cashflow growth rate that was calculated previously. Assuming that the share price will grow at the same rate as the cashflow rate, we can forecast how much an investor would get back in capital gains if they were to buy the shares today at the intrinsic value of $76.80 (72.88% after year 5).
Appendix 16.1 – CML related measures
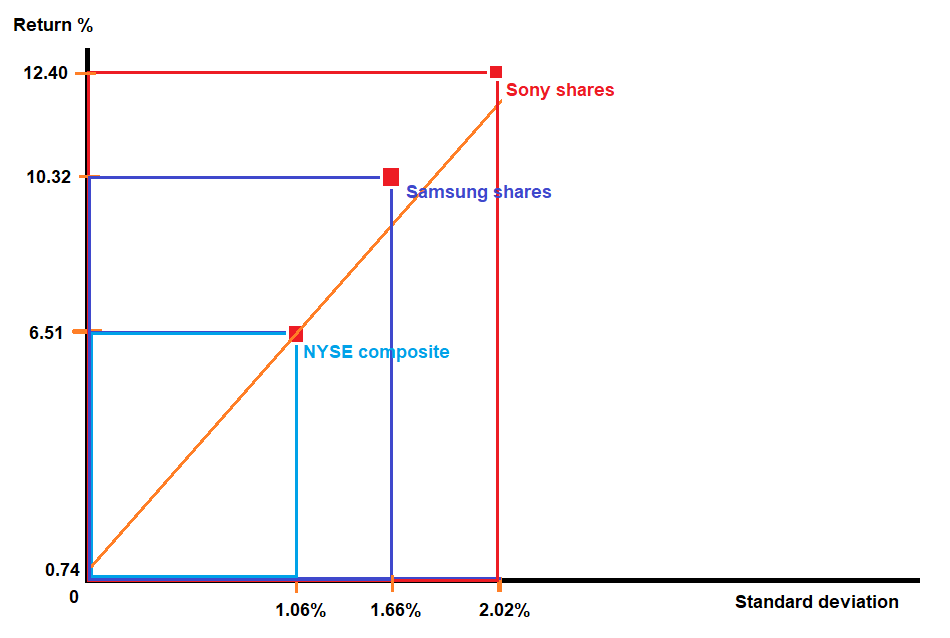
Sony and Samsung shares plotted on the CML
Expected return on Sony’s shares: 0.0074+2.02x(0.0651-0.0074)=12.40%
Expected return on Samsung shares: 0.0074+1.66x(0.0651-0.0074)=10.32%
The capital market line (CML, the orange line on the diagram) is a spin-off of CAPM that shows the expected return in relation to units of total risk, measured as standard deviation.
The figure above shows how a market portfolio would differ from Sony and Samsung shares if we used SD instead of beta to calculate the expected return. The SD has been calculated using the daily returns at closing price during the last 7.75 years. Surprisingly, this model is delivering more accurate return estimates than CAPM.
Appendix 16.2 – CML related measures
Both shares are almost at the same proportion of total risk and returns as the market, which indicates to investors that both are good investments.
Sharpe and Modigliani measures
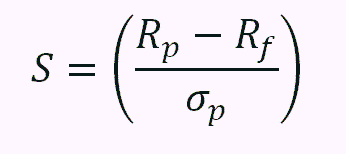
(0.1240-0.0074)/2.02=5.77%
The sharpe ratio shows investors the same as the Treynor ratio, only that this time it shows us the expected return in excess of the risk-free rate per unit of total risk (SD).
The same way, the Modigliani measure shows the same as Treynor squared, only that it measures the expected return in excess of the market return per unit of total risk (SD).
0.0074+0.0577×1.06-0.0651= 0.35%
Information ratio
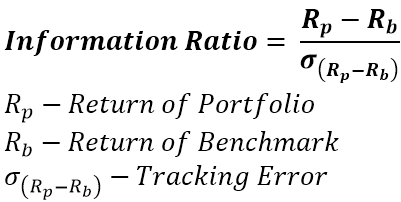
(0.1240-0.0651)/1.72=3.42%
This ratio shows how much the expected return is outperforming the market index per unit of SD using a tracking error in the denominator, this being the SD of the difference between the expected return and the market index return.
Appendix 17 – Share normal distribution and descriptive statistics