Biosensors and Analytical Techniques
Introduction
Protein expression is an essential part of proteomics– the field of science that determines the presence and quantity of protein in a cell or tissue. Protein expression is commonly carried out in bacteria, yeast, viral, insect or mammalian cells, depending on the kind of protein and the intended application. The oldest expression systems are cell-based and are defined as the ‘combination of an expression vector, its cloned DNA, and the host for the vector that provides a context to allow foreign gene function in a host cell; that is, produce proteins at a high level’ (Online Medical Dictionary. Centre for Cancer Education, University of Newcastle upon Tyne). Some common host bacteria include E.coli, S.cerevisiae, etc. However the bacteria, being prokaryotes, do present limitations. These limitations can be overcome by using eukaryotic expression systems such as plant, insect or mammalian cells. However, they too have their fair share of issues, such as toxicity, yield etc.
- coli is by far the most widely used host for recombinant protein expression. It is easy to transform, requires inexpensive equipment for growth and grows quickly in simple media. Most often, E. coli produces adequate amounts of protein. The vectors in an E.coli expression system have the following basic structure: a transcriptional promoter, a ribosome binding site, a translation initiation site, selective marker (e.g., antibiotic resistance) and an origin of replication. Most promoters will have some basic background activity. Promoters regulated by the lactose operator/repressor will drive a small amount of transcription even in the absence of an added inducer like IPTG. Inducible expression gives finer control over transgene expression than a constitutive promoter (Slater et al.). IPTG (Isopropyl-β-D-thio-galactoside) is a well-known inducer of gene expression. The lac repressor (LacI) binds to the operator region of the lac operon, blocking RNA polymerase from binding and thus preventing transcription of the mRNA coding for the lac proteins. When lactose is present, allolactose binds to the lac repressor, causing an allosteric change in its shape. Thus, the lac repressor is unable to bind tightly to its cognate operator. This is induction, as opposed to repression. IPTG is an allolactose mimic that can be used to induce the transcription of genes being regulated by the lac repressor (Lewis 2005).
The workshop was carried out to analyse the cloned gene and express and purify Taq DNA polymerase. Taq DNA polymerase is a thermostable polymerase isolated from Thermus acquaticus by Thomas D Brock (Hein et al., 1876).
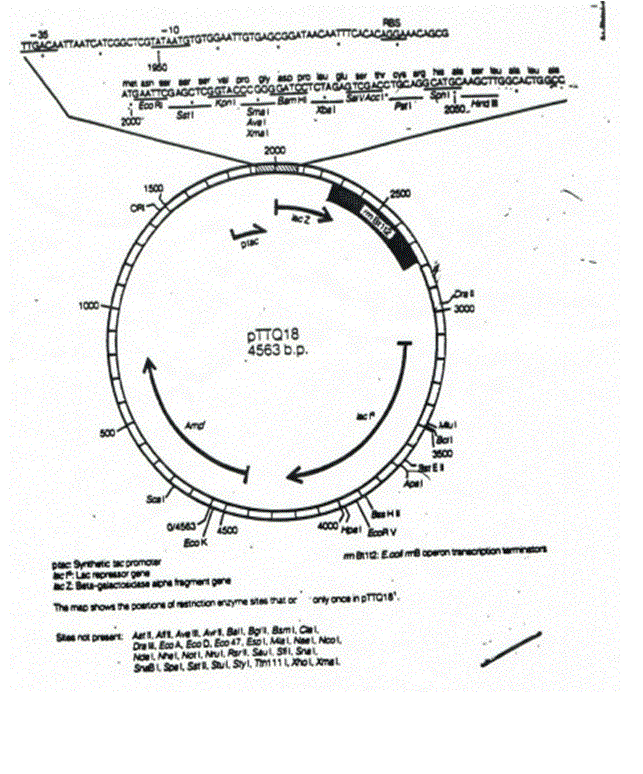
Figure 1 : pTTQ18 vector
The Taq polymarase was cloned into the pTTQ18 expression plamid vector for the purpose of the workshop.
Method
- Identification of Taq polymerase cDNA insert in pTTQ18 expression vector by restriction digestion
Digest 1: A 0.5 ml micro centrifuge tube was taken and labelled. Using a P20 pipette and keeping all reagents on ice, the following mixture was prepared in a 0.5 ml micro centrifuge tube:
DNA sample 2.0 µL
Ten x NEB buffer 4 2.0 µL
dH2O 16.0 µL
Total: 20 µL
The liquid was mixed by vortexing for 1–2 s. The tube was pulse spun in a micro centrifuge and incubated for 1 h in a 37 °C water bath.
Digest 2: A 0.5 ml micro centrifuge tube was taken and labelled. Using a P20 pipette and keeping all reagents on ice, the following mixture was prepared in a 0.5 ml micro centrifuge tube:
DNA sample 2.0 µL
Ten x NEB buffer 4 2.0 µL
EcoRI 1.0 µl
dH2O 15.0 µL
Total: 20 µL
The liquid was mixed by vortexing for 1–2 s. The tube was pulse spun in a micro centrifuge and incubated for 1 h in a 37 °C water bath.
Digest 3: A 0.5 ml micro centrifuge tube was taken and labelled. Using a P20 pipette and keeping all reagents on ice, the following mixture was prepared in a 0.5 ml micro centrifuge tube:
DNA sample 2.0 µL
Ten x NEB buffer 4 2.0 µL
BSA (1mg/ml) 2.0 µl
EcoRI 1.0 µl
XbaI 1.0 µl
dH2O 12.0 µL
Total: 20 µL
The liquid was mixed by vortexing for 1–2 s. The tube was pulse spun in a micro centrifuge and incubated for 1 h in a 37 °C water bath.
Preparing the sample and loading the gel
The tubes with the restriction enzyme digests from the 37 °C water bath were removed and pulse spun to remove condensation from the lid of the tube. A loading buffer of 3µL was added to each sample. The comb was removed from the agarose gel and the gel and tray were placed in the electrophoresis chamber, with the wells at the negative electrode. The chamber was filled with 0.5X TBE until the wells in the gel were just covered. In lane 1, 10 µL of the DNA size marker, Hyperladder I, was added. For the restriction enzyme digests, the loading buffer was mixed with the sample and 10 µL of sample was added to each well. Once the lid was in place, the power was switched on and set to deliver 100V. Once the electrophoresis was complete, the gel was placed on a UV-transilluminator to make visible the DNA bands. The position and size of the DNA bands in relation to the molecular size marker were duly noted.
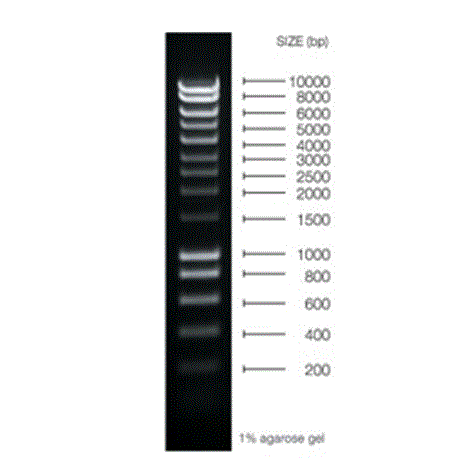
Figure 2: Hyperladder
- Induction of protein expression in E. coli culture
An overnight stationary culture was prepared as follows: two x 10 ml of LB-amp (100 mg/ml) was inoculated in sterile universal screw-cap tubes with 5 µl of stock culture carrying the gene of interest for expression (i.e. Taq recombinant protein in E. coli Novablue host cells). This was incubated at 37 ⁰C while being shaken (180 rpm) overnight. The overnight stationary culture was used to inoculate two x 60 ml LB-ampicillin medium in 500 ml conical flasks with 2 ml each. This was incubated at 37⁰ C while being shaken at 180 rpm for two to three hours until an optical density A600 of 0.4 was obtained. From the 3 ml of culture, 1 ml was aliquoted into another sterile universal screw-cap tube and labelled as the negative control. The remaining 2 ml of recombinant culture was induced with IPTG (100 mM stock) at a final concentration of 0.5 mM (10 µl obtained by the formula C1V1=C2V2) and labelled as the positive control. Both cultures were incubated for two hours at 37 ⁰C while being shaken at 180 rpm. When the incubation was complete, the 1 ml and 2 ml cultures were transferred to a 2 ml eppendorf tube, labelled accordingly and centrifuged for two to five minutes at high speed to obtain a bacterial pellet. The supernatant was discarded into the chloros beaker and the tubes were inverted on a paper towel to air-dry. This pellet was saved for the next step.
- Protein extraction from the induced culture and SDS PAGE Analysis
Pelleted cells of a positive control from a culture induced overnight with IPTG and a non-induced overnight sample were provided. Then, 200 µl protein extraction reagent (Bug Buster, Novagen UK) was added to each tube containing the bacterial pellets (2 h induction and negative control) and to the positive control and non-induced sample and vortexed to resuspend the pellets. The tubes were left to incubate on a rotating platform for ten minutes and then centrifuged at 16000 x g at 4 ⁰C for twenty minutes. The supernatant was retained. The supernatants were incubated at 75 ⁰C for ten to thirty minutes and then centrifuged at 16000 x g for five minutes. Four 1.5 ml Eppendorf tubes were labelled appropriately; 100 µl of the supernatant (soluble cell fraction) was transferred to the respective tube; and 20 µl of the five ample buffers were added to the bacterial lysate. The mixture was boiled for three minutes. During this process the lids of the tubes were left open to avoid a build-up of pressure.
SDS PAGE analysis
The SDS gel was made of the following:
- Stacking gel buffer (SGB, 0.5 M Tris): stacking gel is a five per cent gel made with stacking gel buffer. It contains 12.1 g Tris and up to 200 ml of H2O at pH 6.8.
- Lower gel buffer (LGB, 1.5 M Tris): This contains 36.3 g Tris, up to 200 ml of H2O at pH 8.8.
- 20 % Sodium Dodecyl Sulfate (SDS),: 20 g SDS, up to 100 ml in H2O
- 5% Ammonium Persulfate (APS)
- 5 g APS, up to 100 ml in H2O
The acryl amide, water, SDS and LGB were combined and mixed by swirling. APS and TEMED were added and the mix was swirled. The mixture was poured between plates to about two thirds, leaving enough room for a few centimetres from the bottom of the comb. Water (also saturated butanol) was added to make the top smooth. After a twenty-minute wait, the water (or butanol) was poured off. The upper gel was poured (five per cent gel) and the comb was inserted. This was left to rest for fifteen minutes.
Results
Result 1:
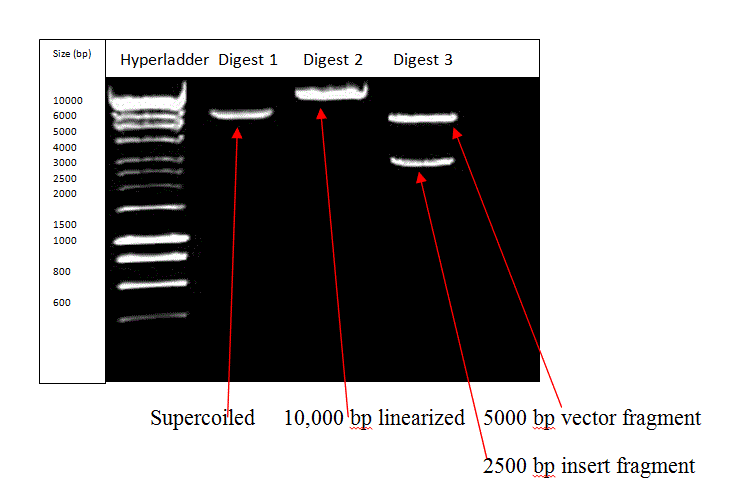
Figure 3: The gel indicating the insert size as 2500 bp
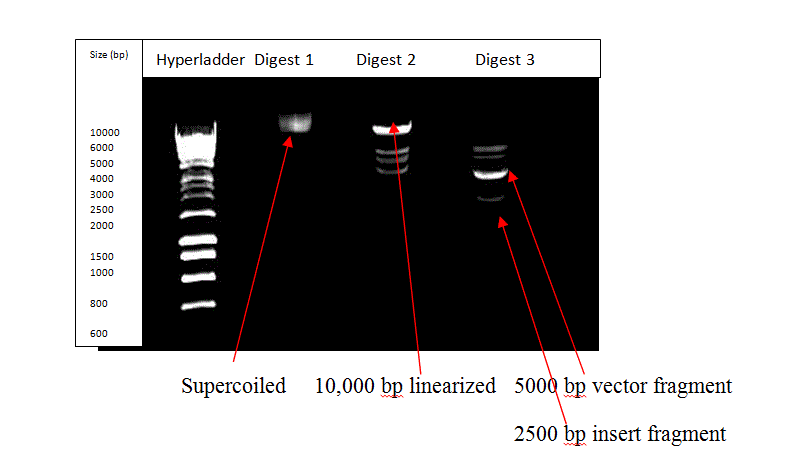
Figure 4: The gel meant to show the insert albeit with contamination
Figures 3 and 4 show the results obtained from carrying out restriction digestion of the pTTQ18 vector containing the Taq polymerase cDNA insert. Figure 4 shows the faulty gel with the probable presence of the intended bands. However, contamination resulted in freak bands in the third and fourth lanes. As seen from Figure 3, which is the correct image, the second lane shows the undigested supercoiled structure as a single band, as is expected when no restriction enzyme was used to treat the sample. The third lane contains the linearized single band at approximately 10,000 bp, as is expected due to single digestion by EcoRI. The fourth lane shows the double digest with the longer vector fragment at approximately 5000 bp and the slightly smaller cDNA insert fragment as the band at approximately 2500 bp. The contamination in the faulty gel could be due to non-sterile water being used during preparation of the sample or due to contamination of Digest 2 and Digest 3 samples with the hyperladder solution, due to poor lab technique. However, as confirmed from the paper by Ferralli et al., (Figure 1 A), the band at 2500 bp is indicative of the presence of Taq polymerase insert in the pTTQ18 vector.
Result 2:
Primer Design:
Sequence of the Gene Bank Entry J04639:
ATGAGGGGGATGCTGCCCCTCTTTGAGCCCAAGGGCCGGGTCCTCCTGGTGGACGGCCACCACCTGGCCTACCGCACCTTCCACGCCCTGAAGGGCCTCACCACCAGCCGGGGGGAGCCGGTGCAGGCGGTCTACGGCTTCGCCAAGAGCCTCCTCAAGGCCCTCAAGGAGGACGGGGACGCGGTGATCGTGGTCTTTGACGCCAAGGCCCCCTCCTTCCGCCACGAGGCCTACGGGGGGTACAAGGCGGGCCGGGCCCCCACGCCGGAGGACTTTCCCCGGCAACTCGCCCTCATCAAGGAGCTGGTGGACCTCCTGGGGCTGGCGCGCCTCGAGGTCCCGGGCTACGAGGCGGACGACGTCCTGGCCAGCCTGGCCAAGAAGGCGGAAAAGGAGGGCTACGAGGTCCGCATCCTCACCGCCGACAAAGACCTTTACCAGCTCCTTTCCGACCGCATCCACGTCCTCCACCCCGAGGGGTACCTCATCACCCCGGCCTGGCTTTGGGAAAAGTACGGCCTGAGGCCCGACCAGTGGGCCGACTACCGGGCCCTGACCGGGGACGAGTCCGACAACCTTCCCGGGGTCAAGGGCATCGGGGAGAAGACGGCGAGGAAGCTTCTGGAGGAGTGGGGGAGCCTGGAAGCCCTCCTCAAGAACCTGGACCGGCTGAAGCCCGCCATCCGGGAGAAGATCCTGGCCCACATGGACGATCTGAAGCTCTCCTGGGACCTGGCCAAGGTGCGCACCGACCTGCCCCTGGAGGTGGACTTCGCCAAAAGGCGGGAGCCCGACCGGGAGAGGCTTAGGGCCTTTCTGGAGAGGCTTGAGTTTGGCAGCCTCCTCCACGAGTTCGGCCTTCTGGAAAGCCCCAAGGCCCTGGAGGAGGCCCCCTGGCCCCCGCCGGAAGGGGCCTTCGTGGGCTTTGTGCTTTCCCGCAAGGAGCCCATGTGGGCCGATCTTCTGGCCCTGGCCGCCGCCAGGGGGGGCCGGGTCCACCGGGCCCCCGAGCCTTATAAAGCCCTCAGGGACCTGAAGGAGGCGCGGGGGCTTCTCGCCAAAGACCTGAGCGTTCTGGCCCTGAGGGAAGGCCTTGGCCTCCCGCCCGGCGACGACCCCATGCTCCTCGCCTACCTCCTGGACCCTTCCAACACCACCCCCGAGGGGGTGGCCCGGCGCTACGGCGGGGAGTGGACGGAGGAGGCGGGGGAGCGGGCCGCCCTTTCCGAGAGGCTCTTCGCCAACCTGTGGGGGAGGCTTGAGGGGGAGGAGAGGCTCCTTTGGCTTTACCGGGAGGTGGAGAGGCCCCTTTCCGCTGTCCTGGCCCACATGGAGGCCACGGGGGTGCGCCTGGACGTGGCCTATCTCAGGGCCTTGTCCCTGGAGGTGGCCGAGGAGATCGCCCGCCTCGAGGCCGAGGTCTTCCGCCTGGCCGGCCACCCCTTCAACCTCAACTCCCGGGACCAGCTGGAAAGGGTCCTCTTTGACGAGCTAGGGCTTCCCGCCATCGGCAAGACGGAGAAGACCGGCAAGCGCTCCACCAGCGCCGCCGTCCTGGAGGCCCTCCGCGAGGCCCACCCCATCGTGGAGAAGATCCTGCAGTACCGGGAGCTCACCAAGCTGAAGAGCACCTACATTGACCCCTTGCCGGACCTCATCCACCCCAGGACGGGCCGCCTCCACACCCGCTTCAACCAGACGGCCACGGCCACGGGCAGGCTAAGTAGCTCCGATCCCAACCTCCAGAACATCCCCGTCCGCACCCCGCTTGGGCAGAGGATCCGCCGGGCCTTCATCGCCGAGGAGGGGTGGCTATTGGTGGCCCTGGACTATAGCCAGATAGAGCTCAGGGTGCTGGCCCACCTCTCCGGCGACGAGAACCTGATCCGGGTCTTCCAGGAGGGGCGGGACATCCACACGGAGACCGCCAGCTGGATGTTCGGCGTCCCCCGGGAGGCCGTGGACCCCCTGATGCGCCGGGCGGCCAAGACCATCAACTTCGGGGTCCTCTACGGCATGTCGGCCCACCGCCTCTCCCAGGAGCTAGCCATCCCTTACGAGGAGGCCCAGGCCTTCATTGAGCGCTACTTTCAGAGCTTCCCCAAGGTGCGGGCCTGGATTGAGAAGACCCTGGAGGAGGGCAGGAGGCGGGGGTACGTGGAGACCCTCTTCGGCCGCCGCCGCTACGTGCCAGACCTAGAGGCCCGGGTGAAGAGCGTGCGGGAGGCGGCCGAGCGCATGGCCTTCAACATGCCCGTCCAGGGCACCGCCGCCGACCTCATGAAGCTGGCTATGGTGAAGCTCTTCCCCAGGCTGGAGGAAATGGGGGCCAGGATGCTCCTTCAGGTCCACGACGAGCTGGTCCTCGAGGCCCCAAAAGAGAGGGCGGAGGCCGTGGCCCGGCTGGCCAAGGAGGTCATGGAGGGGGTGTATCCCCTGGCCGTGCCCCTGGAGGTGGAGGTGGGGATAGGGGAGGACTGGCTCTCCGCCAAGGAGTGA
ORF of Taq DNA polymerase:
Coding:
5’-ATGAGGGGGATGCTGCCCCTCTTTG…………………………….GGACTGGCTCTCCGCCAAGGAGTGA-3’
Complementary:
3’- TACTCCCCCTACGACGGGGAGAAAC……………………………..CCTGACCGAGAGGCGGTTCCTCACT-5’
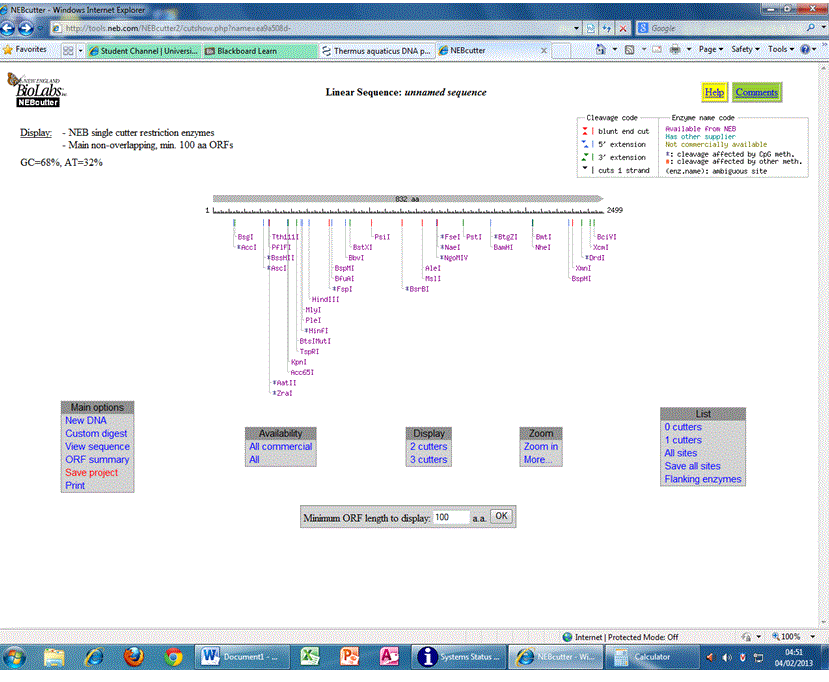
The CDS of this enzyme was checked to make sure that EcoRI and Xbal restriction sites are absent. NEBCUTTER (http://tools.neb.com/NEBcutter2/cutshow.php?name=ea9a508d- ) was the tool used for the same.
Figure 5: Restriction sites, their location and corresponding restriction enzymes present in Thermus aquaticus DNA polymerase (Pol I) nucleotide sequence
The forward primer was then designed by selecting the initial 21 bases of the ORF containing the start codon:
5’-ATGAGGGGGATGCTGCCCCTC-3’
Using the details of insert sites and multiple cloning sites of ppTTQ18 in the workshop manual (Fig 2), the EcoRI site (gaattc) was added.
5’- gaattc ATG AGG GGG ATG CTG CCC CTC-3’
The use of small cases for the designed EcoRI restriction site is to distinguish it from the sequence expected to anneal to DNA template of interest during replication using PCR. Then to ensure this was done in frame, the sequence was double checked with the amino acid residues they coded for;
5’- gaa ttc ATG AGG GGG ATG CTG CCC CTC-3’
5-Glu Phe Met……………………………………..
Two bases ‘gc’ and three bases ‘gtc’ were then added to the front and end of the restriction site, respectively .This gives the designed primer a protection of sorts, while preserving the restriction site during PCR and subsequent cloning. Another important consideration is that most restriction enzymes require two or three non-specific extra bases added to the 5’ end of the palindrome sequence to cut efficiently, leading to elongation of non-template specific region of the primer (Dieffenbach et al. 1993).
5’-gcgaattcgtcATG AGG GGG ATG CTG CCC CTC-3’
5- GluPheVal Met ArgGlyMetLeuPro Leu-3’
The forward primer finally is designed as:
5’-gc gaattcgtc ATG AGG GGG ATG CTG CCC CTC-3’
For the reverse primer, to ensure the C-terminal tag encoded by the vector is intact, the stop codon was excluded and 21 bases complementary to the coding sequence after the stop codon were obtained in an opposite direction to the forward primer –
5’-CTCCTTGGCGGAGAGCCAGTC-3’
Addition of XbaI site:
5’-tct agaCTCCTTGGCGGAGAGCCAGTC-3’
5- SerArgLeuPheArgArgGluThrLeu-3’
Next, addition of bases at both ends of the Xbal restriction site to give-
5’-gc tctagactgCTCCTT GGCGGA GAGCCA GTC-3’
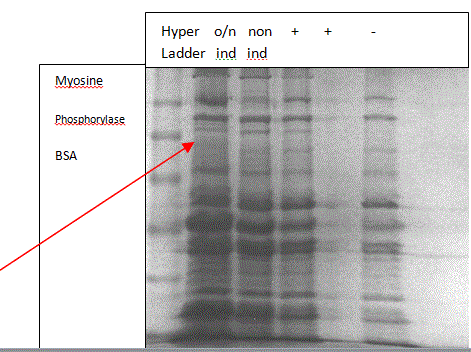
Result 3: Having used the Tris glycine buffer during the gel run and checking against the Ferralli paper, an attempt was made to obtain a faint band in the overnight IPTG induced positive control (lane 1) around a 100 kDa. This is because, according to Ferralli et al., (Figure 2), Taq DNA polymerase is around a 100 kDa on purification and the See Blue Plus2 Pre-Stained Standard has a band at 98 kDa corresponding to the protein BSA. It is expected that no bands will be seen in any of the other three lanes.
100kDa
Legend: o/n ind: overnight induced positive control
non ind: non-induced overnight
+: positive sample from week 2
-: negative sample from week 2
Figure 6: SDS PAGE to observe the outcome of induction
From Figure 6, it can be seen that a very faint band is obtained at about 100 kDa in the lane of overnight-induced positive control and no bands are obtained at that position in any of the other lanes. Thus, from the Ferralli paper (Figure 2), the SeeBlue Standard and the fact that IPTG is an efficient inducer (Hansen et al., 1998), it can be see that the band at 100 kDa is in fact that of Taq polymerase and that the induction was successful.
Discussion
A cloning vector is a small piece of DNA, most often from a virus or plasmid that is maintained in an organism and a foreign DNA fragment can be inserted in it for cloning. (Glick et al., 2005) An expression vector is a plasmid or virus designed to express proteins. The vector introduces a specific gene into a target cell, and causes protein synthesis to produce the protein encoded by the gene. The plasmid is engineered to contain regulatory sequences-enhancer and promoter regions, leading to efficient transcription of the gene (Walden et al., 1990). Cloning is generally done first using cloning vectors and the cloned gene may then be transferred to an expression vector, although it is possible to clone directly into an expression vector. The cloning process is normally performed in Escherichia coli. The promoters used in expression vectors are normally inducible, which means that the protein synthesis is only initiated when required by the introduction of an inducer such as IPTG. It’s much better to use an inducible promoter, rather than a constitutive promoter, as the level and timing of the gene expression can be finely controlled.
The workshop was carried out to identify Taq polymerase from within the plasmid vector and estimate its size. As Ferralli et al. worked out in their paper, Taq polymerase insert is about 2.5 kbp in size. This was successfully reproduced during the workshop when the plasmid carrying the cDNA insert was digested using EcoRI and XbaI. The first digest without any restriction enzyme was, of course, the negative control and hence a single band of supercoiled DNA was obtained. The EcoRI digest linearized the vector. The double digest with EcoRI and XbaI released the insert from the vector.
The native sequence does not contain the EcoRI and XbaI sites. Hence, while designing the primers, care was taken to introduce these restriction sites.
In order to induce expression of the protein in the E.coli culture, the culture was treated with IPTG. IPTG essentially inhibits the repressor and thus helps bring about protein expression. Also, the concentration of IPTG determines the level of expression (Hansen et al., 1998). Thus, the overnight-induced sample shows a faint band on a Tris glycine run at about a 100kDa. This, when checked against the Ferralli paper and the SeeBlue standard, confirms that the band is, in fact, that of Taq polymerase and that the IPTG induced its expression. No band is obtained in the un-induced sample, proving that the promoter remained inactive in the absence of IPTG and hence caused repression of the protein expression.
Protein expression could have been improved either by introducing an enhancer sequence or by adding a higher concentration of IPTG (0.5 mM was used for the workshop). If it was intended to purify the protein effectively from the bacterial lysate, one could have used affinity-chromatography combined with a fusion tag method in a single step without a protease addition (Shen et al., 2009). Other chromatographic or electrophoretic methods could also be used.
References:
- Definition: expression system. Online Medical Dictionary. Centre for Cancer Education, University of Newcastle upon Tyne: Cancerweb. 13 November, 1997.
- Slater, A., Scott, N., and Fowler, M. “Plant biotechnology the genetic manipulation of plants.”Oxford University Press.
- Lewis, M. (June 2005). “The lac repressor”. Comptes rendus biologies 328 (6): 521–548.
- Chien A, Edgar DB, Trela JM (1976). “Deoxyribonucleic acid polymerase from the extreme thermophile Thermus aquaticus”. J. Bact. 127 (3): 1550–7.
- Ferralli, P., Egan, J.D. and E, F.L. (2007). “Making Taq polymerase in the undergraduate laboratory.” BIOS 78(2): 69–74.
- Dieffenbach, C.W., Lowe, T.M., and Dveksler, G. S. (1993). “General concepts for PCR primer design”. Genome Res. 3: S30-S37
- Hansen, L.H., Knudsen, S., and Sørensen, S.J. (1998). “The effect of the lacY gene on the induction of IPTG inducible promoters, studied in Escherichia coli and Pseudomonas fluorescens“. Curr. Microbiol. 36 (6): 341–7
- Glick, B.R. and Pasternak, J.J. (2005). “Molecular Biotechnology Principles and Applications of Recombinant DNA”. 3rd ed. ASM Press Washington, D. C.
- Walden, R. And Schell, J. (1990). “Techniques in plant molecular biology-progress and problems”. European Journal of Biochemistry 192 (3): 563–76.
- Shen, A., Lupardus, P.J., Morell, M. Ponder, E.L., Sadaghiani, M., Garcia, C., and Bgoyo, M. (2009). “Simplified, Enhanced Protein Purification Using an Inducible, Auto processing Enzyme Tag”. PLoS ONE 12 (4):1-11
