Amazon Financial Analysis
Number of words: 3345
Task 1: Ratio Analysis
Profitability Ratios
These financial metrics are applied to evaluate the ability of the company to generate profits relative to the company’s operating costs, revenues, shareholder’s equity, and balance sheet assets. They include net profit margin ratio, operating profit margin ratio, return on assets, and return on equity.
Net Profit Margin
NPM = Net profit /Net Revenues
Amazon NPM from 2014 to 2018 are shown below; values are in millions.
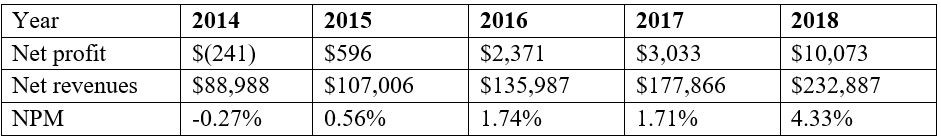
The graphical representation of the change in the net profit margin is shown below.
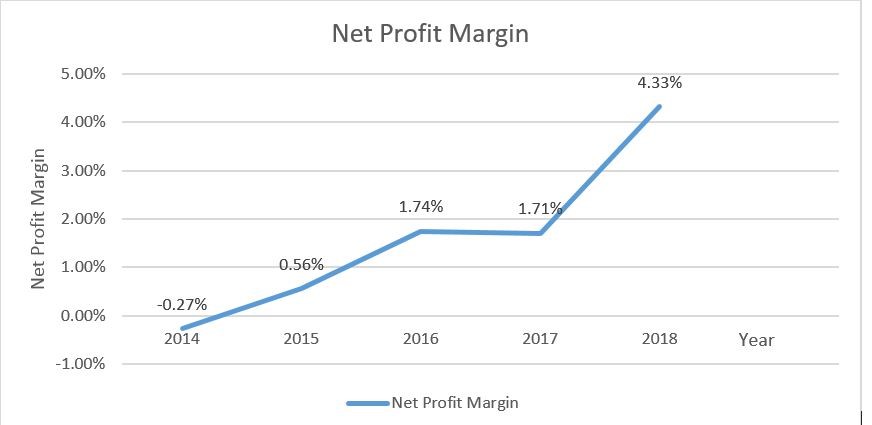
There has been an increasing trend in NPM from 2014 to 2016, implying the company’s efficiency in converting sales into real incomes. It is also an indication that Amazon is controlling its costs proficiently compared to the industry average. In all businesses, an increase in NPM is an indication of profitability (Mukhametzyanov and Nugaev, 2016, p.47). However, the NPM decreased slightly from 2016 to 2017, the 2018 increase to 4.33% would convince investors the company is doing well.
Operating Profit Margin (EBIT)
Operating profit = Operating Income /Net Revenues
Amazon OPM from 2014 to 2018 are shown below; values are in millions.
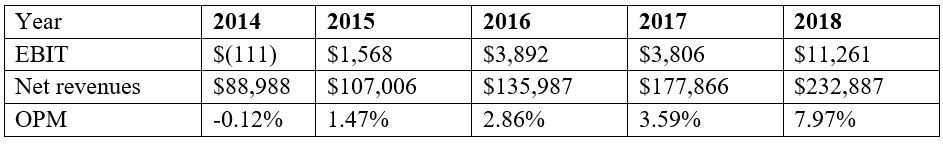
The graphical representation of the change in operating profit margin is shown below.
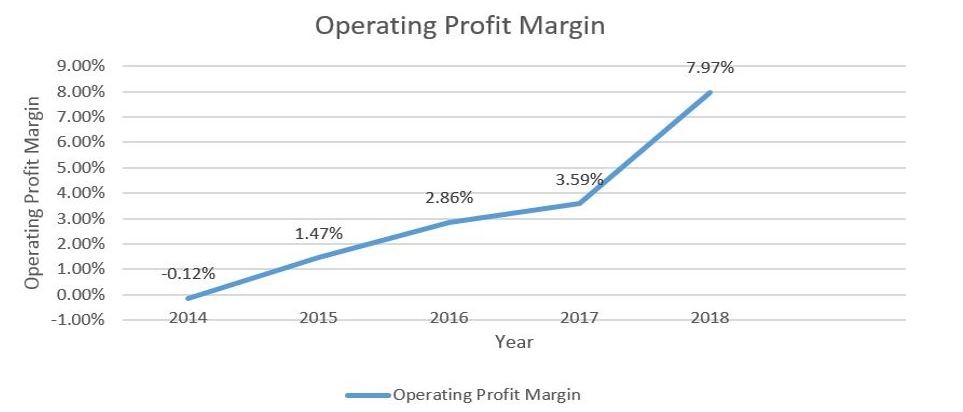
The ratio has shown an increasing trend implying Amazon has been making enough cash from operations to cover its fixed costs and variable costs (Mukhametzyanov and Nugaev, 2016, p.47). Investors can assess how Amazon is supporting its operations through this ratio.
Return on Assets
ROA = Net Income/Total Assets
Amazon ROA from 2014 to 2018 are shown below; values are in millions.
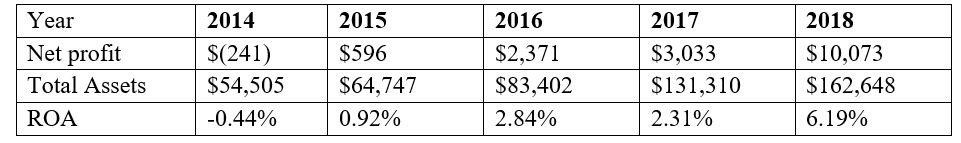
The graphical representation of the change in ROA is shown below.
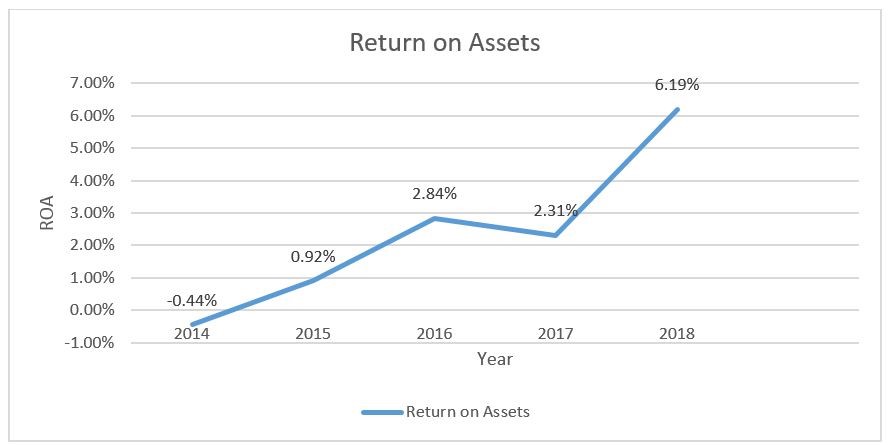
An increasing trend in ROA shows that the company is in control of business expenses and increased sales. Also, it shows that the company has wisely invested in debt capital (Robinson, 2020). The slight decrease in 2017 may have been associated with an increase in debt financing. The ratio shows shareholders how their assets are being used to generate income.
Return on Equity
ROE = Net Income/Shareholder’s Equity
Amazon ROE from 2014 to 2018 are shown below; values are in millions.
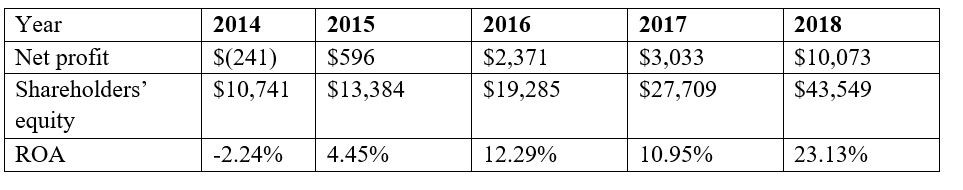
The graphical representation of the change in ROE is shown below.
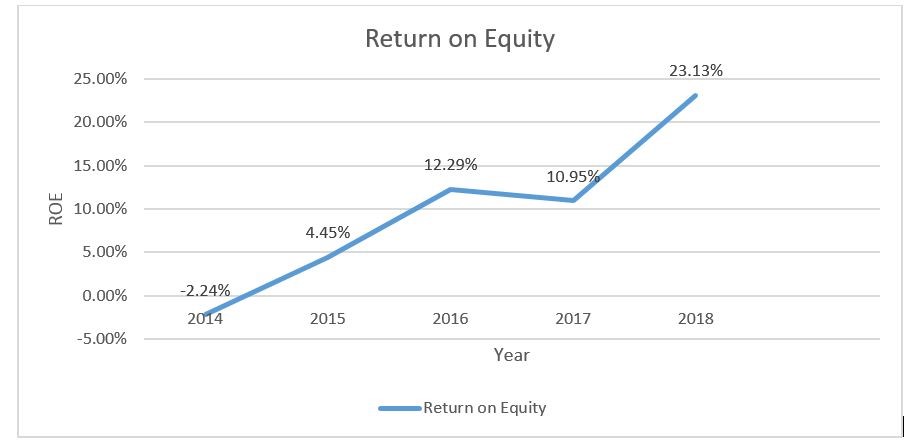
The ratio has shown an increasing trend. An increasing ROE implies that Amazon is increasing its capacity to generate incomes without the need for much capital. It tells shareholders their funds are efficiently utilized to generate profits (Robinson, 2020). Higher ROE means a higher value of the company to investors.
Liquidity Ratios
These are financial metrics which measure the ability of the company to pay off existing debt obligations without raising external finances. The ratios include current ratio and quick ratio
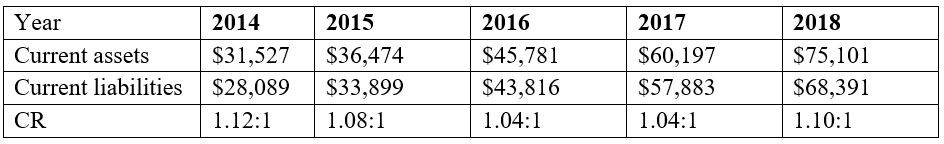
Current Ratio
CR = current assets/current liabilities
Amazon’s current ratio from 2014 to 2018 are shown below; values are in millions.
The graphical representation of the change in the current ratio is shown below.
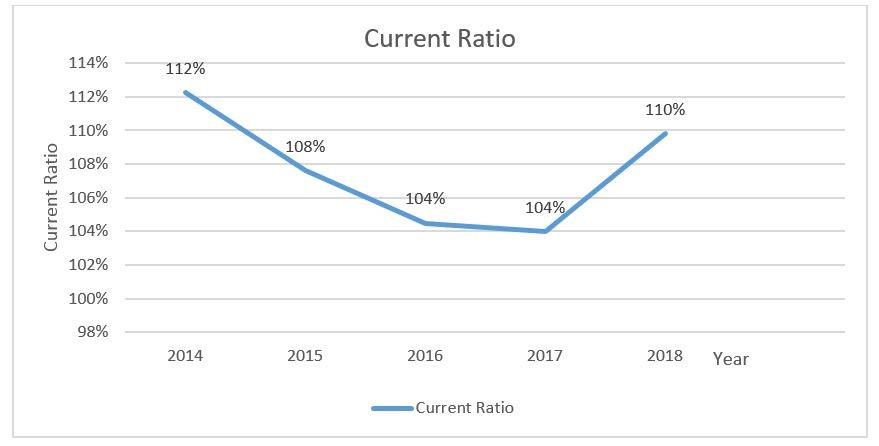
There has been a decreasing trend in the current ratio from 2014 to 2017. The drop may be linked to a reduction in current assets or a growth in short-term debt (Robinson, 2020). Current ratio tells creditors whether the company is capable of financing short term obligations.
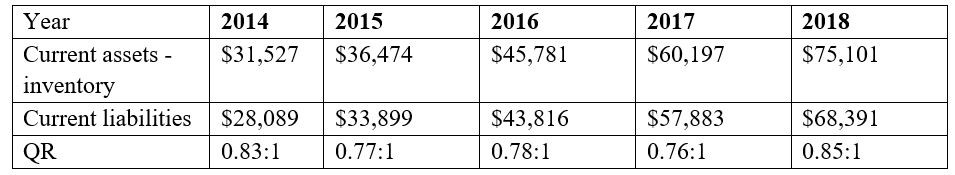
Quick Ratio
QR = (current assets – inventory)/current liabilities
Amazon’s quick ratio from 2014 to 2018 are shown below; values are in millions.
The graphical representation of the change in the quick ratio is shown below.
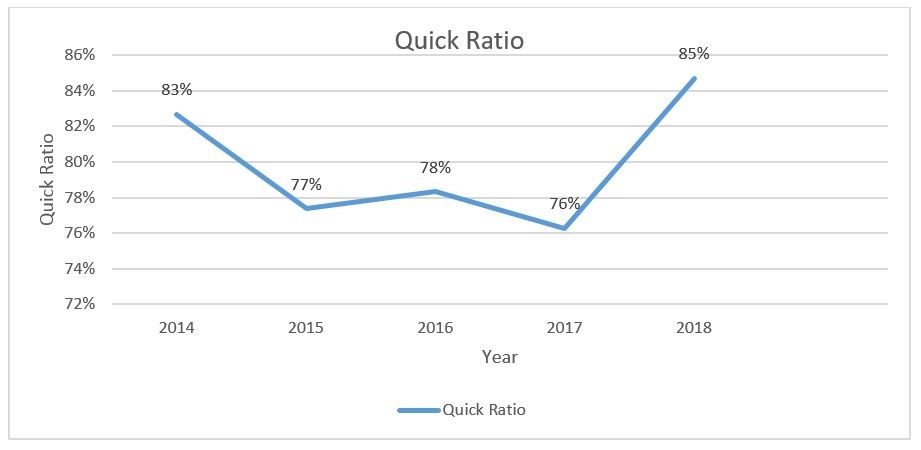
The ratio shows both decreasing and increasing trends. Increasing trend implies the company has enough cash to finance short term obligations while a decreasing trend shows there is minimal funds to finance such obligations. Creditors are interested in this ratio to see whether Amazon is capable of financing its short-term obligations.
Working Capital Efficiency
They measure the capacity of the company to utilize available assets and manage liabilities effectively. Such financial metrics include asset turnover ratio, debt turnover, and creditors turnover.
Net Asset Turnover Ratio
= sales/capital employed
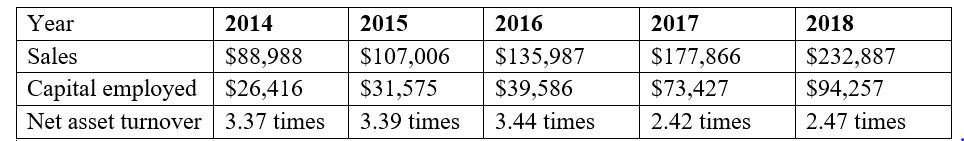
An increasing trend in net asset turnover is favourable as it implies the company is efficient using assets to generate sales. It gives creditors and investors an idea of ways in which Amazon is managed and utilizes available assets to generate sales.
Inventory Turnover
= cost of goods sold/average inventory
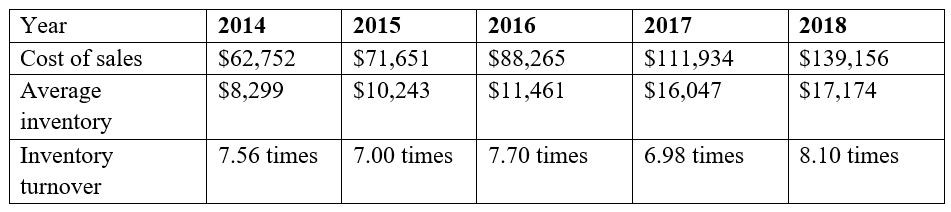
There has been an increase and decrease trend in this ratio. A higher turnover shows that the company is efficiently controlling its merchandise (Monahan, 2018, p.105-110). The ratio shows how effectively the company sells the inventory it purchases and to investors how liquid Amazon’s inventory is.
Debtor’s Turnover
= (debtors/sales) * 365
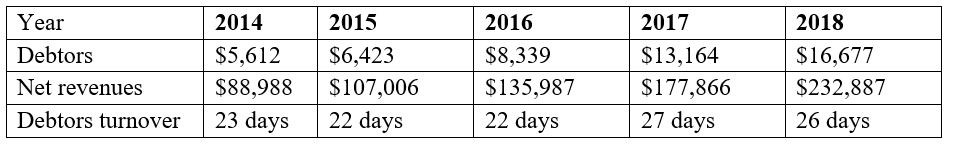
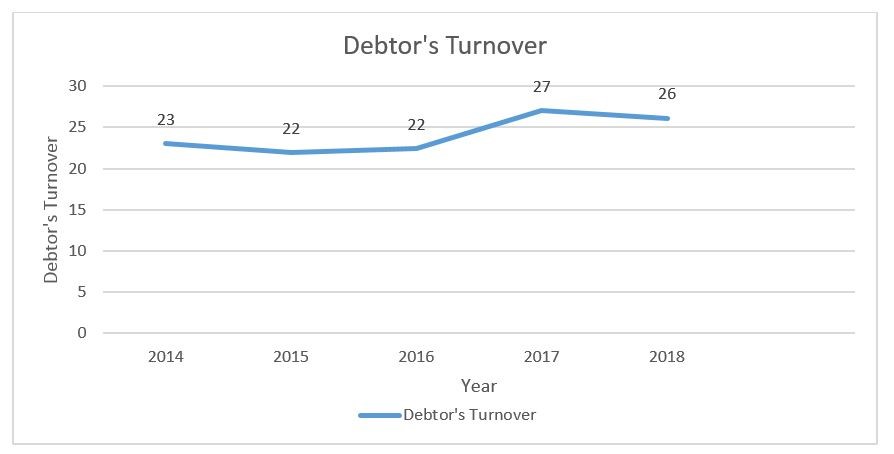
Fewer days show the company is efficient in collecting accounts receivables. It is also an indication the company operates mostly on cash terms. An increase in 2017 may have indicated bad credit policies or imperfect collection process. Investors compare the ratio with other corporations in similar business to determine the average turnover ratio (Monahan, 2018, p.1075-115). It proves a safer investment if other companies have a higher turnover ratio.
Creditor’s Turnover
= (creditors/purchases or cost of sales) *365
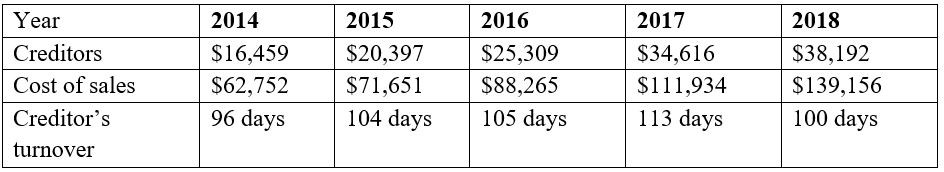
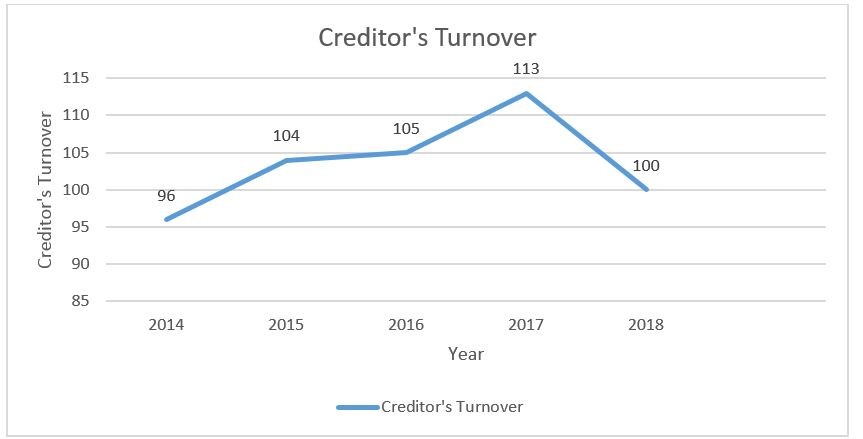
The ratio shows the rate at which Amazon is paying its short-term debts and suppliers. The ratio has shown an increasing trend meaning the company is taking longer to pay off accounts payable. It may also suggest that the company is in financial distress (Monahan, 2018, p.107-115). Creditors use the ratio to determine whether to extend credit to Amazon.
Long Term Financial Structure
Measure the relative level of debt load that the company has incurred. They include gearing ratio and interest cover.
Gearing
= Loan and borrowings/capital employed
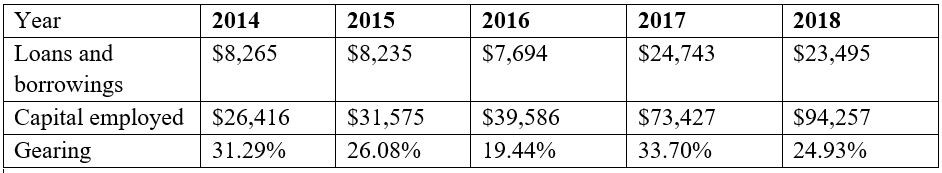
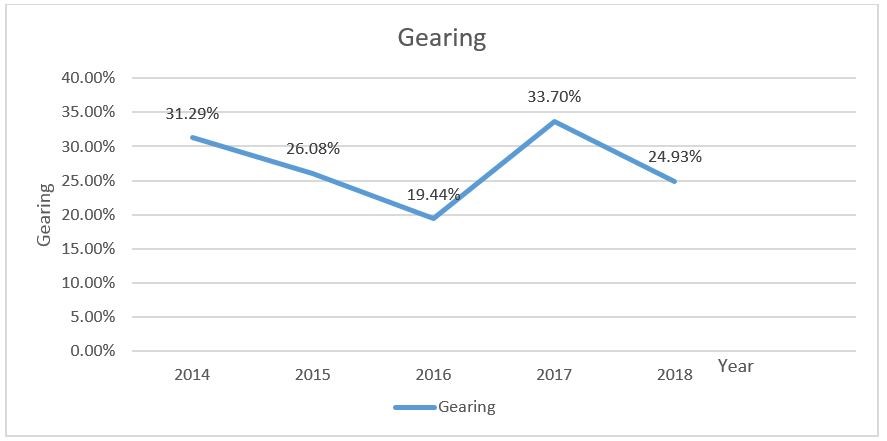
The ratio has been decreasing from 2014 to 2016, meaning the Amazon had been using less debt financing. An increase in 2017 is associated with increased debt in the 2017 balance sheet. Lenders are mostly interested in this ratio as higher gearing puts their loans of not being repaid (Monahan, 2018, p.115-120). For well-stablished companies, a gearing ratio of between 25% and 50% is perceived optimal.
Interest cover
= PBIT/interest charges
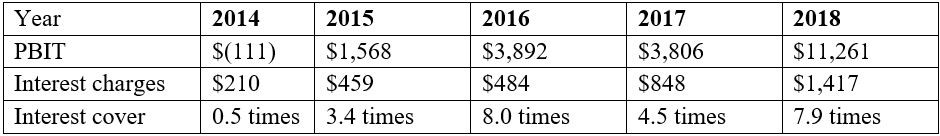
The ratio shows an increasing trend from 2014 to 2016, which implies the can cover interest expenses with available earnings. There is a significant decline in 2017 as a result of increased debt. A ratio of 1.5 or lower is questionable, and lenders want to know whether Amazon can finance its interest charged on loans.
Investors’ Perspective
These financial metrics evaluate the performance of the business in terms of dividend payment and growth. They include EPS and PR ratio.
Earnings Per Share (EPS)
= profit after tax / No. of ordinary shares
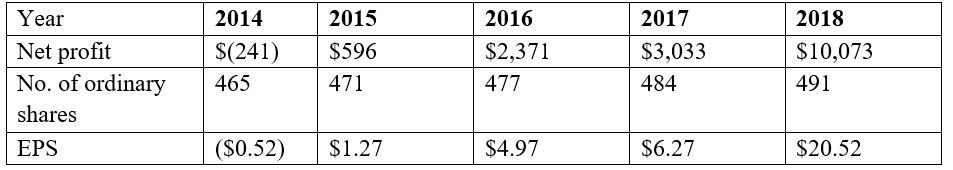
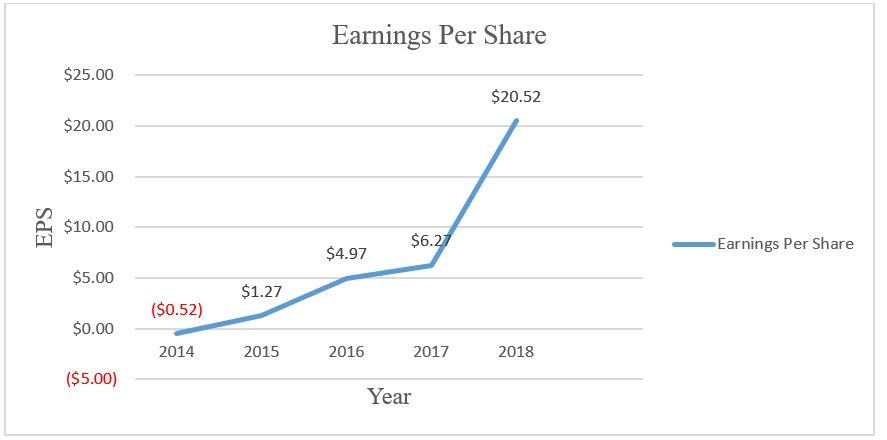
The ratio has shown an increasing trend, which is good for Amazon. Higher EPS means higher profitability and tells investors the investment is viable (Monahan, 2018, p.120-125). With high EPS, Amazon can expand by reinvesting profits, meaning a higher dividend for investors.
Price / earnings ratio
= Share price/EPS
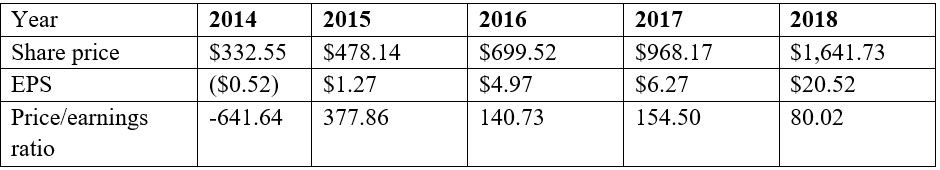
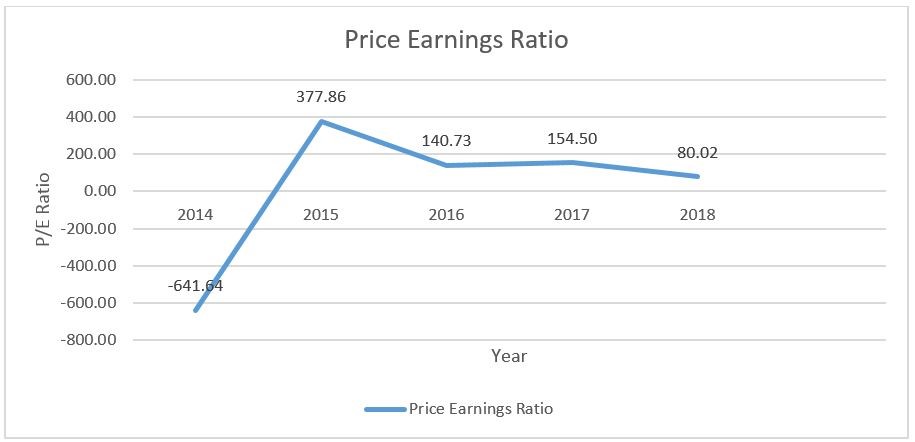
The ratio has been declining, meaning Amazon may be undervalued, or it is doing well compared to the past. Declining PE ratio indicate fall in prices or increased in volatility. Investors use the ratio to forecast future earnings.
Task Two: Recommendation to Investors
The analysis of Amazon ratios has shown interesting trends. It is evident that 2017 was not a good year for Amazon due to the decreasing trend in profitability and liquidity ratios. For current and potential investors of Amazon, I would recommend a buy option. When we look at the EPS trend, it has been increasing throughout, which is good for investors. This means dividends are increasing as the company is expanding. Also, there is a significant shift in net profit margin ratio from 1.71% in 2017 to 4.33% in 2018. This is a good indication that Amazon revenues are increasing, and the management is in control of expenses. It also implies the company is converting sales into profits and is more efficient in its operations. Current and potential investors would like to see a track record of increasing margins before they can make any investment decisions. For them, increasing trend in net profit margin implies better returns for their investments. The same trend has been noticed in the operating profit margin ratio meaning Amazon is in control of its business expenses. From the PE ratio, the decreasing trend shows that the company may be possibly undervalued or there has been an increase in business risks or fall in prices for products. This trend is not significant for investors as profits have been increasing over years. (Monahan, 2018, pp.200-215). Thus, it is high time for investors to buy as in coming future, share prices would have increased marginally.
Task Three: Amazon Supply Chain Management Practices
Over time, Amazon has revolutionized retailing activities through the application of bold supply chain approaches as well as the implementation of innovative technologies. The company is shaping the supply chain, thus gaining a competitive edge compared to its competitors like FedEx and UPS. This is through relentless innovations and swift global expansion. When the company was founded, its revenues were under $7 billion, but in 2018, they increased to $233 billion. During the fiscal year 2019, revenues increased by 25%. Such an increase has been associated with changes made in the supply chain.
Amazon introduced the Amazon Prime service, which enabled consumers to obtain their goods within two-day delivery by paying an annual membership fee. This strategy was a game-changer in the retail industry and enabled Amazon to dominate over competitors across the globe (Leblanc, 2019). After competitors developed their two-day shipping strategy, the company overturned the playing service and began providing one-hour delivery services to customers. Today, it switched to offering free two-hour delivery. Such strategies have made competitors struggle to catch up with their innovative strategies.
Supply Chain Management
The company adores a cult following, which is a preferred choice for customers for essential reasons; it is an efficient and quick supply chain management. The integration of extensive warehouse networks, complex information technology, effective transportation, and multi-tier inventory management makes the supply chain of Amazon the most efficient compared to other major retailers worldwide. The supply chain of Amazon relies intensely on outsourcing of its inventory control. Usually, goods that are infrequently ordered by customers are not stored in ordinary warehouses. As a result, third-party sellers are responsible for such inventory management and have thus contributed to about 82% of sales (Leblanc, 2019). Due to an efficient logistics system, same-day shipping has been possible. The company recognizes the lengthy time involved when dealing with third-party logistics. Thus, they use their own delivery vehicles to facilitate the one-hour delivery system.
The warehouses of the company are strategically positioned and stocked and have been moving closer to urban areas. Therefore, Amazon utilizes a pure push approach for goods in stores in the warehouses, projecting market for the particular region. In addition, it applies a pure pull approach when selling goods from third-party retailers, thereby applying an order-by-order satisfaction technique. For the company’s supply chain success, the number, size, and location of warehouses are vital factors.
Automation
Amazon purchased Kiva Systems which provides robotic and computerized warehouse resolutions. Now known as Amazon Robotics, after rebranding, the company offers solutions to warehousing issues. Such robots do not require human assistance and thus pick and pack, enabling warehousing activities to be completed incredibly quickly (Li and Liu, 2016, p.48). In contemporary times, Amazon robots are being designed to bring products to individuals for picking an order. It is forecasted that the next robot generation would pick orders without human interaction (Leblanc, 2019). Even though Amazon has been increasing its robots’ army, other retailers have been following suit.
The future of Amazon’s supply chain has been based on its prime air invention. This entails the use of drones for delivery services. According to CEO Jeff Bezos, such drones would deliver under five pounds’ packages to locations within ten miles in less than thirty minutes. However, there are many risks and challenges associated with realizing this dream. In 2017, Amazon announced it would develop a self-destructing drone to keep people safe during flight is required (Leblanc, 2019). There is no specific date as to when the company will launch the Amazon Prime Air, but the system would prove that the company is dedicated to leveraging almost every available supply chain technology to maintain its top position in the retail industry.
Manufacturing
Amazon produces many products such as iPhone chargers, batteries, Bluetooth speakers, backpacks, among others. It manufactures lower-cost products to challenge existing market prices. Also, amazon white labels products from other vendors. Production of its products enables the company to own the entire lifecycle of its products (Hong, Zhang, and Ding, 2018). Recently, Amazon acquired Whole Foods. This is an indication the company wants to changes the food delivery game (Cusumano, 2017, pp.24-26). It is also a declaration that the company intends to embrace brick-and-mortar retail. It is an effort by the company to join traditional retailing and e-commerce techniques. The unique supply chain strategies of Amazon and constant technological inventions have transformed how ordinary supply chain works (Kumar, Tiffany, and Vaidya, 2016, pp.639-650). As a result, no competitors can guess where the company’s next innovation project would arise.
Downsizes in a Turbulent Economy
The supply chain has been in existence since 1940, and some contemporary aspects of the supply chain utilize supply chain theories or comparatively innovative methods like Amazon (Banerjee, 2016). The company’s supply chain approaches have broadly differed with supply chain theories and methods. For instance, the channel coordination method of supply chain involves various intermediaries in the logistics process. The flow chart begins from suppliers, transportation, manufacturer, transportation, and then retailers. This lengthy chain is costly and products are over-priced to cover such costs (MacCarthy, Blome, Olhager, Srai, and Zhao, 2016). Amazon does not apply this method. In fact, products are shipped directly from the warehouse to the consumers making it cheap and efficient. Even though Amazon applies the theories of constraints, it does not wait for setbacks to occur to develop solutions (Kumar, Tiffany, and Vaidya, 2016, pp.650-665). Instead, they are always looking for innovation ideas to streamline their supply chain process. Also, the application of total quality management (TQM) is different. TQM uses reverse logistics to ensure improved customer satisfaction. Typically, TQM recommends outsourcing reverse logistics to access more extensive shipping networks and improve automation (Banerjee, 2016). However, in Amazon, robots have been incorporated in the supply chain to manage inventories. Thus, the company does not need to outsource its reverse logistics. Amazon has been avoiding the benefits of utilizing 3PL providers for logistics purposes, instead, it developed its logistics fleet. Other companies are attempting to insource deliveries to enjoy various benefits. Amazon’s supply chain approaches contrast with the traditional theories of the supply chain as it does not apply the methods stated in such models. Instead, it invents its own methods to stay on the game in the retail industry.
In the supply chain, risks are usually associated with the delivery of products to customers in terms of impact on the image, timely delivery, and costs. Amazon has been able to deal with time issues by developing two-day free delivery. However, some other external risks cannot be avoided. For instance, using Amazon Prime Air may become a threat to the human population in case such objects are out of control. Using different supply chain methods other than traditional methods are risky to the specific company. In case unforeseen issues arise in the chain, the traditional models cannot resolve due to a lack of predetermined solutions. For instance, there is a global pandemic of COVID-19 which has affected the supply chain of Amazon. Companies globally are stopping production, cancelling orders, and closing shops (Baldwin and Tomiura, 2020, p.59). Workers have also been sent home. This is an issue which Amazon cannot resolve through supply chain models as is was unpredictable. As a result, there is nothing the company can do except wait until the pandemic is over in order to resume with normal supply chain practices. As a result, the risk can lead to companies downsizing, leading to adverse effects on the turbulent economy like job loss, hence decreased GDP.
References
Baldwin, R. and Tomiura, E., 2020. 5 Thinking ahead about the trade impact of COVID-19. Economics in the Time of COVID-19, p.59.
Banerjee, K., 2016. How Amazon Is Transforming Supply Chain Management – Intellitrack. [online] IntelliTrack. Available at: <https://intellitrack.com/resources/blog/amazon-transforming-supply-chain-management/> [Accessed 4 April 2020].
Cusumano, M.A., 2017. Amazon and whole foods: follow the strategy (and the money). Communications of the ACM, 60(10), pp.24-26.
Hong, J., Zhang, Y. and Ding, M., 2018. Sustainable supply chain management practices, supply chain dynamic capabilities, and enterprise performance. Journal of Cleaner Production, 172, pp.3508-3519.
Kumar, S., Tiffany, M. and Vaidya, S., 2016. Supply chain analysis of e-tailing versus retailing operation–a case study. Enterprise Information Systems, 10(6), pp.639-665.
Leblanc, R., 2019. How Amazon Is Changing Supply Chain Management. [online] The Balance Small Business. Available at: <https://www.thebalancesmb.com/how-amazon-is-changing-supply-chain-management-4155324> [Accessed 4 April 2020].
Li, J.T. and Liu, H.J., 2016. Design optimization of Amazon robotics. Automation, Control and Intelligent Systems, 4(2), p.48.
MacCarthy, B.L., Blome, C., Olhager, J., Srai, J.S. and Zhao, X., 2016. Supply chain evolution–theory, concepts and science. International Journal of Operations & Production Management.
Monahan, S.J., 2018. Financial Statement Analysis and Earnings Forecasting. Foundations and Trends® in Accounting, 12(2), pp.105-215.
Mukhametzyanov, R.Z. and Nugaev, F.S., 2016. Financial statements as an information base for the analysis and management decisions. Journal of Economics and Economic Education Research, 17, p.47.
Robinson, T.R., 2020. International financial statement analysis. John Wiley & Sons.