A report looking at vulnerability to weather and future adaptation procedures.
Executive summary
The Project Green Placement involved undertaking a Local Climate Impacts Profile at Newcastle-under-Lyme Borough Council. The report looked at vulnerability to weather and future adaptation procedures. Over the past 10 years, Newcastle has bared witness to 55 weather-related events. The majority of these have been surface water flooding occurring in the local vicinities of Kidsgrove, Silverdale and The Rookery.
Whilst the UK Climate Impacts Projections inform us that it is going to be 30% wetter during the winter months (UKCIP, 2009), we must prepare for the eventuality of flooding.
It is suitably advised that all services within the Newcastle area acknowledge their vulnerability to weather-related events by conducting a risk assessment and advocating both the Environment Agency’s Flood Warnings and The Met Office’s advanced weather warnings. Emphasis should be placed on collating weather events and their incurred costs to ensure a less equivocal approach.
Emergency planning and awareness sessions developed by the Civil Contingencies Unit should be made known by business directorates. Staff should have a greater awareness of the risks they may face, and the greater need for multi-agency communication and ensuring business continuity during extraordinary circumstances.
Introduction
Newcastle-under-Lyme Borough Council is a local authority within Staffordshire. It lies juxtaposed with the neighbouring Stoke City Council and Staffordshire County Council. The area rose to prominence during the industrial revolution, where it was intensely mined for its lucrative coal deposits. The area’s mining legacy is now obsolete.
The Environment Act was conceded in 2008. This was the first endeavour of the government to acknowledge within local communities, that our climate is changing due to anthropogenic activity. Additional pieces of legislation were passed which included a list of government-led national indicator schemes, which take into greater consideration the environment and our impacts upon it. The most crucial of these was national indicator 188 – Planning to Adapt to Climate Change, which is a process-based indicator designed to measure progress (from Level 0-4) in preparedness in assessing and addressing the risks and opportunities of a changing climate. The aim is to embed the management of climate risks and opportunities across all levels of services – (UKCIP 1, 2009). The major derivative of this is the Local Climate Impacts Profile or LCLIP.
A LCLIP aims to provide ‘an understanding of current vulnerability to weather and climate, which can be a powerful catalyst to further awareness and action’ – (UKCIP 2, 2009). The study involves researching a geographic area’s past experiences with extreme weather, and researching this data through liaising with services directly involved. The study aims to encourage resilience and wider awareness at the risks and opportunities that climate change will pose. Weather can create a myriad of problems for service areas, the ability to deal with these in a logical and consistent manner is critical to maintaining business continuity. Future climate scenarios are devised by the UK climate impact projections organisation.
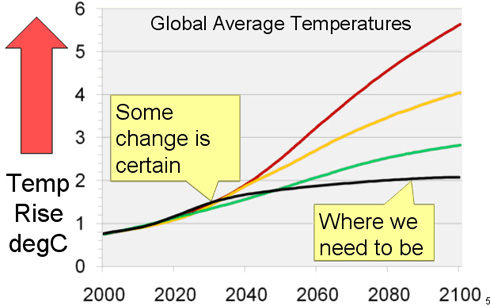
Fig 1. Climate change has three possible scenarios: low, medium or high. In the UK we have committed to cut CO2 by 80%, by 2050 – (Planet Earth, 2008). In the above graph, this is depicted by the black trend line.
Climate change is inevitable; we cannot prevent it from happening. What we can prevent is the severity of its impacts. We must act now, to protect our future – (The Pitt, 2008). Adaptation is the only response available for the impacts that will occur over the next several decades before mitigation measures can have an effect – (Stern Review, 2006).
“The benefits of strong, early action on climate change outweigh the costs” – (Stern Review, 2006).
The LCLIP report is typically researched, written and finalised in 10 weeks, after which, distribution to key services can occur. The completed report contains a list of recommendations on how further adaption can be devised and suitably implemented to avoid significant monetary losses in the future. By producing the report and exhaustively making its findings well known to the local strategic partnership, it is hoped that the Newcastle-under-Lyme region will make the necessary endeavours to increase its resilience to climate change.
Methodology
The study involved conducting a media trawl of notable weather events that had affected Newcastle-under-Lyme (or the immediate area) over the past 10 years. For completeness, anything occurring in close proximity to the Borough (under a mile) was also logged for consistency. Whilst the study is only strictly pertaining to the Newcastle area, it would be illogical to discount a serious disaster which was only less than a mile away. By and large, such weather would also have impacted on Newcastle, but to a lesser degree. Newspaper publications seemed to vaguely categorise stories as occurring within the larger authority of Stoke-on-Trent. By 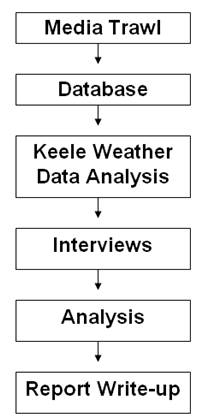 consulting various local and national publications a database was created, in which these events were recorded. A few discrepancies arose over the gaining access to all published newspapers from 1999-2009. Newcastle’s library had ownership of the majority, with a few arbitrary copies on microfiche. These were all studied extensively and were ranked in order of: ‘severe’ or ‘significant’.
After acquiring weather data from a local Weather Station at Keele, work began on grouping and summarising this meteorological data for significant anomalies and trends. There were varying consultations with the Met Office and Western Coyney Weather Station, these were either unreturned or required a large payment in order to obtain the corresponding applicable West Midlands data.
After both the newspaper findings and the weather data had been collated onto a database a plethora of telephoning began, placing enquiries with relevant services to see if they had any recollection of these events. Many correspondences were deemed unsuccessful or were unreciprocated. It was discovered that many services operated on an umbrella principle, that is to say that one supervisor would be in control of a quite a number of people. Trying to ascertain who was deemed appropriate was extremely exasperating and required a great deal of perseverance to see it through to fruition.
In result of gaining an unequivocal delegate from the appropriate service area, an interview was arranged to ascertain their knowledge and involvement in the identified weather events. In retrospect, these were largely unknown or such recollection was held within another member of the organisation. A series of interviews were conducted with delegates from:
- The Fire Service
- Severn Trent Water
- The Environment Agency
- Internal employees at Newcastle-under-Lyme Borough Council
- Staffordshire County Council’s Highway Department
- The University Hospital of North Staffordshire
- North Staffordshire NHS
The interview process helped to elucidate on awareness and risk within the organisation. The most visceral of all the findings was that no service area (other than the Fire Service), actively collated or retained data on when their service had been affected by weather. Trying to augment previously researched data was virtually impossible. Services were extremely helpful, and promised to pass on any relevant data they had.
After these interviews had been assembled, conducted and recorded, a series of recommendations was devised for each. The report was then written in accordance with the LCLIP’s template, but redeveloped to suit the context of the Newcastle study.
Results and interpretation
The Newcastle LCLIP discovered that over the past 10 years, there have been 55 weather events, all considered significant or severe. 2006 was discovered to be the warmest on record (The Guardian, 2006). Whilst 2007 was the wettest on record, with widespread flooding (BBC, 2007).These weather events manifest themselves predominately in the form of surface water flooding. These originate from a drain blockage or the impermeable properties of the urban environment. All have mainly transpired around the vicinity of Kidsgrove and Silverdale, with continual investigations by hydrologists to interpret the cause of these frequent inundations.
One property in Kidsgrove, on Long Lane, has been subject to intense flooding – six times within the past decade (The Sentinel, 2008). The owner has attributed this surface water run-off to the removal of a drainage ditch adjacent to his property. Although a culvert system has been put in its place, this ceases to rectify the troublesome issue.
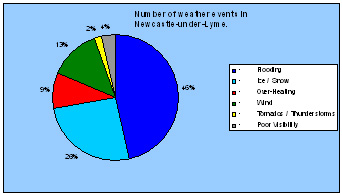
(Fig 1. Showing the number of weather events recorded as a result of the LCLIP.)
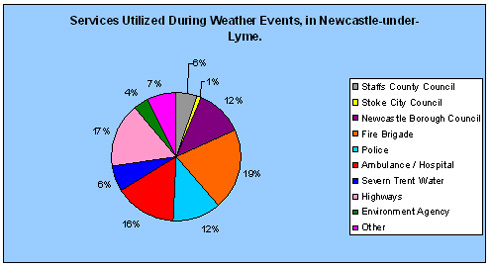
(Fig 2. Highlighting the services involved in responding to weather events.)
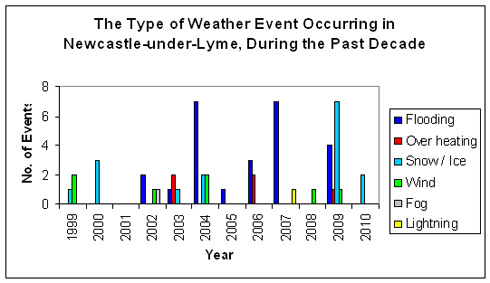
(Fig 3. Shows the type of weather event, and the year it occurred.)
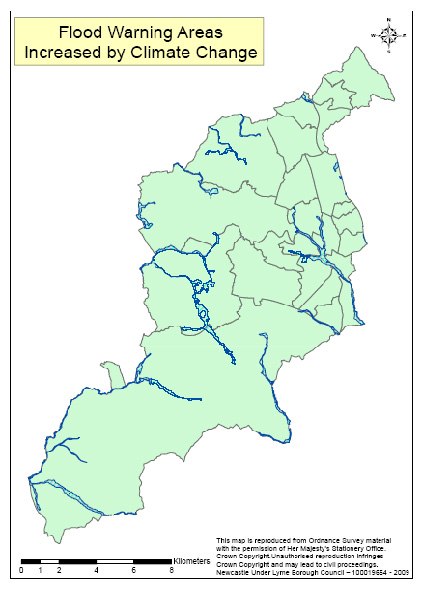
(Fig 4. Created using GIS, the above map is a collaborative summary of the areas most at risk from fluvial flood risk in future scenarios – NULBC, 2010.)
Snow and ice have been particularly hazardous in the past two years. In regards to future climate predictions, we are likely to see warmer winters and less snow and ice events. There have been notable incidents of extreme heat recorded for the LCLIP; these have not resulted in any fatalities. In reality, they have been the antithesis of this; warmer temperatures provide improvements to the tourism and catering sectors, and bring significant economic prospects to the Borough. It is important to emphasise the ancillary benefits too. Climate change will bring both identifiable risks and opportunities.
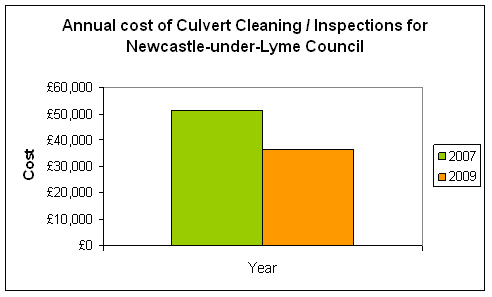
(Fig 5. 2007, the wettest year on record, incurred a 42% increase in Council cleaning costs in comparison with 2009.)
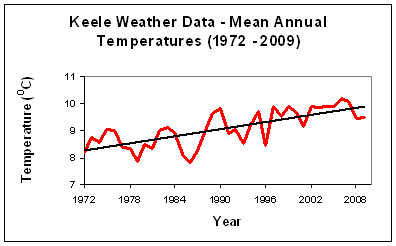
(Fig 6. In conjunction with the regional weather data, our climate in Newcastle-under-Lyme is clearly getting increasingly warmer.)
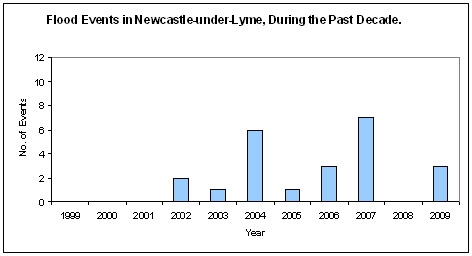
(Fig 7. Detailing flood events and the year they occurred in Newcastle. Immediately it can be observed that 2007 correlates with the severity of rain witnessed nationally.)
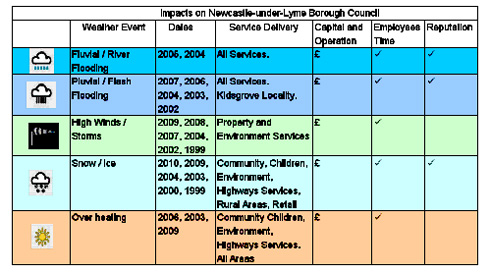
(Fig 8. Summarises the identified consequences associated with severe weather and the influence on services.)
There were significant constraints within the study. Firstly, the suggestion of attributing a cost to each weather event on a service area was just not feasible – 1) in regards to the time-scale constraint; 2) The information was not always readily available, and there would be no logical approach in which to make it fully representative of the service or to be a conclusive way of highlighting the significant losses, due to negligible data being supplied.
The methodology of the study presented a number of limitations. Many identified events were irrelevant or inconclusive to the report. The interview process should have helped to shed light on any discrepancies – this was often not the case. There was an inconsistency within departments on obtaining such data, and if any knowledge on such an event existed, the member of staff aware of this was no longer employed here, and the whereabouts of the data became unidentified.
Recommendations
The issue of climate change needs to be emphasised within all sections of the Council. During the liaison process a lot of dissonance was expressed. Steps should be taken to discourage this and only provide necessary facts – employees should not feel dictated into doing things – instead the motive behind such actions, and the wider implication of global warming should be expressed implicitly.
At present the Council is lacking a department which explicitly deals with climate change, currently only one staff member is assigned to carry out an abundance of work relating to climate change, which does not plays an integral role within the Council and the community it serves.
Climate change development should be superseded with councillor representatives who will succeed in communicating and highlighting such issues within the wider community. In particular, aim to educate and highlight key issues in a variety of sources such as: articles in local press; within the Council’s ‘Voice Magazine’; posters within community halls and schools; articles on the webpage (both internally and externally); through local campaigns e.g. greening campaign and energy; stalls at the weekly market.
Ensure targets depicted within the Council’s Energy Efficiency and Climate Change Strategy and Newcastle Flood Plan be adhered to and modified routinely (NULBC, 2010).
Regular risk assessment and business continuity strategies should ensure they address responses to flooding events and climate change. All future endeavours appreciate and respond to adapting and mitigating future climatic risks.
Increased training of staff in emergency response and procedures, business continuity, flood planning, multi-agency working and rest centre training would all be beneficial, as would an increase in budgets for each of these. All relevant departments should critically appraise the Pitt Review, following the 2007 floods.
There is still room for an improvement in communication between the various agencies involved in responding to events. Data should be freely distributed amongst services and not restricted in any way. In regards to Kidsgrove flood events, from a risk analysis point of view, future work could include calculating recurrence intervals for events, flood mapping (particularly with reference to flash flooding) and further investigation into culverts and drainage networks and the possibility of SUDS implementation.
Due to the sheer frequency of flood events in Kidsgrove and residents having to take matters into their own hands, perhaps there should be consideration measures in place to make sure these residents are exempt from paying for additional sandbags if the severity of flooding increases (the Council provide six for free), and these should be located in or around Kidsgrove for easy distribution, particularly if resident’s mobility is compromised. Some sandbag provision locally in Kidsgrove would be ideal.
In conjunction with the UKCIP findings, the council and LSP should participate in a ‘Heat wave Scenario Planning Exercise’, which would complement the previous Civil Contingency Planning on White Water and Emergency Planning. Given our future climate scenarios are mainly signifying a warmer climate; it would make sense to address such issues immediately.
There is the immediate issue of budgeting and funding for such prior planning. This will require a greater reliance on government funding if such procedures are to be successfully implemented.
Conclusion
The Local Climate Impacts Profile has provided a clear body of evidence of Newcastle’s resilience to climate change scenarios. The majority of financial costs are not quantified, and staff time in dealing with such events is not collated either. Trying to obtain such data would be impossible, giving the obvious time constraints. Whilst this has not resulted in a very conclusive report; it has given sufficient recommendations to services for improving their resilience. Strategically, a more proactive approach towards managing the impacts of severe weather will become an obligatory requirement. The establishment of the LCLIP has been extremely valuable to Newcastle Borough Council. Firstly, it forms a baseline for future monitoring initiatives. It helps to raise awareness on the effects of weather on each locality. The finalised report will contribute to implementing Newcastle’s Energy Efficiency and Climate Change Strategy and provides prerequisite substantiation towards the completion of National Indicator 188 – Planning to Adapt to Climate Change.
Reference list
BBC, 2007. Summer Weather Wettest On Record. http://news.bbc.co.uk/1/hi/uk/6916724.stm
The Independent, 2010. UK winter the coldest since late 1970s.
http://www.independent.co.uk/news/uk/home-news/uk-winter-the-coldest-since-late-1970s-1914554.html
NULBC, 2010. Energy Efficiency and Climate Change Strategy.
http://www.newcastle-staffs.gov.uk/council_content.asp?id=SXCA82-A780ED09&cat=1176
NULBC, 2010. Created by GIS Department. All rights reserved.
Planet Earth, 2008. UK commits to 80% emissions cuts by 2050.
http://planetearth.nerc.ac.uk/news/story.aspx?id=206
(Accessed 28/03/10.)
Stern Review, 2006. The Economics of Climate Change.
http://www.hm-treasury.gov.uk/stern_review_report.htm
(Accessed 28/03/10.)
The Pitt Review, 2008. Learning Lessons from the 2007 Floods.
http://archive.cabinetoffice.gov.uk/pittreview/thepittreview/final_report.html
(Accessed 28/03/10.)
The Sentinel, 2008. Grandad’s fear as home floods again.
http://www.thisisstaffordshire.co.uk/news/Grandad-s-fears-home-floods/article-283837-detail/article.html
(Accessed 01/03/10.)
Guardian, 2006. Official: this summer is the longest, hottest ever. http://www.guardian.co.uk/science/2006/oct/15/meteorology.uknews1
UKCIP 1, 2009. National Indicator 188: Planning to Adapt to Climate Change. http://www.ukcip.org.uk/index.php?option=com_content&task=view&id=320&Itemid=377
(Accessed 28/03/10.)
UKCIP 2, 2009. Why do an LCLIP?
http://www.ukcip.org.uk/index.php?option=com_content&task=view&id=341&Itemid=377
(Accessed 28/03/10.)