Research Paper on Adolescence Depression
Number of words: 5588
Abstract
Introduction
Depression symptom-screening scales are often used in the diagnosis of depression. The reliability, validity, and diagnostic accuracy of the symptom-screening scales play a particular role in depression prevention and intervention programs. The onset of depression usually is at the adolescent age bracket.
Methodology
I conducted a systematic review of various electronic databases such as Medline, PsycINFO, and PsycEXTRA to identify articles examining the reliability, validity, and diagnostic accuracy of some of the popular depression symptom-screening scales. We computed the pooled estimate of internal reliability, specificity, sensitivity, and Positive and Negative Predictive Values (PPV & NPV).
Results
I identified 20 studies. From the analysis, the symptom screening scales’ internal reliability was observed as being, while specificity and sensitivity were observed as moderate. The NPV values were observed as moderate; however, the PPV values were poor.
Conclusion
The commonly used depression symptom-screening scales in adolescents are reliable measures of adolescents. However, they all have their shortcomings.
Introduction
Depression in adolescents is a severe mental health issue, which causes them to lose interest in daily activity and a persistent feeling of sadness (Le Moult et al., 2019). Most of the depression symptoms are known to start during the adolescent years. In the USA, depression symptoms are the leading causes of mortality and morbidity in adolescents. Most adolescents commit suicide when they are depressed (Le Moult et al., 2019). In this regard, early effective and robust interventions are required to minimize the symptoms of depression and enhance their overall quality of life (Le Moult et al., 2019). In the last few years, there has been a rise in the number of studies on the pharmacological and non-pharmacological treatment of depression in adolescents (Weinberger et al., 2018). However, such studies’ effectiveness depends on investigators’ ability to validly measure depression in adolescents and explore its severity over time (Weinberger et al., 2018). In this regard, in this systematic review, we intend to review the most commonly used instruments in screening depression in adolescents. Specifically, we will evaluate the symptom screening scales’ psychometric properties to identify their strengths and weaknesses.
Research Objectives
- Identify symptom-screening scales that are used in the diagnosis and assessment of depression in adolescents
- Identify evidence on the internal reliability, diagnostic utility, and validity of the identified symptom-screening scales
Methodology
Search 1: Identify symptom-screening scales that are commonly used in adolescent preventative interventions for depression.
Search strategy
Arguably because of the extensive number of randomized control trials (RCTs) evaluating the effectiveness of preventative interventions for depression in children and numerous reviews synthesizing the findings of those reviews, I have conducted a systematic review of those reviews. The systematic review of the reviews was conducted in November 2020 in a wide range of online databases such as the Cochrane Library of Systematic Reviews, PsycINFO, Medline, and Pubmed. The systematic review of the reviews was done according to PRISMA (Preferred Reporting Items for Systematic Reviews and Meta-Analyses) regulations (Stovold et al., 2014; Moher et al., 2010). The search of the online databases was done using terms relating to depression interventions in adolescents, which were connected with Boolean operators such as ‘And’ and’ OR.’
Additionally, we searched in the online databases for empirical studies. Admittedly, some of the empirical studies might not have been included in systematic reviews. In this regard, the search for empirical studies in the online databases sought to identify RCTs that might not have been included in the reviews and systematic reviews.
Inclusion criteria
The reviews were only included in the systematic review if they were published between 2010 and 2015 and in the English language. Further, the authors must have employed systematic review in reviewing the RCTs. The empirical studies included in this systematic review include individual RCTs in the reviews reviewed and the updated list of the empirical studies. The empirical studies could also only be included if the study participants were aged between 5 and 18 years. Similarly, the empirical studies could only be included where the participants got assigned randomly to either a control or intervention group. Besides, the participants in the control group should not have received any intervention. Lastly, the intervention should have sought to prevent the onset of depression.
Data extraction
I extracted, cleaned, and double-checked data from each of the empirical studies. The extracted and cleaned data encompassed the samples’ socio-demographics, information on the intervention and mode of delivery, time of the follow-up assessments, methods used to measure depression in the adolescents, and outcome data. The methods used to measure depression in adolescents included structured diagnostic interviews and symptom screening scales. For purposes of this systematic review, symptom-screening scales refer to any measure that offers an assessment of depression, providing a numerical score that contains guidelines for its interpretation. It should get noted that the symptom-screening scales can either be completed by the individual of interest or by another person. We termed scales used in more than two studies as common. However, the scales used in less than one study will only be mentioned briefly.
Search 2: Establish evidence of diagnostic utility, validity, and reliability of the most used symptom-screening scales in adolescent preventative interventions for depression
Search strategy
I conducted a series of supplementary systematic searches on the online databases such as Medline, PsycEXTRA, and PsycINFO for evidence on the diagnostic utility, validity, and reliability of each symptom-screening scale identified as common. The search terms included terms related to depression in adolescents such as adolescent depression, symptom-screening scales, and psychometric features. All the search terms were connected using Boolean operators such as ‘OR’ and ‘AND.’ I also used the name of each scale when exploring the online databases; for instance, ‘beck depression inventory,’ ‘children’s depression inventory’ and ‘center for epidemiologic studies depression scale.’ The other sources of literature that we explored include reviews of the depression scales.
Eligibility criteria
Articles reporting on the reliability, validity, and diagnostic utility of the symptom-screening scales were only included in the systematic review if they were published between 2010 and 2015 and were in the English language. Also, the specific symptom-screening scale should have been identified in search 1. Further, the participants in the study should have been aged between 5 and 18 years. The studies were also included if they reported on the scale’s conventional psychometric features, including validity and reliability measures. We excluded studies seeking to translate an existing scale into another language without providing information on the given symptom-screening scale’s psychometric properties.
Data extraction
I extracted, cleaned, and double-checked data from all of the included studies. The data extracted from the included studies encompassed characteristics of the sample (size, gender, age, language, country, and setting), names of the scales evaluated and the number of the items, inter-rater and test-retest reliability of the scale, and internal and external validity of the scale, for instance, Cronbach’s α, associated specificity, sensitivity, and negative and positive predictive values (NPV& PPV). We computed the associated specificity, sensitivity, NPV, and PPV manually from the partially reported data. In some cases, the values of the associated specificity, sensitivity, NPV, and PPV was imputed from the overall presentation of the data.
Primary outcomes: Conventional Psychometric features and diagnostic utility
Data synthesis
I employed a qualitative approach to synthesizing the NPV and PPV values. This is informed by the fact that their values are highly dependent on the prevalence of depression in the sample, which is likely to vary from each of the studies included in the review.
Reliability
I employed Cronbach’s alpha in evaluating the internal consistency of each of the scale that was used (McNeish, 2018; Tavakol & Dennick, 2011). Similarly, Kappa’s [κ] statistic was used in evaluating the inter-rate reliability of all the scales (McHugh, 2012). We employed the following classification criteria in categorizing the reliability coefficients.
| Value | Meaning |
| α ≥ .9 | Excellent |
| .85 ≤α < .9 | Good |
| .80 ≤α < .85 | Moderate |
| .75 ≤α < .80 | Fair |
| < .75 | Unsatisfactory |
Validity
In examining the validity of each scale, we evaluated five critical measures of discriminative validity: Specificity (proportion of non-cases identified correctly), sensitivity (proportion of cases identified correctly), PPV (the likelihood that the subjects identified as cases are correct cases), NPV (the likelihood that the subjects identified as non-cases are actual non-cases). We employed the following criteria in classifying the validity coefficients (Sensitivity, Specificity, NPV, and PPV).
| Value | Meaning |
| Coefficient ≥ .9 | Excellent |
| .80 ≤ coefficient < .9 | Good |
| .60 ≤ coefficient < .80 | Moderate |
| < .60 | Low |
Risk of bias
I used the risk assessment tool constructed by the Cochrane Collaboration Diagnostic Test Accuracy Working Group to examine the risk of bias in the included studies (Leeflang, et al., 2013). We determined the risk across four domains: index test, patient selection, flow and timing, and reference and standard. Additionally, the risk was both quantified and categorized into 1 (high), 2 (unclear), and 3 (low). Arguably, this was important to allow for the derivation of the total quality scores, which would be used in performing the meta-regression analyses.
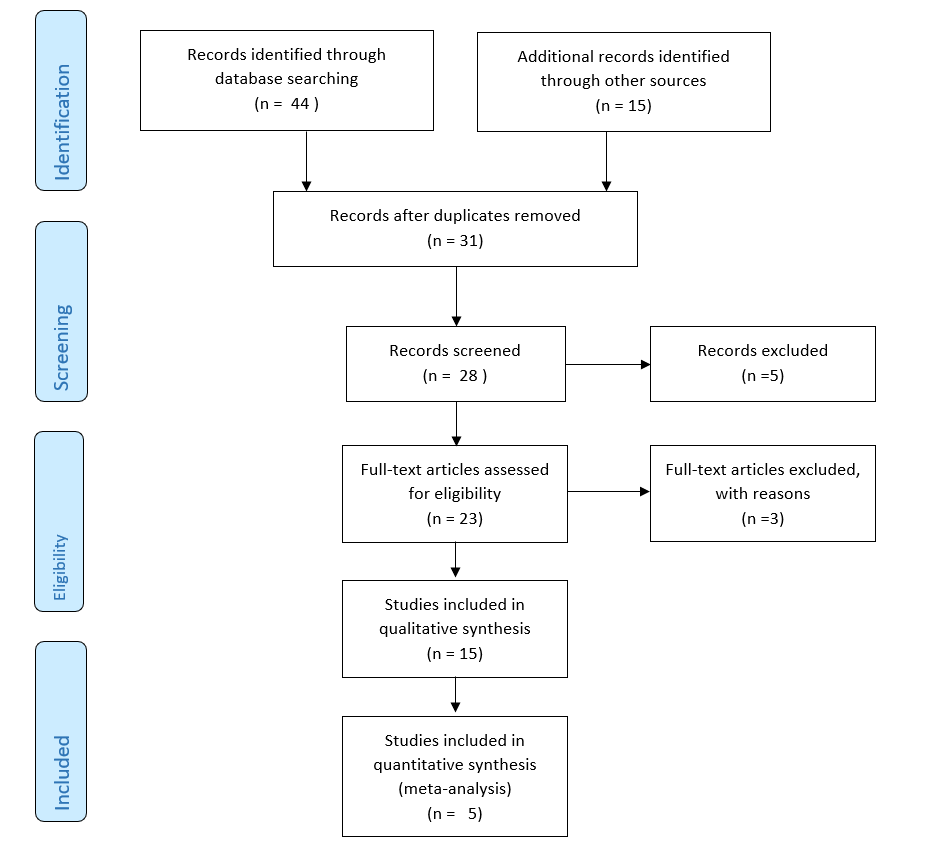
PRISMA 2009 Flow Diagram
Results
Search 1: Identify symptom-screening scales that are commonly used in adolescent preventative interventions for depression
The first search identified seventeen systematic reviews for adolescent and childhood preventative interventions for depression. The 4 systematic reviews had a combined 44 trials. Out of the 44 trials, 24 were unique, while 20 were duplicate studies. Further, 6 out of the 24 unique trials evaluated depression as an outcome using the symptom-screening scale. Further, 8 out of the 24 unique trials evaluated the prevalence of depression using administered structured and unstructured interviews (n=6) and cut-offs values on the depression symptom-screening scale (n=2).
In the 24 trials that evaluated depression as an outcome using the symptom-screening scale, there were 17 different symptom-screening scales. Further, five structured and semi-structured interviews were used in the 24 trials. The most commonly used screening scale for assessing depression was CDI (Children’s Depression Inventory), used in circa 10 studies. It was followed by BDI (Beck Depression Inventory), which was used in 6 studies, and CES-D (Centre for Epidemiologic Studies-Depression Scale), which was used in 5 studies. The Reynolds’s Adolescent Scale (RADS) was used in 3 out of the 24 trials.
Moreover, the following symptom-screening scales were used in two or fewer studies: Youth Self-Report (YSR), Revised Child Anxiety and Depression Scale (RCADS), Multi-score Depression Inventory – Children (MDI-C), Hospital Anxiety and Depression Scale (HADS), Depression Scale version 10 (DEPS-10), Beck Youth Inventories (BYI), Depression Symptom Rating Scale (DSRS), Children’s Depression Rating Scale-Revised (CDRS-R), Child Behaviour Checklist (CBCL), and Brief Symptom Inventory (BSI).
Search 2: Establish evidence of diagnostic utility, validity, and reliability of the most used symptom-screening scales in adolescent preventative interventions for depression
The search for evidence of diagnostic utility, validity, and reliability of the most used symptom-screening scales in adolescent preventative interventions for depression yielded 15 results. Out of the 15 studies, 12 were unique. Further, 3 out of the 12 unique studies were excluded as they were not related to the investigation topic. Out of the 9 remaining studies, 2 were excluded as the sample participants were not within the predefined range of 5 to 18 years. We identified the 7 remaining studies as relevant as they examined the validity, reliability, and diagnostic utility of various symptom-screening scales such as the CDI, BDI, CES-D, and RADS. The 7 studies included 10 data points and had circa 300 study participants. Most of the 7 studies were conducted in the USA, with a few in Europe and specifically countries such as Germany, Spain, the Netherlands, Belgium, Switzerland, Sweden, Greece, and Denmark.
Risk of bias in the included studies
Out of the 20 studies included in this systematic review, the risk of bias was established to be high or difficult to be determined. Only eight out of the 20 studies utilized representative samples. Four out of the 20 studies determined ‘caseness’ using pre-determined cut-off scores on the scales. However, in most of the studies, these values were determined after the studies (n=8). Moreover, 5 out of the 8 studies that employed a diagnostic interview in determining the discriminative validity of the symptom-screening scale utilized both unstructured and semi-structured interviews premised on the DSM and ICD-10 criteria. Despite this, only 4 out of the 11 studies specified that the interviewers were blinded to the scale scores as they were administering the interviews. As a result, 4 out of the 20 studies that utilized clinical interviews that were not defined and not premised on either DSM or ICD-10 criteria were excluded from this systematic review. Lastly, we deemed the correct lag time between the symptom screening scale and the diagnostic interview as one week, which was fulfilled by 10 of the included studies.
Popular Depression scales for adolescents
CDI (Children’s Depression Inventory).
The CDI (Children’s Depression Inventory) is a modified version of the BDI (Beck Depression Inventory) that is often used in assessing depression in children aged between 7 and 18 years (Stumper et al., 2019). CDI is self-report and includes 27 items, each with 3-point answers. Ordinarily, it takes roughly between 10 and 20 minutes to complete and score the CDI. The range of possible scores for CDI is 0 and 54 (Stumper et al., 2019). It should get noted that CDI also has a corresponding parent version. Undoubtedly, because of CDI’s record in the research of depression, it is the most commonly used symptom-screening scale for the study of depression in adolescents and youth (Stumper et al., 2019). The period of assessment for CDI is the past two weeks (Stumper et al., 2019; Ahlen & Ghaderi, 2010).
CDI purportedly has a five-factor structure. However, this raises uncertainty around the scale’s validity as two of the five factors related to anxiety and externalizing disorders (Gomez et al., 2012). In this review, the pooled estimate of the internal reliability was provided as 0.86, categorized as good. Besides, CDI’s discriminative validity was evaluated using 10 data points with cut off scores ranging from 11 to 19. Bivariate meta-analyses of these studies showed that both the sensitivity and specificity of CDI was good. The PPV of CDI in the included studies was low, with a low score of 0.28. However, the NPV of the CDI in the included studies was found to be excellent, with average NPV scores of 1.0
Center for Epidemiologic Studies Depression scale (CES-D)
CES-D is primarily designed to screen for depression in the general population and often comprises of a self-report questionnaire with 20 items (Bradley et al., 2010). The 20 items address six symptom areas of depression: sleep disturbance, loss of appetite, psychomotor retardation, helplessness, feelings of worthlessness and guilt, and depressed mood (Bradley et al., 2010). All of the 20 items in CES-D are rated from 0 to 3. The total scores of CES-D range from 0 to 60 (Bradley et al., 2010; Tatar et al., 2013). In the case of CES-D, the period of assessment is usually the past one week. CES-D has a modified version CES-DC that is designed for use by children (Bradley et al., 2010). The modified version still has the same response format and number of items as CES-D. Despite this, the language of CES-DC is modified to the reading levels of children (Bradley et al., 2010).
I employed 10 data points in determining the internal reliability of CES-D. Subsequently, we found the pooled estimate of CES-D’s internal reliability as 0.88, which can be categorized as good. Further, from our analyses, I found out that the sample age, sample type (clinical and non-clinical), and risk of the quality score as having a limited impact on the internal reliability of CES-D.
Furthermore, bivariate analyses of the included studies showed that CES-D’s sensitivity and specificity as average. The pooled estimate of the sensitivity coefficient was 0.76, while that of the specificity coefficient was 0.71. Further, from our analyses, I found out that the sample age, sample type (clinical and non-clinical), and risk of quality score and cut-off point score used as having a limited impact on the internal reliability of CES-D. Additionally, the PPV of the CES-D was observed to be low from six of the included studies. The values of PPV ranged from 0.08 to 0.32. Contrastingly, the NPV of the CES-D was found to be good, with an average value of 0.97.
Beck Depression Inventory (BDI)
The BDI initially got developed in 1961 as a depression symptom-screening scale for the adult population. Children’s Depression Inventory). Originally, BDI had 21 items, of which five contained statement responses on how the respondent had been feeling for the past one-week or the day of taking the assessment (Dolle et al., 2012). The statements in the BDI are scored from 0 to 3 and are presented in order of increasing severity. 6 out of the 21 items refer to vegetative symptoms, while the rest refer to cognitive or affective symptoms (Dolle et al., 2012). The range of possible scores in the BDI is 0 to 63. BDI has an exemplary record in the research of depression and is often used in adolescents and adults (Dolle et al., 2012). However, BDI use among young children is not particularly effective, as it does not have items about school. Furthermore, it does not have a parallel teacher or parent rating form (Dolle et al., 2012).
Over the years, BDI has been modified into different versions. For example, there is the BDI-1A, which is principally a revision of the origin BDI. BDI-1A also comprises 21 items (Wang & Gorenstein, 2013). Arguably, it differs from BDI in that it has a different assessment period (past two weeks before the period of assessment) and that the responses are refined (Wang & Gorenstein, 2013). Additionally, BDI-II is a modified version of the original BDI that aligns with DSM-IV criteria for depression. It got developed in 1996 (Wang & Gorenstein, 2013).
From the review of the empirical studies and systematic reviews, the pooled estimate of the internal reliability of BDI is provided as 0.86, which is based on 12 data points. In this regard, the internal reliability of BDI can be classified as good. Further, the sample type (clinical or non-clinical), sample age, and the risk of bias quality scores were shown to have limited impacts on the internal reliability values of the BDI.
Additionally, bivariate analysis of the studies showed that the specificity and sensitivity of BDI were good. The pooled estimates for both specificity and sensitivity of BDI was 0.81 drawn from thirteen data points. Further, the sample type (clinical or non-clinical), sample age, and the risk of bias quality score were shown as having a limited impact on the internal reliability values of the BDI. The PPV of BDI in the included studies was high, with values varying from 0.79 to 0.93, specifically in the clinical samples. However, in the non-clinical samples, the PPV of BDI was low and varied greatly from 0.10 to 0.88. The average NPV of BDI of the included studies was found to be 0.94.
Reynolds Adolescent depression scale (RADS)
RADS first got developed in 1986 and is principally a self-report instrument that contains 30 items (Reynolds, 2010). It assesses symptoms of depression severity in adolescents aged between 13 and 18 years. The assessment period of RADS is the past two weeks. Normally, RADS assesses somatic, cognitive, interpersonal, and psychomotor symptoms of depression, all of which are obtained from DSM-III manual (Carnevale, 2011). The responses to the thirty items are made on a four-point scale, which indicates the frequency of the symptoms that are normally associated with depression (Reynolds, 2010). The items on the four-point scale are, most of the time, sometimes, hardly ever, almost never. The scores of RADS range from 30 to 120, and it takes circa 30 minutes to complete (Reynolds, 2010). RADS has a modified version of RADS-2, which is essentially an update on the original RADS. RADS-2 seeks to address several psychometric issues inherent in the original RADS: criterion-related validity, internal consistency estimates, and known group validity (Carnevale, 2011).
From the review of the empirical studies and systematic reviews, the pooled estimate of RADS’ internal reliability is given as 0.93, which is based on seven data points. Hence, it is classified as excellent. Besides, sample type (clinical or non-clinical), sample age, and risk of the quality score were shown to have a limited impact on RADS internal reliability values. However, I could not compute RADS’s specificity and sensitivity since the six studies, which used RADS as a symptom-screening scale, employed structured and semi-structured interviews that were not based on either ICD-10 or DSM manuals.
Concluding remarks
It can be inferred from the four scales considered in this systematic review that their internal reliability is good. Further, the four symptom-screening scales’ internal reliability is not affected by sample type (clinical and non-clinical), sample age, and risk of bias of quality score. Further, from the four scales consider, we can term their sensitivity and specificity as being moderate.
Discussion
Arguably, our systematic review has provided an objective and robust assessment of the validity, reliability, and diagnostic utility of the symptom-screening scales that are normally used in assessing for depression in children and adolescents. From this systematic review, it can be inferred that the most commonly used symptom-screening scales are CDI, CES-D, BDI, and RADS (Roseman et al., 2016). The four symptom-screening scales have a good level of internal consistency when used in adolescents (Roseman et al., 2016). Further, meta-regression analysis revealed that factors such as the sample type (clinical or non-clinical), sample age, and risk of quality score bias have a limited impact on the four symptom-screening scales’ internal consistency.
Further, from the systematic review, it can be inferred that the four symptom-screening scales’ ability to identify correctly positive and negative cases (PPV & NPV) is moderate. However, it should get noted that the PPV was poor in the four scales. Hence, this suggests that the use of cut-off scores on these symptom-screening scales to determine the clinical levels of depression often results in high misclassification rates. Specifically, this was the case when the four symptom-screening scales were used in non-clinical settings (Roseman et al., 2016). Besides, there was also a high variation in the cut-off scores used to determine ‘caseness.’ Subsequently, this means that if one chooses to employ use cut-off scores on the four symptom-screening scales to determine clinical ‘caseness’, then there is a need to adjust the cut-off scores to ensure that they are better suited to the sample under investigation.
Moreover, it is worth noting that although CDI includes an extensive range of signs and symptoms of depression, it is significantly biased towards cognitive signs and symptoms. Besides, numerous studies have demonstrated that CDI can discriminate adolescents with depression from those who do not experience depression (Thabrew et al., 2013). Arguably, this is the main shortcoming of CDI. Similarly, BIAS is significantly biased towards the cognitive symptoms of depressions. Also, since BDI is often extensively used in assessing depression in adults and its high sensitivity to change, it should assess change in depression symptoms over time. The main shortcoming of BDI is that it is not precisely clear what it measures (Thabrew et al., 2013). In this regard, this has led multiple researchers to postulate that BDI, instead of measuring the severity of depression, measures overall psychological distress. Further, the response format and the reading level of BDI may cause significant problems to adolescents whose reading skills are not well developed (Thabrew et al., 2013).
In the case of RADS, it is worth noting that its scale does not cover all the symptoms of depression. However, most of the content of the RADS scale overlap with the accepted criteria for depression as provided for by DSM and ICD classification frameworks. Besides, RADS only accesses the frequency and not the severity of the symptoms of depression (Roseman et al., 2016). The main strength of RADS is its internal reliability and suitability to group assessments. Also, RADS is ineffective in changing symptoms of depression in adolescents over time. Further, CES-D has no identifiable strengths but multiple shortcomings, more so when used with adolescents (Roseman et al., 2016). As a result, this has prompted some of the researchers to contend that CES-D measures overall emotional turmoil instead of depression.
Limitations of this systematic review
In recent years, there has been growing criticism of binary classification frameworks such as the DSM manual. In particular, most individuals have criticized these frameworks’ assumptions that individuals should be categorized as either having or not having a given psychopathological condition (Siu, 2016). Arguably, this is informed by claims that depression in youths often occurs on a continuum. Subsequently, this meant that in this systematic review, we considered other outcomes in the treatment of depression that include the disability caused by the particular mental disorder, such as functional impairment (Siu, 2016). Recent studies have established that where there is no official diagnosis of a mental health disorder, indicators of functional impairment or disability are useful in measuring the need for mental health services and treatment (Siu, 2016). In this study, we only used classification frameworks such as DSM and ICD. As a result, the data missed adolescents who might need mental health services and treatment but have not been formally diagnosed with depression.
Moreover, in this systematic review, the risk of bias in the included studies was either established as high or difficult to establish because of inadequate reporting. Besides, most of the studies included in this systematic review adjusted the cut-off scores to determine clinical ‘caseness’ after the study (Cohen et al., 2018). Arguably, this was done to maximize specificity and sensitivity values. However, this might have affected the systematic review’s accuracy by artificially increasing the diagnostic accuracy of the symptom-screening scales in the included studies (Cohen et al., 2018). Thus, this means that there is a high likelihood that the results concerning diagnostic utility identified in this systematic review may differ greatly from those in the real world context, where the cut-off scores are normally chosen before the study.
Furthermore, such cut-off scores and points are more likely to differ from one study to another, specifically depending on where the symptom screening scales are used (Cohen et al., 2018). Ordinarily, the cut-off scores for a clinical setting will be different from those in a school setting. Besides, it is worth noting that the computed PPV and NPV values in this study are highly dependent on the prevalence of the mental disorders in the sample (Sheldrick et al., 2015). Subsequently, this means that the low to moderate PPV values of the symptom-screening scales obtained in this review may indicate low prevalence rates of depression in the studies and not the symptom-screening scales’ limited ability to identify cases correctly (Sheldrick et al., 2015).
Additionally, while in this systematic review, I only considered the four symptom-screening scales’ internal reliability when measuring their efficacy, the efficacy of the four-symptom screening scales is also affected by other factors such as inter-rater and test-retest reliability (Sheldrick et al., 2015). In this systematic review, I hardly considered such other factors that affect the measure of the reliability of the symptom-screening scales. Lastly, it should get noted that while the mental disorders classification frameworks considered in this systematic review are considered the gold-standards in determining the presence or absence of depression, they are also susceptible to issues of reliability and validity just as the symptom-screening scale (Sheldrick et al., 2015).
Conclusion
To sum it up, the results of this systematic review demonstrate that symptom-screening scales such as CDI, BDI, CES-D, and RADS are reliable measures of depression in adolescents. Although in this systematic review, I observed no variance in the psychometric properties of the symptom-screening scales in both clinical and non-clinical settings, different age groups, and different study qualities, I did this with a limited amount of data. In this regard, there is a need for more quality studies in order to determine the specific conditions in which the test-performance may differ.
Besides, although cut-off scores on the symptom-screening scales may be used in establishing the risk status, it is highly likely that the used cut-off scores will vary greatly depending on the context and setting in which a particular symptom-screening scale is applied and used. Subsequently, this means that the risk of misclassification will be high and more so where the prevalence of the disorder of interest is low; for instance, school settings. As a result, this calls for extra research evaluating the predictive ability of depression symptom-screening scales in adolescents’ cohort studies.
References
Ahlen, J., & Ghaderi, A. (2017). Evaluation of the Children’s Depression Inventory—Short Version (CDI–S). Psychological assessment, 29(9), 1157.
Bradley, K. L., Bagnell, A. L., & Brannen, C. L. (2010). Factorial validity of the Center for Epidemiological Studies Depression 10 in adolescents. Issues in Mental Health Nursing, 31(6), 408-412.
Carnevale, T. (2011). An integrative review of adolescent depression screening instruments: Applicability for use by school nurses. Journal of Child and Adolescent Psychiatric Nursing, 24(1), 51-57.
Cohen, J. R., So, F. K., Hankin, B. L., & Young, J. F. (2018). Translating cognitive vulnerability theory into improved adolescent depression screening: A receiver operating characteristic approach. Journal of Clinical Child & Adolescent Psychology.
Dolle, K., Schulte-Körne, G., O’Leary, A. M., von Hofacker, N., Izat, Y., & Allgaier, A. K. (2012). The Beck Depression Inventory-II in adolescent mental health patients: Cut-off scores for detecting depression and rating severity. Psychiatry Research, 200(2-3), 843-848.
Gomez, R., Vance, A., & Gomez, A. (2012). Children’s Depression Inventory: Invariance across children and adolescents with and without depressive disorders. Psychological Assessment, 24(1), 1.
Leeflang, M. M., Deeks, J. J., Takwoingi, Y., & Macaskill, P. (2013). Cochrane diagnostic test accuracy reviews. Systematic reviews, 2(1), 82.
LeMoult, J., Humphreys, K. L., Tracy, A., Hoffmeister, J. A., Ip, E., & Gotlib, I. H. (2019). Meta-analysis: Exposure to early life stress and risk for depression in childhood and adolescence. Journal of the American Academy of Child & Adolescent Psychiatry.
McHugh, M. L. (2012). Interrater reliability: the kappa statistic. Biochemia medica: Biochemia medica, 22(3), 276-282.
McNeish, D. (2018). Thanks coefficient alpha, we’ll take it from here. Psychological Methods, 23(3), 412.
Moher, D., Liberati, A., Tetzlaff, J., & Altman, D. G. (2010). Preferred reporting items for systematic reviews and meta-analyses: the PRISMA statement. Int J Surg, 8(5), 336-341.
Reynolds, W. M. (2010). Reynolds adolescent depression scale. The Corsini Encyclopedia of Psychology, 1-1.
Roseman, M., Kloda, L. A., Saadat, N., Riehm, K. E., Ickowicz, A., Baltzer, F., … & Thombs, B. D. (2016). Accuracy of depression screening tools to detect major depression in children and adolescents: a systematic review. The Canadian Journal of Psychiatry, 61(12), 746-757.
Sheldrick, R. C., Benneyan, J. C., Kiss, I. G., Briggs‐Gowan, M. J., Copeland, W., & Carter, A. S. (2015). Thresholds and accuracy in screening tools for early detection of psychopathology. Journal of Child Psychology and Psychiatry, 56(9), 936-948.
Siu, A. L. (2016). Screening for depression in children and adolescents: US Preventive Services Task Force recommendation statement. Annals of internal medicine, 164(5), 360-366.
Stumper, A., Olino, T. M., Abramson, L. Y., & Alloy, L. B. (2019). A factor analysis and test of longitudinal measurement invariance of the Children’s Depression Inventory (CDI) across adolescence. Journal of Psychopathology and Behavioral Assessment, 41(4), 692-698.
Stovold, E., Beecher, D., Foxlee, R., & Noel-Storr, A. (2014). Study flow diagrams in Cochrane systematic review updates: an adapted PRISMA flow diagram. Systematic reviews, 3(1), 54.
Tatar, A., Kayiran, S. M., Saltukoglu, G., Ozkut, E. Ş. Z., & Emeksiz, M. (2013). Analysis of the Center for Epidemiologic Studies Depression Scale (CES-D) in children and adolescents from the perspective of the item response theory. Klinik Psikofarmakoloji Bülteni-Bulletin of Clinical Psychopharmacology, 23(3), 242-253.
Tavakol, M., & Dennick, R. (2011). Making sense of Cronbach’s alpha. International journal of medical education, 2, 53.
Thabrew, H., McDowell, H., Given, K., & Murrell, K. (2017). Systematic review of screening instruments for psychosocial problems in children and adolescents with long-term physical conditions. Global pediatric health, 4, 2333794X17690314.
Wang, Y. P., & Gorenstein, C. (2013). Psychometric properties of the Beck Depression Inventory-II: a comprehensive review. Brazilian Journal of Psychiatry, 35(4), 416-431.
Weinberger, A. H., Gbedemah, M., Martinez, A. M., Nash, D., Galea, S., & Goodwin, R. D. (2018). Trends in depression prevalence in the USA from 2005 to 2015: widening disparities in vulnerable groups. Psychological medicine, 48(8), 1308-1315.