Investment Trust Report: Newcastle Investor Advice
Number of words: 2209
Executive summary
This report aims to provide investment advice to our client by analysing the historic performance of three investment trusts over the past five years using some of the most popular performance-based ratios in the industry.
A short explanation of investment trusts and performance measures is provided, followed by a commentary on the results of the analysis conducted.
The returns of these investment trusts are compared against the returns of the FTSE-all-share index, which is used as the main benchmark for all analysis in this document. Both absolute and relative measures of performance are used.
The report concludes with a recommendation on the trust that the client should invest in and an explanation of caveats and inaccuracies of the analysis.
1. Investment trusts
Investment trusts provide investors with a convenient way of investing in the sense that they are usually well diversified and there is no active management required on either end of the line – nor the trust’s neither the investors’.
Unit investment trusts are pools of money invested in a portfolio that is fixed for the life of the fund (Bodie, Kane and Marcus: 2014). As the trust is a listed company, investors would buy its shares and hold them for as long as they wish before selling them at a premium.
As the definition above states, investment trusts are fixed and therefore, unmanaged (passive) portfolios – which means that investors would expect the portfolio to remain about the same for as long as they hold the shares. Little trading can reduce operating expenses on the trust’s side, which in turn can be translated into lower costs and lower risk for the investor. However, this could also mean that the investment is not yielding the returns that an actively managed portfolio could yield. Market timing is usually not a big factor in this type of companies, as hedging does not really play a role.
Overall investment trusts provide relatively low-risk, low-cost and well-diversified portfolios that yield moderate but consistent returns.
However, out of the three trusts, which one should the investor choose? The investor should select the investment portfolio that is offering the highest returns in relation to its level of risk – which is to be found by analysing the trusts’ performance using portfolio performance measures.
2. Portfolio performance measures
The European Investment Practices Survey 2008 indicates that most practitioners use a surprisingly simple array of performance measures. 77.8% of the respondents use a broad market index as a benchmark for their portfolios. When it comes to measuring absolute performance, 79.73% stated that they use the Sharpe ratio and 11.26% indicated that they use the Treynor ratio. To measure relative performance, 69.63% of practitioners use the Information ratio. From the style analysis pool, most of the professionals who use it, use the return-based style.
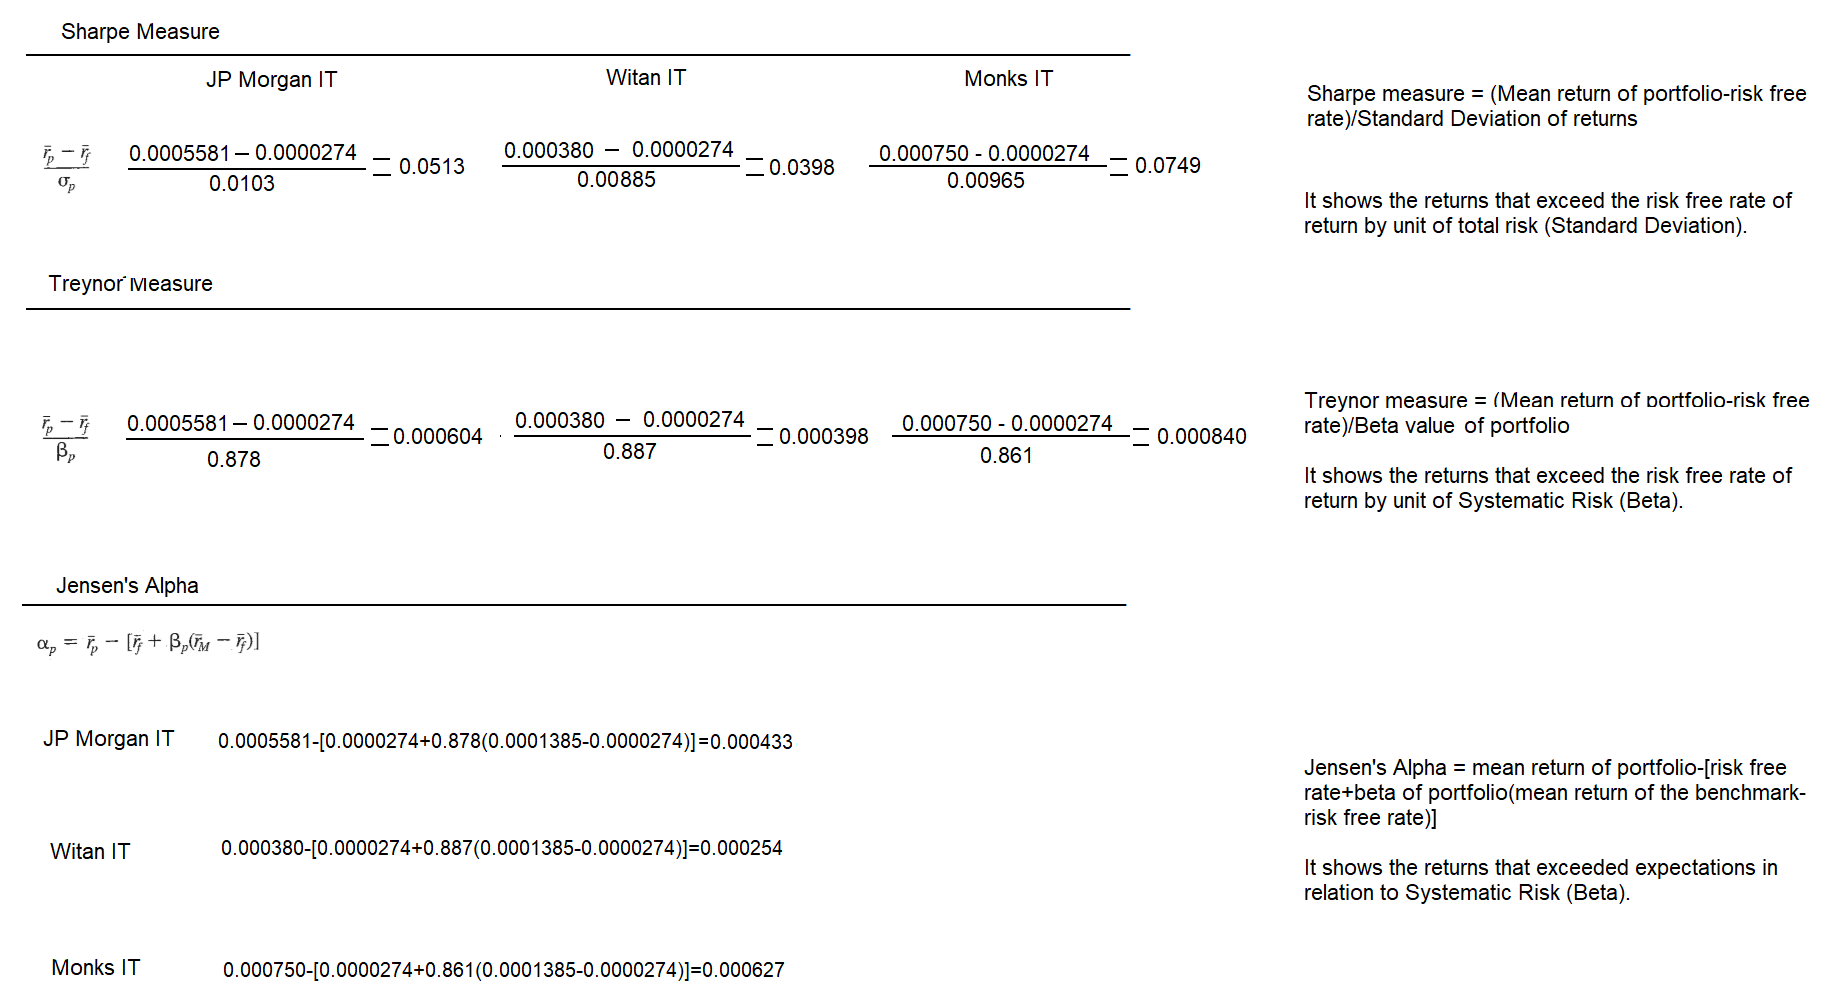
The Sharpe ratio (also known as the reward-to-variability ratio) is an absolute measure (not contrasted against a benchmark) that divides the excess return on a portfolio by the standard deviation (σ or total risk) of the returns. Basically, the resulting number gives an indication of how much the standard deviation must fall in order to underperform the risk-free rate of return.
The Treynor ratio is also an absolute measure of returns in relation to risk, only that this one in particular divides the excess return by systematic risk (β) instead of total risk. In theory, this ratio is more accurate than the Sharpe ratio when used on investment trusts as these portfolios have reduced individual risk due to diversification.
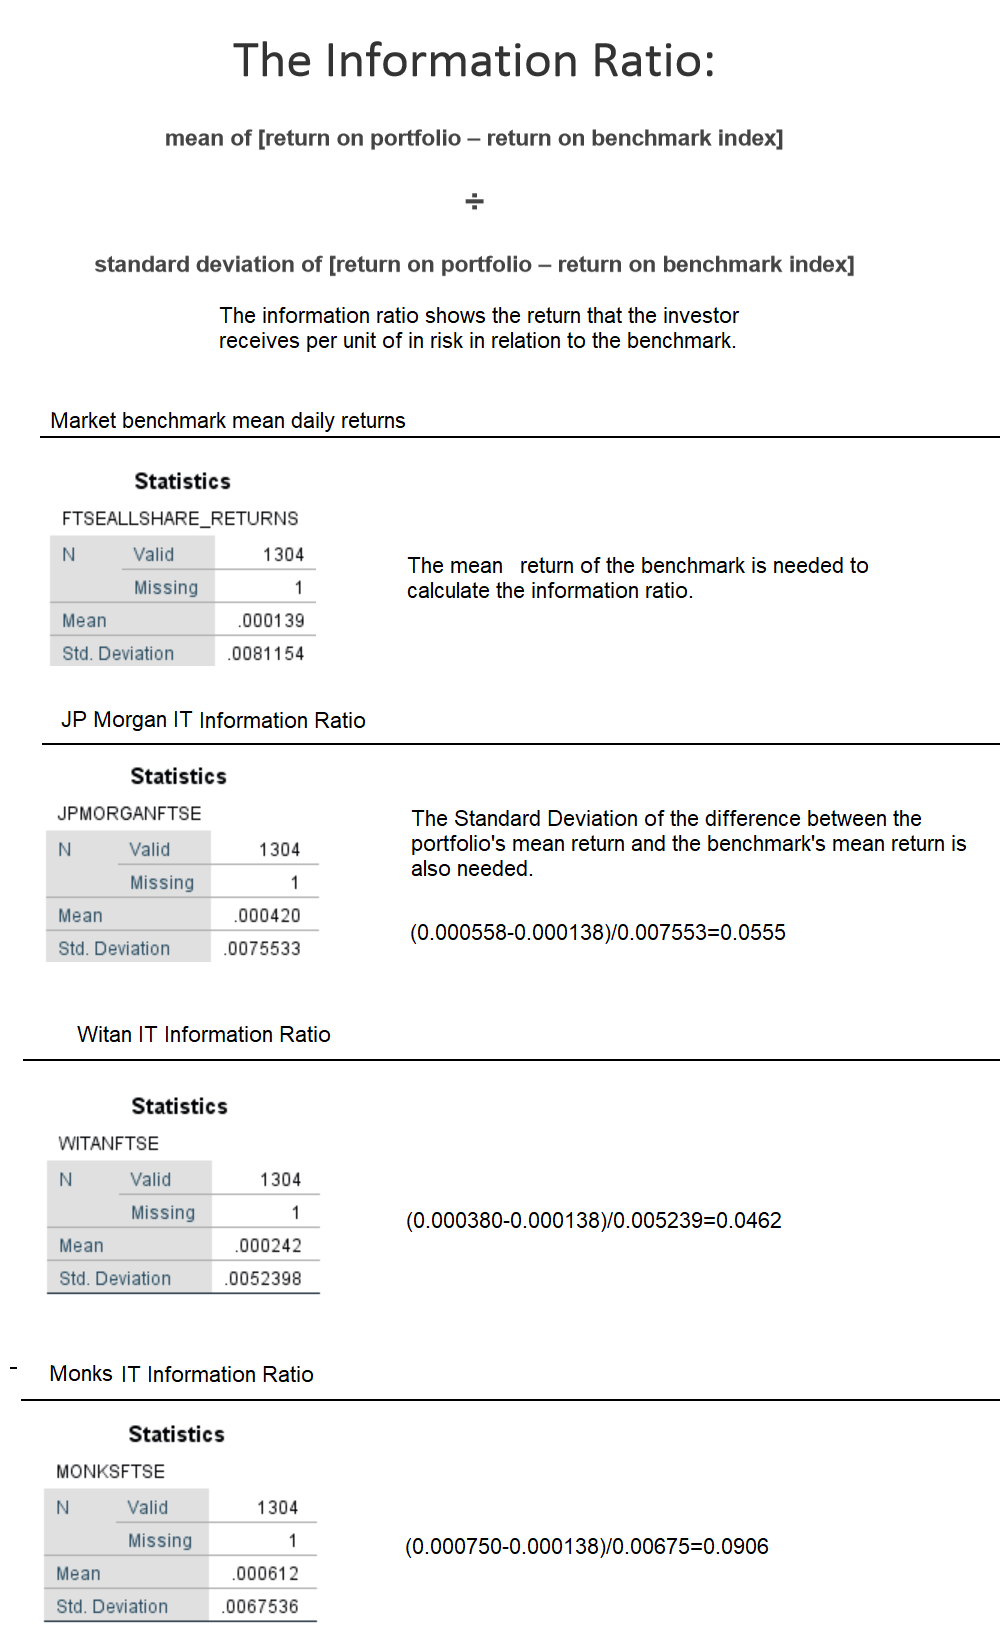
‘The information ratio which is one of the most common variations of the Sharpe ratio, replaces the risk-free asset with a benchmark portfolio. In the standard information ratio, risk is defined as tracking error volatility’ (The Hedgefund Journal: 2008). This ratio is different from the Sharpe’s ratio in the sense that as it uses a benchmark, it is a relative measure of performance.
The analysis in this report employs the reportedly most popular performance measures. The returns of each investment trust will be compared against the returns of the broad FTSE-all-share index and the popular risk-return measures mentioned above will be also used.
3. Data analysis
The daily returns produced in the last five years by each of the three investment trusts have been taken and analysed to obtain their growth, standard deviations, mean, beta value, correlation coefficient and the measures mentioned earlier. For more detailed information, see appendices.
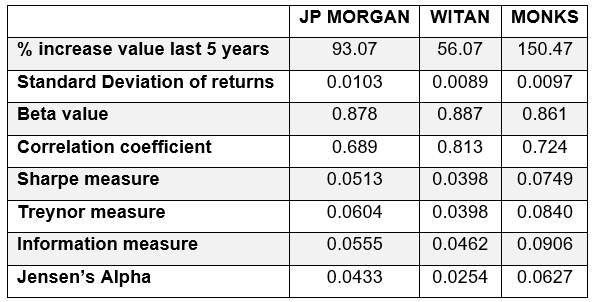
On all three cases the correlation coefficient is very significant, which means that for most of the time these portfolios move along with the market index. The three beta values are comparable and indicate that the portfolios are essentially moving almost as fast as the market benchmark. Knowing that the market is bound to move up over time, these values would suggest that all trusts perform generally well.
However, Monks trust has the highest Sharpe and Treynor values, showing the most stable levels of total and systematic risk. Also, the value of the portfolio has increased by an astonishing 150.47%, having performed considerably better than the other two trusts in the past five years.
The information ratio shows the returns in relation to the FTSE-All-SHARE benchmark after being adjusted for risk. Monks has the highest returns.
Using an extra measure of relative performance, Jensen’s Alpha, one would obtain a measure of excess return over the expected return in relation to Beta. Even though there is indeed excess return on all portfolios, Monks’ still has the upper hand.
Given the results of the analysis conducted, one would recommend investors to invest in Monks portfolio. However, this analysis is not exempt from inaccuracies.
4. Caveats of the analysis
Investment trusts usually reinvest all dividends to boost investors’ returns. However, it is not possible to know whether all dividends are being reinvested at all times. For the purposes of this report, we assume that the trusts reinvested all dividends during the five-year period.
This analysis has been conducted using the returns of three diversified portfolios. The fundamentals (types of companies, industry growth, corporate strategies and goals, etc) behind the companies constituents of these portfolios, have not been taking into account. These fundamentals could explain differences in performance between portfolios.
Nor trust costs neither costs that the investor would incur (taxes, commissions, etc) have been taken into consideration.
Other types of measurers like the price to earnings ratio have not being used in this report. There is no accurate way in the information provided here that gives an indication of whether an investment trust is undervalued or overvalued.
An extremely wide benchmark (FTSE-ALL-SHARE index) with over 600 companies across all sectors has been used to contrast returns and to calculate relative performance measures (Jensen and the information ratio) instead of using more appropriate benchmarks that may fit the nature of the portfolios better, like industry related or company-size related benchmarks. This can also help to develop tools that would measure risk more accurately.
5. Conclusion
This report has used the most popular performance measures in the industry to conclude that Monks investment trust has been outperforming JP Morgan and Witan trusts. Nevertheless, as it has been found in prior research, popularity is not an indication of accuracy. As a matter of fact, the least popular measures and benchmarks are the ones that usually deliver the best accuracy (EDHEC Risk and Asset Management Research Centre: 2008).
It would also be wise to underline that past performance is not an indication of future performance.
References
Bodie Z., Kane A. and Marcus, A. (2014), Essentials of Investments (Global tenth edition, MC Hill), p. 93.
EDHEC Risk and Asset Management Research Centre (2008), ‘The EDHEC European Investment Practices Survey 2008,’ Performance measurement practices: Call for reaction, pp. 2-6.
The Hedge Fund Journal: Informing the Hedge Fund Community (2008, issue 37).
Appendix 1 – JP Morgan trust regression and descriptive statistics
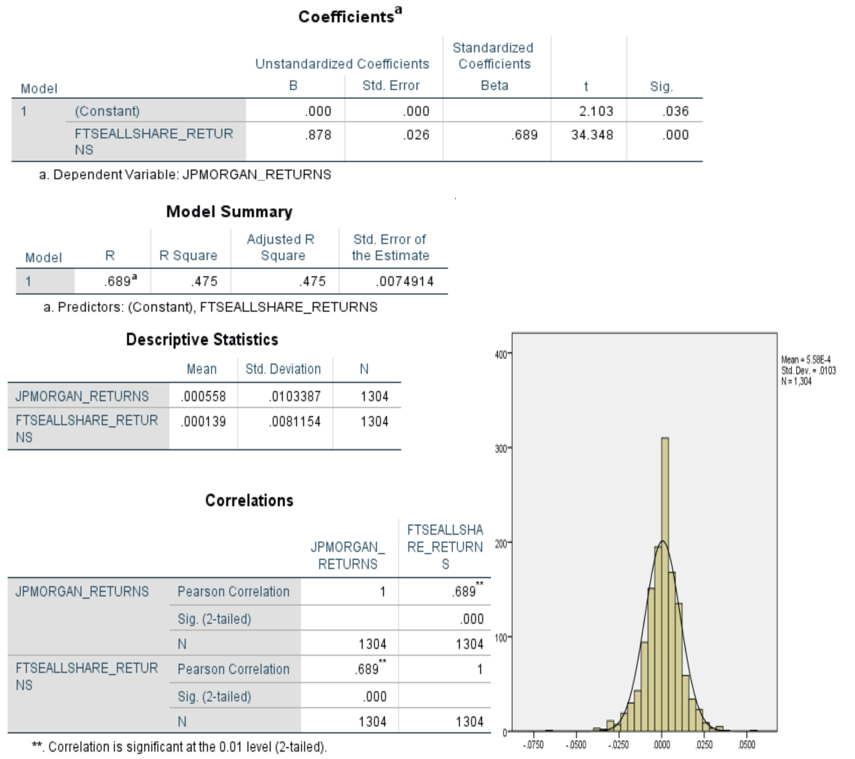
Results of the analysis carried out by statistics programme SPSS. The coefficients section reflects the Beta value of this portfolio (Unstandardized B) at 0.878. If the value were 1, it would mean that the portfolio moves at the pace of the market benchmark FTSE-ALL-SHARE.
The mean in the descriptive statistics section will be needed to calculate the ratios. The Standard deviation and the Beta will be needed for the Sharpe and Treynor measures respectively (beta will be needed for Jensen’s Alpha as well).
Appendix 2 – Witan trust regression and descriptive statistics
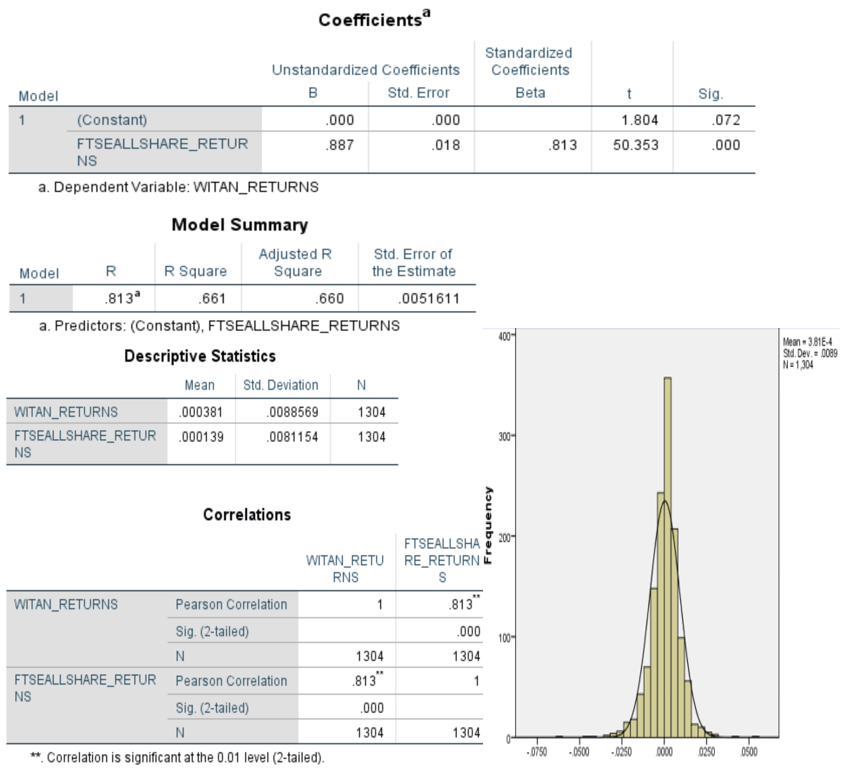
Results of the analysis carried out by statistics programme SPSS. The coefficients section reflects the Beta value of this portfolio (Unstandardized B) at 0.887. If the value were 1, it would mean that the portfolio moves at the pace of the market benchmark FTSE-ALL-SHARE.
The mean in the descriptive statistics section will be needed to calculate the ratios. The Standard deviation and the Beta will be needed for the Sharpe and Treynor measures respectively (beta will be needed for Jensen’s Alpha as well).
Appendix 3 – Monks trust regression and descriptive statistics
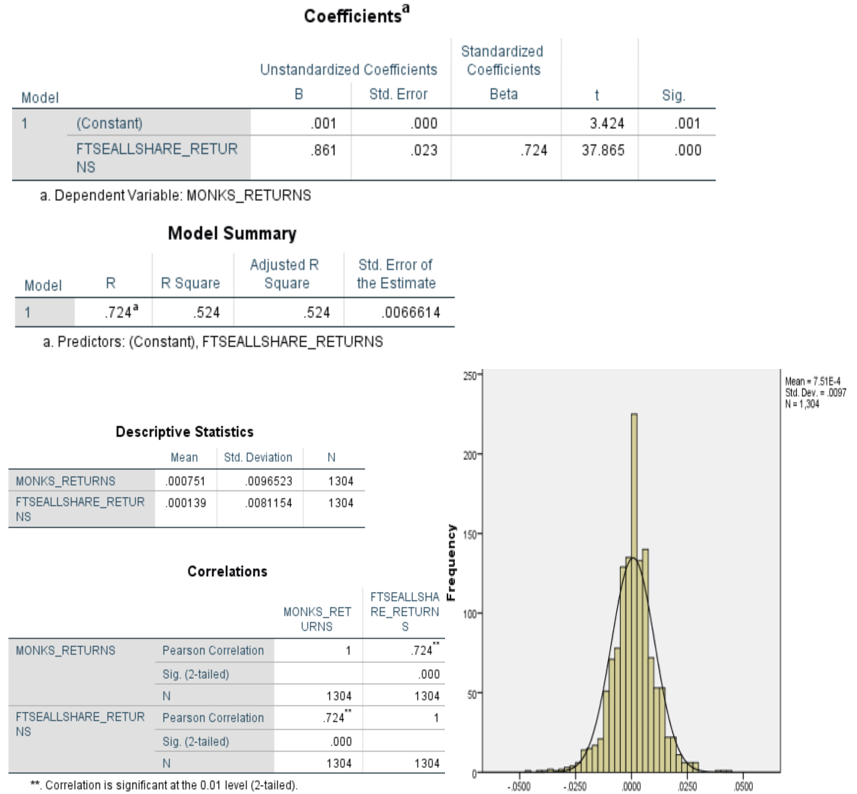
Results of the analysis carried out by statistics programme SPSS. The coefficients section reflects the Beta value of this portfolio (Unstandardized B) at 0.861. If the value were 1, it would mean that the portfolio moves at the pace of the market benchmark FTSE-ALL-SHARE.
The mean in the descriptive statistics section will be needed to calculate the ratios. The Standard deviation and the Beta will be needed for the Sharpe and Treynor measures respectively (beta will be needed for Jensen’s Alpha as well).
Appendix 4 – Obtaining the Sharpe, Treynor and Jensen measures
Average daily risk free rate of return = 0.00274%
Appendix 5 – Obtaining the Information ratio
Appendix 6 – Capital market line
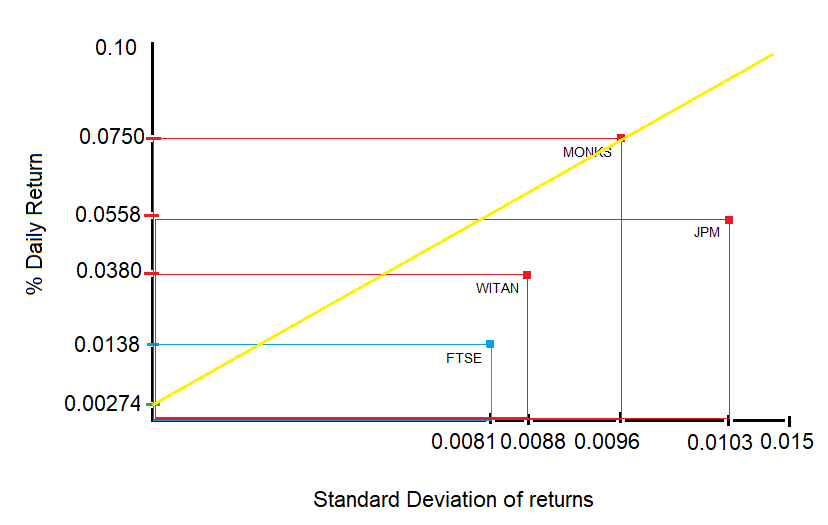
This graph reflects the portfolios of the investment trusts and their risk-return relationship. The Y axis shows the mean percentage of daily returns and the X axis represents total risk as standard deviation. Looking at the points plotted on the graph, it is easy to see that JP Morgan trust has a proportionally high level of risk in relation to the returns that it has been producing over the five-year period. Witan trust has lower levels of risk, but the returns are reduced pretty much at the same level. Monks, however, has the best risk-reward relationship as it sits on the security market line. Even though all portfolios are in the ‘efficient frontier,’ only Monks is in the ‘tangent efficient portfolio’ area of the graph.
Appendix 7 – Security market line
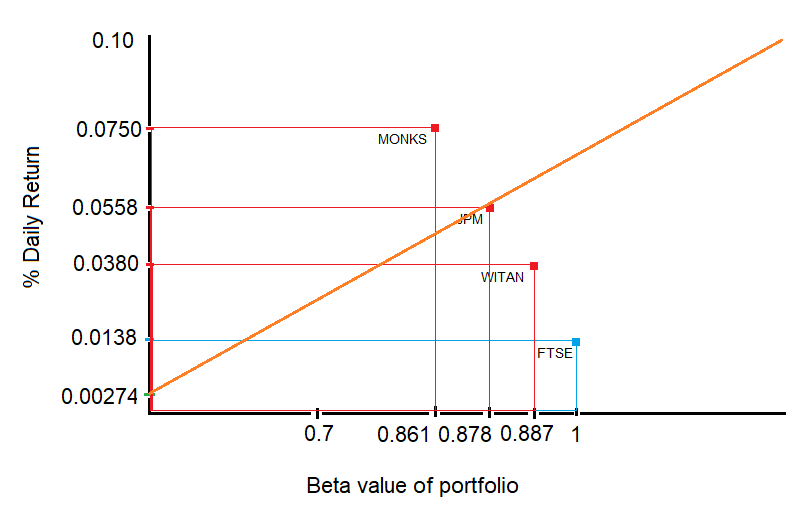
This graph reflects the portfolios of the investment trusts and their risk-return relationship. The Y axis shows the mean percentage of daily returns and the X axis represents systematic risk (market risk) as Beta. Looking at the points plotted on the graph, one would notice that JP Morgan trust is sitting on the security market line, which means that for its level of market risk, it is yielding the returns that it should. In these terms, we could say that this portfolio is efficient. JP Morgan may want to investigate ways of reducing individual risk (risk of the companies constituents) on its portfolio in order to get closer to the capital market line shown in the previous appendix. Monks on the other hand, has beat expectations as returns are much higher than one would expect for its Beta value. This is reflected on the Jensen’s Alpha measure.
Witan also appears here as the least efficient of the three portfolios. Reducing market risk and individual risk should be one of their priorities (and/or increasing returns). Looking for undervalued companies could be very useful to accomplish this.
Appendix 8 – Summary of results and ranking
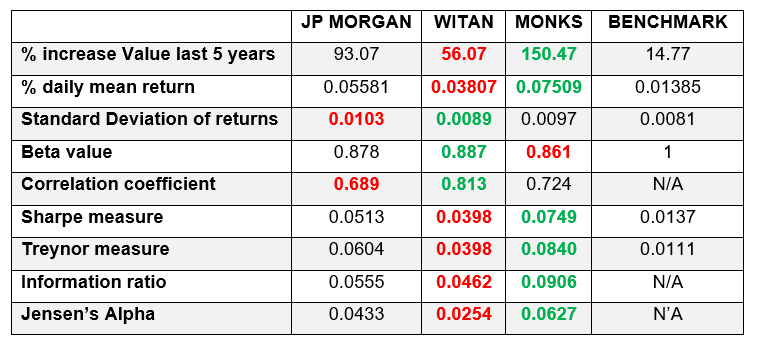
Monks investment trust has the highest Jensen, Information, Treynor and Sharpe measures and the highest returns. It ranks second when it comes to standard deviation of returns and correlation coefficient. Despite of the fact that it ranks last on Beta value, the three betas shown on the table are comparable (it is pretty much the same value). The analysis conducted for this report would indicate that it is recommended for the investor to invest in Monks investment trust. However, it is recommended that investors do further research before making a decision.