Essay on Accounting and Finance – Critical Appreciation for Strategic Advantage
Number of words: 4294
Introduction
Accounting is an essential vehicle that reports the financial information about an organization to different groups of individuals. Accounting entails two elements, including a reporting system, which communicates the financial information to the parties interested, and a process that summarizes the financial events of the firm. The success of a firm is portrayed through its financial position. Individuals use analytical tools such as financial statements to assess the company’s performance (Gibson 2009). Through the use of financial ratios, an individual can analyze the past performance of the firm, and extrapolate the future prospect of the organization and compare with the competitors in the industry. Revenue and profitability are considered essential factors that determine the failure or success of an enterprise. Organizations that start their operation should pay attention to how they manage the market. Thus, analyzing financial performance is essential for every organization. Most firms prepare their financial report annually (Gospodarowicz and Slazak 2015). A comprehensive financial analysis of Apple Inc. and Samsung is detailed below. Both companies are focusing on the same environmental concerns. Apple is committed to providing social responsibility across the supply chain around the world. Apple ensures that the suppliers are provided with safe conditions for working, use manufacturing processes that are environmentally responsible, and treat the workers with respect and dignity.
Case Company
To consider the topic, we will examine the example of the conglomerate industry. A conglomerate company is one very large company or corporation that supplies a variety of services and goods that do not necessarily relate to the other. Apple Inc. is a conglomerate company that manufactures, design and market a variety of portable music devices, computer software, and personal computers (Lipiec, 2015). The company was founded in 1976, who came with an idea and change how individuals view computers. Some of the products produced by apple include iPhones, iPods, and Macintosh. The strong and efficient value chain of Apple Inc. allowed the firm to expand its operation to more than 100 countries (Vasilaki & Tsakalidis Jr, 2019). Fueled by opportunities and globalization present in Asian markets, Apple Inc. recognizes the need to venturing into new geographical regions. Singapore has a unique market that requires competence and managerial expertise (Apple Inc. 2017). The capital of the firm comes from the services and products that the company offers to the customers. Currently, Apple is one of the leading organizations in the industry. The company is one of the profitable and fast-growing companies that can guarantee incomes worth multibillions as devices and technology are used across the world.
However, the modern conglomerate environment is characterized by an increased level of competition. Apple Inc. faces competition from different organizations, including Amazon, Dell, Facebook, HP, and Samsung, which have a powerful position in the industry (Iwai, 2020). Samsung Electronics was established in 1969, as Samsung is made up of different international businesses, including Samsung Life Insurance, Samsung C and T, Samsung Engineering, Samsung Heavy Industry, and Samsung Electronics, which are under the same brand. Samsung is one of the largest organizations across the world in terms of sales (Samsung 2019). The company specializes in the manufacture, supply, and market of a variety of industrial and consumer electronics, including integrated systems, memory chips, semiconductors, digital media devices, and appliances. Currently, Samsung has four divisions which include Harman, device solutions, IT and mobile communications, and consumer electronics. Based on research, Samsung electronics is most successful in the mobile communication and information technology division. Considering the situation of Samsung and Apple Inc. Considering the state of the organization, it is important to study the financial positions of the firm to understand if they can be recommended for investment. With this intention, the report will examine the financial health of the companies through financial statements and ratio analysis. Corporate social responsibility for Samsung is the adherence to the company’s management philosophy. The company is devoted to technology and human resources to create superior services and products, thus making a contribution to a better society.
Ratio analysis is a significant tool that organizations use to predict the future financial performance of an organization. It allows individuals to make effective decisions to ensure the firm achieves the objectives of the operation and promote business stability. Performing financial and ratio analyses plays an important role in improving the financial management of an organization by consistently analyzing the financial ratio.
Financial analysis
Financial analysis entails studying financial information about projects and organizations to understand elements such as cash flow, profits, and their costs (Agustina & Suprayitno, 2020). Financial analysis entails converting financial data into a piece of important information for decision making. Financial statements promote decision-making of different stakeholders including creditors and investors as it promotes stakeholder’s understanding of the organization through the use of historical data (Mautz and Angell, 2006). The financial performance of a company can be assessed by evaluating its capital structure, efficiency, profitability, and liquidity. An organization that is financially stable should have a good capital structure, profitability, and liquidity which can be based on ratio analysis on the balance sheets and income statements.
The study used Yahoo Finance to collect data from Apple inc. and Samsung balance sheet and income statement. The data selected was based on the needed requirements for the calculation of profitability ratio, debt, activity, and liquidity ratios.
Financial statements and trend analysis
It is noted that both Samsung and Apple’s Inc. the financial performance of Samsung grew as the total consolidated revenue of the company was 63.67 billion dollars for the second quarter of 2021. This is approximately a 20 percent increment from the second quarter of the preceding year. The financial performance of Samsung excelled as the operating cash flow in 2018 grew by about 31.18 percent as opposed to Apple Inc., which recorded negative growth (Myskova and Hajek, 2017). Despite Apple’s cash position remaining strong, the company was still surpassed by Samsung. Both organizations invested heavily in R&D in the past 5 years.
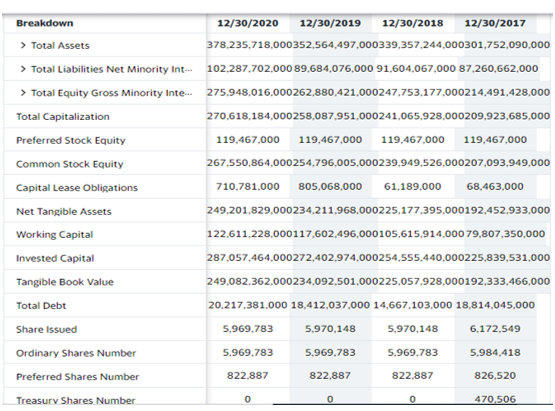
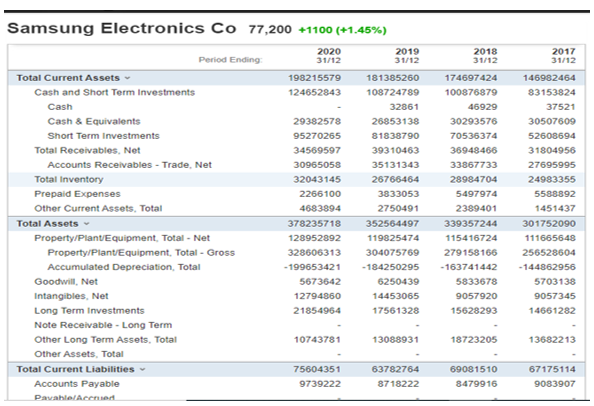
From the figure below, Apple has recorded a decrease in the total assets since 2017. The total assets for 2017 were $375.319 million, which decreased to $323.888 million for the period ended 29 September 2020. There has been an increase in the earnings and revenues from 2017 to 2020. On the contrary, Samsung has recorded an increase in the total assets from $301.751 billion to $378.235 billion from 2017 to 2021. Samsung has recorded an increase in the working capital from $78.807 billion to $122.611 billion from 2017 to 2020. Compared to Apple, total asset of Samsung is much higher.
Fig 1. Apple Inc. Balance sheet. Source Yahoo finance.
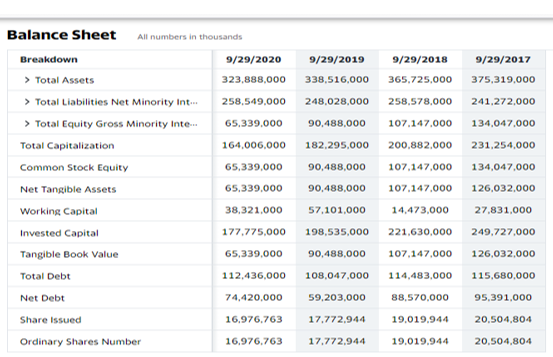
Fig 2. Samsung Groups Balance sheet. Source Yahoo Finance.
It can be noted that Samsung almost doubled the investment in the previous years due to competitive forces from other players, including Apple, and fewer brands gained a larger market share in Singapore. On the contrary, Apple faced several challenges that relate to the increased cost of improving and developing technologies for the products in 2017, which promoted negative growth in supply and sales in 2017.
Liquidity Ratio
It is significant for an organization to maintain enough liquidity to fulfill the company’s current obligations and keep the business operating. This report examines several critical ratios, including cash, quick and current ratios (Hayes, 2019). The table below provides the current, quick, and cash ratios of Samsung and Apple.
Current Ratio. This is a liquidity ratio that measures if an organization has enough resources to facilitate short-term obligations. A good current ratio is anything more than 1, with an ideal current ratio ranging from 1.5 to 2. In this case, an organization has enough money to meet the company’s liabilities while using the capital in an effective way (Ng et al., 2019). The current ratio for Apple Inc. improved from 2018 to 2019, but the ratio deteriorated again from 2019 to 2020. Apple’s current ratio, according to Yahoo Finance, is approximately 1.01 compared to the industry’s current ratio of 1.28. The current ratio for Apple Inc. for the second quarter of 2021 was 1.06. The current ratio of both companies declined between 2016 and 2017.
Fig. 3 below shows a graph for the current liabilities, current assets, and current ratio for Apple.
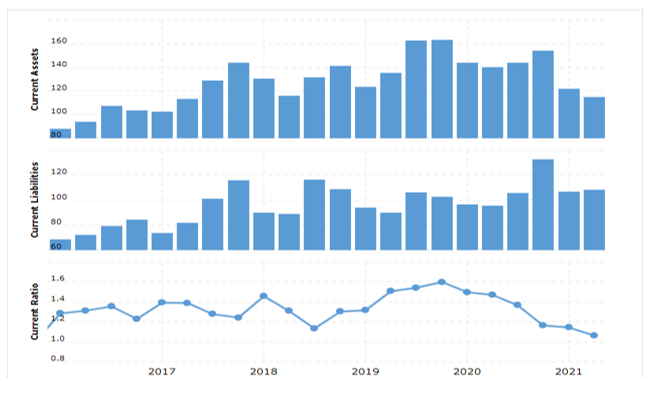
Source. Macrotrends. https://www.macrotrends.net/stocks/charts/AAPL/apple/current-ratio
Apple Inc. has recorded a stable current ratio for the past years as compared to the ability of the firm to pay debt decreased. On the contrary, Samsung maintained a higher current ratio compared to Apple, showing that the company has a higher ability to pay debts. The factors that might have contributed to the healthy current ratio might be the company’s cash balances. It is clear that Apple Inc. held fewer investors compared to Samsung.
Quick Ratio
The quick ratio refers to the short-term liquidity position of an organization, which covers the firm’s current liabilities. The ratio is determined by dividing the company’s current assets by current liabilities. When the quick ratio of the company is 1.0, it means that the organization is liquid enough to pay the debts (Rashid, 2018). A liquid ratio less than 1.0 shows that an organization encounters troubles when paying the debts. Apple Inc.’s current ratio as of 30 June 2021 was 1.01, which is a slight decrease from the quick ratio of the first quarter of 2021, which was 1.09. Apple has recorded a decrease in the quick ratio for the past three years, as shown in the table below.
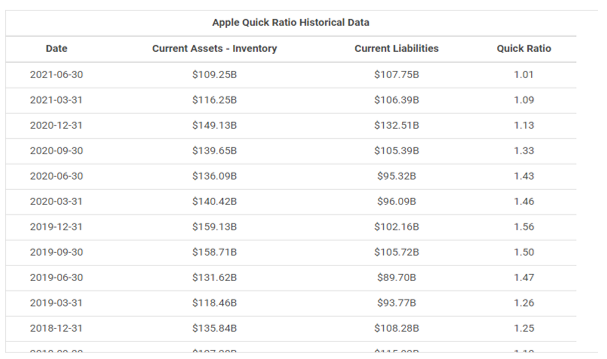
Apple Quick ratio. Source macrotrends.
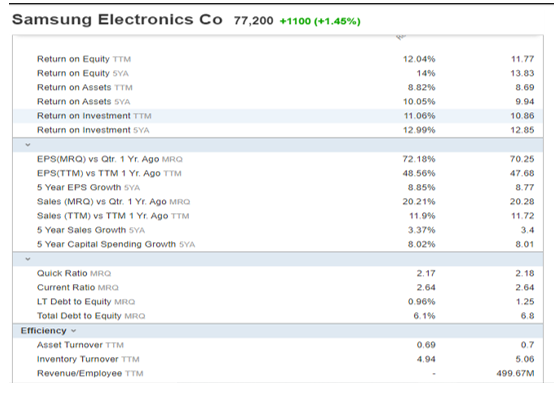
On the contrary, Samsung recorded a higher quick ratio of 2.17 compared to the quick industrial ratio of about 2.18.
Source. Investing.com. https://www.investing.com/equities/samsung-electronics-co-ltd-ratios
The quick ratio for both organizations was above 1 in the last five years. From the quick ratio, it is clear that Samsung had more inventories compared to Apple Inc. This states that the short-term strategy of Samsung to control the inventories and increase sales did not work effectively. Samsung has a better quick ratio due to more current assets and less current liabilities, which is essential for the organization to achieve its growth.
Cash ratio
Cash ratio refers to the ability of the firm to pay its short-term debt. To calculate the current ratio, an individual should consider the value of marketable securities and cash, then divide the value by the company’s current liabilities (Ganc, 2018). A cash ratio of more than 1 shows that an organization is able to pay off the debts while maintaining the cash left. The cash ratio for Samsung Company is 1.65 compared to Apple with a cash ratio of 1.06. Both organizations had a better and strong position and were not likely to face any financial constraints, which is essential for the efficiency of the business. This is because Samsung had a significant improvement in cash position and the benefits obtained from the low cost of sales. On the contrary, Apple reported a decrease in the operating cash flow of the company.
Efficiency Ratios
The efficiency ratio measures the ability of the company to generate income from the assets. Common efficiency ratios include accounts payable, net working capital, inventory, fixed asset turnover, and accounts receivable turnover. The latest asset efficiency of Apple is 32.3%. The asset efficiency of Apple Inc. for the year ending September 2016-2020 averaged 21.0%. The latest asset efficiency of Samsung is 34%.
Solvency/Gearing Ratio
The solvency ratio refers to a performance metric, which helps individuals to examine the financial benefit of the company. The solvency ratio helps to determine if an organization can meet its financial obligations in the long run. The ratio is important to suppliers, potential investors, lenders, and other entities that would like to conduct business with any organization. A solvency ratio of more than 20% is considered good. Apple Inc. had a solid solvency ratio of 24.92 in the fiscal year ending 2020. On the contrary, Samsung recorded a solvency ratio of 21.81 in the fiscal year ending December 2020.
Solvency Ratio = (Net Income + Depreciation) / All Liabilities (Short-term + Long-term Liabilities)
Stock Market (Investment)
The stock market refers to where institutional and individual investors come together to sell and buy shares in a public venue. Investing in the stock market is beneficial as it can offer benefits that are not limited to 10% annualized return or earn dividends. Apple invested in stock markets under the name AAPL. The average target price for AAPL is 169.64 dollars, and the lowest forecast for the stock market is $140. Samsung is listed in the stock market under the stock symbol SSSNLF: USOTC US. Despite the company itself being traded publicly for more than five decades, the firm had 19 listed and 59 unlisted companies on the Korean stock exchange.
PE Ratio
PE ratio is used for the valuation of an organization, which measures the current share price relative to EPS. Analysts and investors use the PE ratio to determine the relative value of the shares of a company. Apple Inc. recorded a trailing PE ratio of 28.73x compared to the conglomerate industry PE ratio of 19.13X. The PE ratio for Apple in 2021 is 27.78X (Yahoofinance). The PE ratio shows that the products are expensive compared to the market’s long-term average. On the contrary, Samsung has a lower PE ratio of 16.07. The multiple shows that investors expect growth from the organization in comparison to the market.
Dividend Yield
Dividend yield entails a financial ratio, which shows the percentage of the share price of an organization, which the firm pays out in dividends every year. This shows the risk involved when investing in an organization. The dividend yield ratio shows the amount the firm is paying out in dividends every year in relation to the share price of the market. The current dividend yield ratio of Apple is 0.59%. During the past decade, the highest annual dividend that apple recorded was 2.77%. Samsung Company reported 3.72 in dividend yield for the second quarter of 2021.
Stability ratio
The stability ratio provides an insight into the financial security and stability of an organization. The analysis of the stability ratio investigates the amount of debt that a company can support. Examples of stability ratios include gearing ratio, D/E ratio, debt service cover, book versus real values; Apple Inc. can stand higher financial stability due to high cash reserves and strong equity ratio. Apple reported a D/E ratio of 50% in 2016, which increased to 112% by 2019. An ideal D/E ratio is below two, showing that Apple has a good performance. The debt-to-equity ratio for Samsung for the second quarter of 2021 is 0.0584.
Return on Assets (ROA)
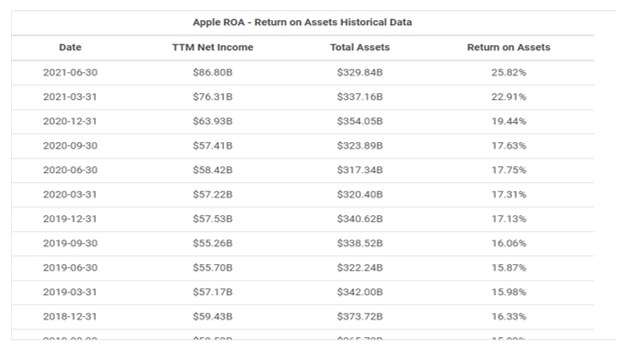
According to Gaspodarowicz & Slazak (2015), Return on Assets refers to the measure of the company’s profit per asset dollar. Lipiec (2015) asserts that ROA reflects how the company’s management spends the assets to generate profits. ROA can be calculated by dividing the total assets from the current and previous periods and dividing them by 2. Apple recorded an increasing return on assets for the past five years. The return on assets for the second quarter of 2021 was 25.82% which is a 2.91% increase from the first quarter’s return on assets which was 22.91%.
On the contrary, Samsung recorded a decrease in ROA for the past three years. The return on assets for the company for 2018, 2019, and 2020 were 13%, 6.22%, and 7.14, respectively. In 2021, Samsung will have recorded a 10.1% ROA. This shows that Samsung Company is more efficient in using the assets to generate high-income levels compared to Apple Inc.

Return on Equity
This is the most commonly used ratio. ROE is mainly used to measure the return on the investment of the organization. An organization can improve the return on equity by improving its return on assets or effectively using the leverages (Yusoff & Husnina, 2018). Return on equity is calculated by multiplying the leverage to the company’s return on assets. ROE measures the profitability of a corporation by showing the profit amount generated by the company with the investment of their shareholders. The return on equity of apple has increased gradually for the past five years. The ROE as of 20 June 2021 was 131.01% compared to 20 June 2020 70.66%. Samsung recorded a lower return on equity for the past five years (Abadi et al., 2019). The ROE for Samsung for 2018, 2019, 2020, and 2021 was 19.0%, 8.69%, 10.0% and 14% respectively. Apple from the analysis, Apple Inc. generated higher returns on the equity of shareholders as compared to Samsung. There was a gradual improvement in Samsung’s net profit, and there was an increase in the company’s retained earnings. The cost-effective strategies of Samsung contributed to the growth in the earnings of the company.
Net profit margin ratio
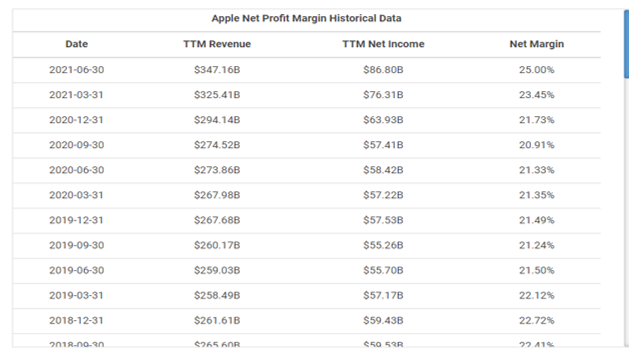
This ratio measures how much net profit or net income is generated as revenue’s percentage. The net profit margin ratio can be expressed as a percentage (Manglik and Goyal, 2016). The net profit margin for Apple Inc. decreased from 22.72% to 22.12% from 2018 to 2019. The net profit margin for the second quarter 0f 2021 was 25%, a slight increase from 23.45% from the second quarter. The net profit margin for the financial year ending 31 December 2020 was 21.73%. On the contrary, the net profit margin of Samsung for the second quarter is 12.52%. The operating margin is equal to 16.83%.
Balance Sheet
Cash Flow Statement, Income statement, and balance sheet is a significant financial statement. Corporate Financial Institute (2019b) asserts that a balance sheet is a financial statement that displays the total assets of the company and how the assets are financed through equity and debt. The balance sheet is based on the equation where Equity and Liabilities are equal to the assets. In relation to Karwowski (2015), liabilities refer to a present obligation of an organization that arises from historical events, whose settlement expects to promote an outflow that embodies the economic benefit of the resource. Apple has recorded a decrease in the balance sheet balance for the previous five years. The Annual asset for 2019 and 2020 was $338,516 million and $323,888 million respectively. On the contrary, the balance sheet for Samsung Incorporation has increased for the past four years. The balance sheet for Samsung from 2017 to 2020 was $301.752 million, $339.357 million, $352.564 million, and $378.235 million, respectively.
Inventory Turnover
Inventory turnover refers to a measure of the times an inventory is used or sold in a given time. Inventory turnover is calculated to ascertain if an organization has excess inventory (Alcaide González et al., 2020). A good turnover ratio is between 2 and 4. If the ratio is low, it means that the inventory turnover could be a decrease in product popularity or weaken the sales performance. Higher inventory turnover shows a healthy sales level, while lower inventory represents a lack of sales. The inventory turnover ratio for Samsung electronics as of March 2021 was 1.30. For the past year, Apple Inc. has been operating at the median turnover of 40.4. There has been a decrease in the company’s inventory turnover from 2016 to 2019.
Working Capital
Working capital refers to the metrics that assess the ability of the company to use the current assets to pay current liabilities. It represents the difference between the quick assets and current liabilities of an organization (Alnuaimi and Nobanee, 2020). The components of working capital include current assets and current liabilities. The current working capital for Apple is 27.86 billion dollars (Amin et al., 2020). The increase in the current liabilities resulted in a fall in the working capital ratio of Apple. The networking capital per share for Samsung for the second quarter of 2021 was $5.72. The networking capital of Samsung decreased by 11.2 percent in 2016 to 9.875 billion.
Conclusion
Based on the analysis above, both Samsung and Apple Inc. are strong and healthy financially. The growth of the organizations has been massive and extraordinary in the past half-decade. Apple Inc. uses current liability to finance its operations. The financial structure of Apple is outstanding, with equity amounting to 100 percent. The revenues and income of the company are increasing annually. For the past three years, Apple Inc. has improved in its significant profitability measures. The company has a financial strength in profit margin, return on equity and return on investment. The future of the company looks great, as the company has a strong portfolio, innovative product design, and massive brand power that leverages products to boost product demand.
Samsung electronics appear to be stable in terms of its capital structure and liquidity. The liquidity of Samsung electronics has grown for the past five years, creating a long-term benefit to the firm. The activity ratio of Samsung depicts the firm to be efficient. However, the pandemic had a huge impact on the economic environment and the financial performance of many organizations. The constant technological development and innovation are likely to continue increasing the revenues of Samsung. Samsung is expected to demonstrate higher margins compared to other players in the market. The profitability ratio, ROE, and ROA show that the organization has been efficient in utilizing the total assets to generate sales, which promotes an increase in profits. The drop in the ratio can influence the decisions of stakeholders and investors to invest as it can show low returns.
Recommendations
- Samsung has continued to control a major part of the electronic market. The profitability of Samsung has improved over the past few years. The ratios depict Samsung to be efficient and stable. The overall ratio deems the company to be in a better state currently, as the company seems to be financially healthy in terms of its capital structure, total assets, ROE, ROA, and inventory turnover. It is advisable for creditors and investors to invest in Samsung electronics.
- I feel that Samsung will continue growing in the future and will continue creating stiff competition in the market. I expect Samsung electronics to demonstrate high earning margin than Apple Inc. as the company remains in the lower margin pc sector and move into smaller consumer electronics.
References
Abadi, K., Purba, D. M., & Fauzia, Q. (2019). The Impact of Liquidity Ratio, Leverage Ratio, Company Size and Audit Quality on Going Concern Audit Opinion. Jurnal Akuntansi Trisakti, 6(1), 69-82.
Agustina, Y. N., & Suprayitno, H. (2020). ANALYSIS OF FINANCIAL STATEMENTS USING LIQUIDITY RATIO TO MEASURE FINANCIAL PERFORMANCE IN 2017- 2019. JOSAR (Journal of Students Academic Research), 5(2), 32-39.
Alcaide González, M. Á., De La Poza Plaza, E., & Guadalajara Olmeda, N. (2020). The impact of corporate social responsibility transparency on the financial performance, brand value, and sustainability level of IT companies. Corporate Social Responsibility and Environmental Management, 27(2), 642-654.
Alnuaimi, S., and Nobanee, H. (2020). Working Capital Management and Sustainability: A mini- review (2020).
Amin, S., Hashim, S., Saif, N., & Kanwal, A. (2020). The Effects of Capital Structure on Firm’s Profitability (A Case Study of Samsung Company Limited). International Journal of Management (IJM), 11(8).
Apple Inc. “Apple Inc. Annual 10K Report 2017.” Apple. Web.
Ganc, M. (2018). Level of the current liquidity ratio versus financial efficiency of dairy cooperatives. Problems of Agricultural Economics, 2(355).
Gibson, C. (2009). Financial Reporting and Analysis. Using Financial Accounting Information. 11th edition. South-Western Cengage Learning. Mason.
Gospodarowicz, M. and Slazak, E. (2015). Corporate Financial Analysis. Warsaw School of Economics. Warsaw.
Hayes, A. (2019). Liquidity ratio definition.
Source. Investing.com. https://www.investing.com/equities/samsung-electronics-co-ltd-ratios
Iwai, H. (2020). Practicing the Company Philosophy to Survive: The Competitive World of Samsung Group. In Cultural Translation of Management Philosophy in Asian Companies (pp. 121-135). Springer, Singapore.
Karwoski, M. (2015). Accounting and Financial Reporting. Warsaw School of Economics. Warsaw.
Lipiec, J. (2015). Company Valuation. Warsaw School of Economics. Warsaw
Macrotrends. https://www.macrotrends.net/stocks/charts/AAPL/apple/current-ratio
Manglik, M. and Goyal, A. (2016). Operating Margin Ratio (A Comparative Study of Selected Public and Private Sector Companies). ISSN-2250-1991, pp. 133-134. Paripex – Indian Journal of Research. India.
Manglik, M., & Goyal, A. (2016). Operating Margin Ratio (A Comparative Study of Selected Public and Private Sector Companies). Indian Journal of Research, 5(5), 133-134.
Mautz, R., and Angell, R. (2006). Understanding the basics of financial statements analysis. Commercial Leading Review. Pp. 27-34.
Myskova, R., Hajek, P. (2017). Comprehensive assessment of financial performance using financial ratios and linguistic analysis of annual reports. Journal of international Studies.
Ng, T. H., Tan, S. K., Ahmad, A., Joshi, R. C., Wang, W. Y., Tan, H. H., & Yeo, D. C. (2019). Not in the Least Concern: anthropogenic influences on a South-east Asian apple snail Pila scutata (Ampullariidae). Oryx, 53(2), 230-238.
Rashid, C. (2018). Efficiency of financial ratios analysis for evaluating companies’ liquidity. International Journal of Social Sciences and Educational studies.
Samsung (2019). Samsung electronics Co., Ltd. 2019 Business Report.
Vasilaki, M., & Tsakalidis Jr, G. (2019). Apple Inc. Equity Valuation.
Yahoofinance. https://finance.yahoo.com/quote/AAPL/
Yusoff, M., & Husnina, N. (2018). Determinants of Risks and Performance in Apple Inc. Available at SSRN 3181705.