Efficient Portfolio With a Combination of Equity and Discusses How the Shares Selected Work Together
Number of words: 3557
Executive summary
This report details the creation of an efficient portfolio with a combination of equity and discusses how the shares selected work together, as well as its implications in terms of its volatility-performance relationship. Assuming that the portfolio had been hold for the last three years, its performance is analysed using some of the most common metrics in the industry. Also, an alternative option is given with a portfolio composed of equity and risk-free US treasury bills. Towards the end, a hedging strategy using put options is used to reduce risk in a portfolio with only one risky security.
1. Asset allocation
For the purposes of the creation of this portfolio, we will avoid cash as it is an asset that depreciates over time as inflation increases. In order to maximise the returns produced by the portfolio, investors should put the money in, at least, treasury inflation protected securities (TIPS), US treasuries which return is equal to the increase of inflation.
This is especially true of the current economic environment. Governments and central banks have been executing a number of quantitative easings to ameliorate the negative effects of 2008 recession and the Covid-19 pandemic over the economy. One of the side effects of this monetary policy practice is that it comes with spikes in inflation. TIPS should help hedge against this.
Having said this, the objective of the investors at the hedge fund would obviously be to make up a portfolio with a combination of assets that would perform better than the market benchmark (FTSE 100 index) in all kinds of environments and situations. If the benchmark goes up by 10%, the portfolio in question should go higher. If the benchmark drops by 10%, this should have a minimal impact on the portfolio – all of this of course with reduced risk.
According to what it has been stated above, it is advisable to invest the £1M of capital in a portfolio that resembles the following chart.
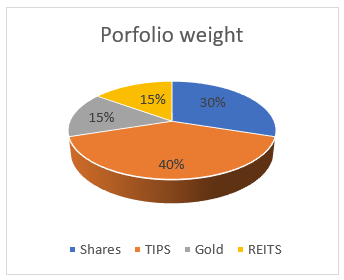
- Equity £300,000
- TIPS £400,000
- Gold £150,000
- REITS £150,000
£1,000,000
1.1 Gold
Gold has established itself as a kind of “anti-money”. It is seen as the opposite of the euro or the US dollar, which are fiat currencies. The fact that gold is limited makes it so interesting and valuable. Fiat currencies, on the other hand, are theoretically unlimited. The amount of gold (spot market) only increases by about 1.5% every year. However, it is safe to say that this figure will decrease over the years as the amount of this commodity in underground reserves dries up by 1.5% per year due to mining.
The demand for gold has remained stable over the years. This is due, for example, to the electrical, medical and jewelry industries, which account for about 60% of demand. The remaining 40% is filled by speculators and investors. The demand for the precious metal is what drives the price. Gold is considered a real asset in the financial industry.
The dynamics between supply and demand describe the value as stable over the long term. On the one hand, an investment in the precious metal offers the opportunity to speculate with its value. For example, the central banks increase the money supply or other factors, which leads to hyperinflation. Especially here it is worthwhile to hedge against the market in order to hedge its risk with gold. Since gold has often shown a negative correlation with stock market returns since the 1970s, owning gold is seen as a hedge against market volatility (Van Hoang, Lahiani & Heller, 2016), depending on the circumstances (see risk hedge matrix further below). Investing in gold is considered a kind of safe decision, as gold is popularly regarded as a haven.
1.2 Treasury inflation protected securities (TIPS)
This type of US treasury has a significant share in this portfolio. The reason for the 40% weight in these is that bonds are also considered to be a kind of haven. They are especially attractive to investors who are trying to minimize their portfolio risk and lower the overall volatility due to their low-risk characteristics. If you look at bonds over the course of a long-term investment over the past 20 years, their annual return is just 5.5%. However, the current economic landscape suggests that we are about to experience a spike in inflation (due to increases in the money supply), which should preserve the value of the money invested. This, combined with equity, would appropriately reduce the risk of the portfolio.
Risk-hedging with treasuries makes sense, especially when the investment horizon is less than 5 years. The shorter the investment in, for example, shares, the higher the risk of the portfolio. In an attempt to lower this risk over the short term, treasuries are particularly worthwhile for shorter investment horizons. Due to the fact that the portfolio is made for the long term, a high proportion of treasures in relation to equity has been chosen for better risk aversion and stability.
1.3 Equity
One of the decisions to invest in stocks is based on risk tolerance, which states that without risk there is no return. One of the main advantages of share trading is that it is associated with better short-term results. Even though the situation of the market price for a longer period is often difficult to estimate, in the stock market, investments that flow into the stock market are often associated with high returns, which are in the form of dividends or capital gains. The individual benefits by making a profit as a participant in the markets. As a further point and for this report essential advantage lies in the fact that this asset class also offers the individual long-term investment possibilities. For example, saving for retirement. This point is particularly emphasized since the investors of this project have decided to invest for the long run. Although the prediction of the stock market may seem difficult, with long-term participation, one learns how to operate to avoid losses. In addition, shares provide liability protection to the passive shareholders through the reserves created in the organizations (Kinsella, 2021).
1.4 Real estate investment trusts (REITS)
Real estate has long received the attention of investors. On the other hand, prices continue to soar, which makes the dream of ownership increasingly vaguer and more unrealistic.
If we have a look at the last ten years, it becomes clear that in the last decade alone, the purchase price per square meter of condominiums (40-120sqm) in Germany has increased by 126% (Schmidt, 2020). In direct comparison, the most important German stock market (DAX) has risen only by 88%.
Looking at the last decade using the Dax index as a benchmark for the average increase in value of shares, it is clear from an example calculation in Germany that the increase in value of condominiums is 43% higher than that of securities.
The FTSE NAREIT all equity REITS also shows to have outperformed the S&P 500 index (on average), which further supports real state as an item to incorporate in the portfolio.
1.5 Overall portfolio strategy and expected performance
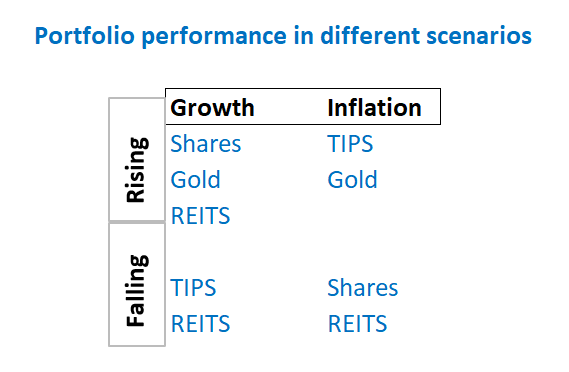
The idea behind this portfolio is to reduce risk as much as possible while achieving a premium over the market return. The asset classes chosen are expected to provide with stability and a minimal variance.
In an environment of inflation, TIPS and gold will provide with most of the returns. In this scenario, the value of REITS would not change much. Higher inflation could potentially prevent people from buying real estate, but landlords and agencies would still collect rent or mortgage payments. Positive returns.
In an environment of deflation, shares would be in charge of providing with expected returns while compensating for any losses from any other asset. REITS, again, would help keep the balance in place.
In an economic environment of growth, shares, gold and REITS would provide high returns. The money invested in TIPS would not decrease in value as it would be increasing along with inflation.
In an economic environment of recession/contraction, TIPS and REITS would help sustain the value of the portfolio and prevent it from generating significant low returns. Depending on the circumstances, also gold could sustain its value and help compensate for inflation.
2. Equity allocation and performance
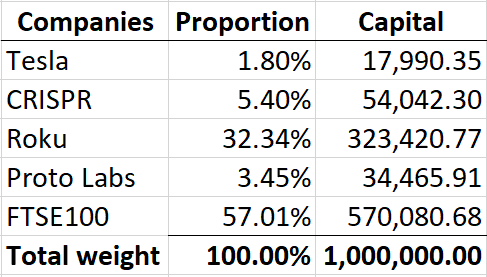
The selected shares for the equity weight of the portfolio will be Tesla, CRISPR, Roku, Proto Labs and a FTSE 100 index fund. Further explanation follows.
2.1 TESLA
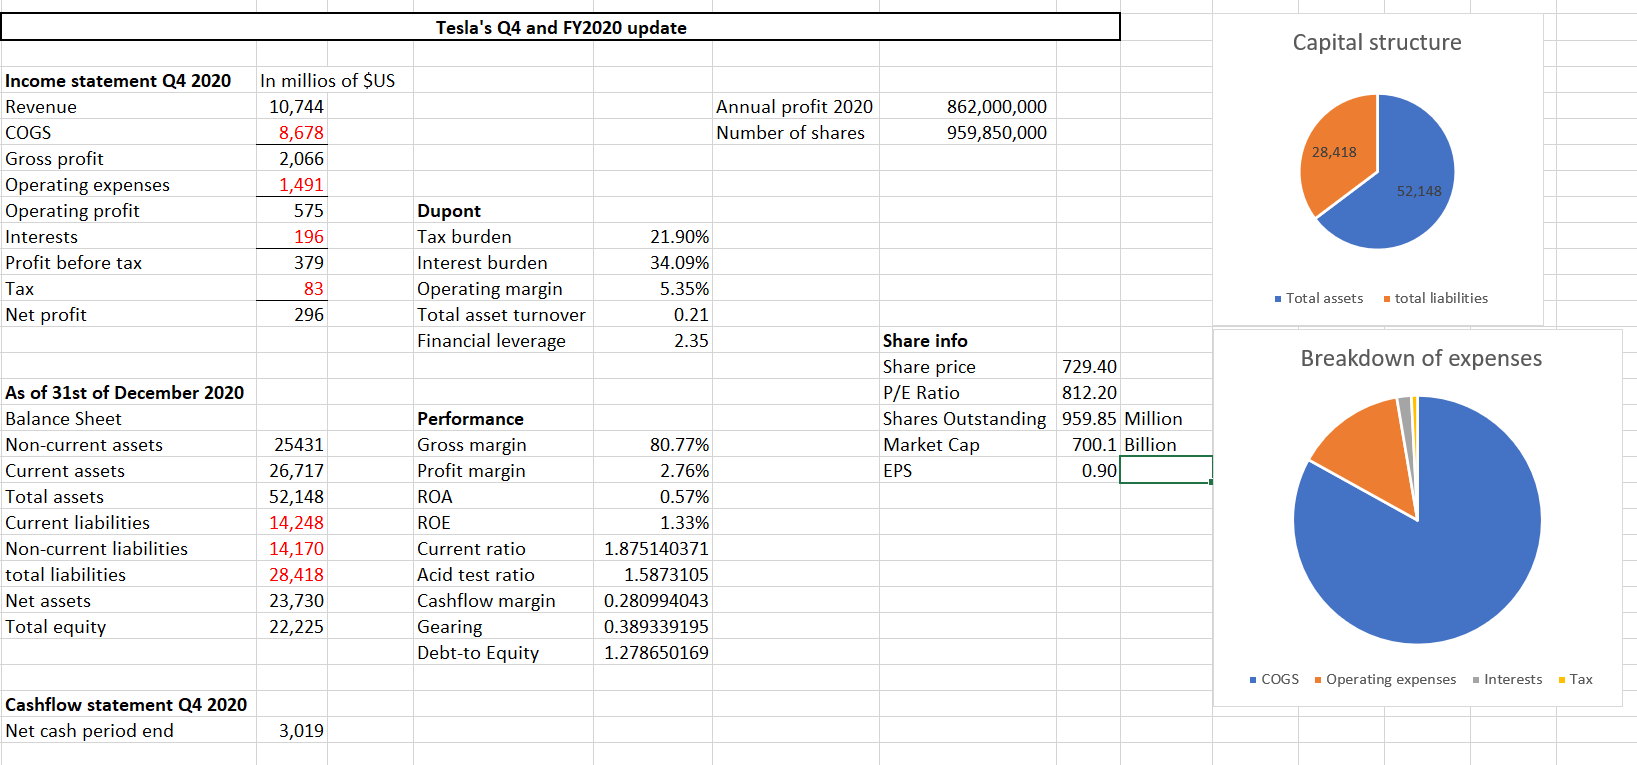
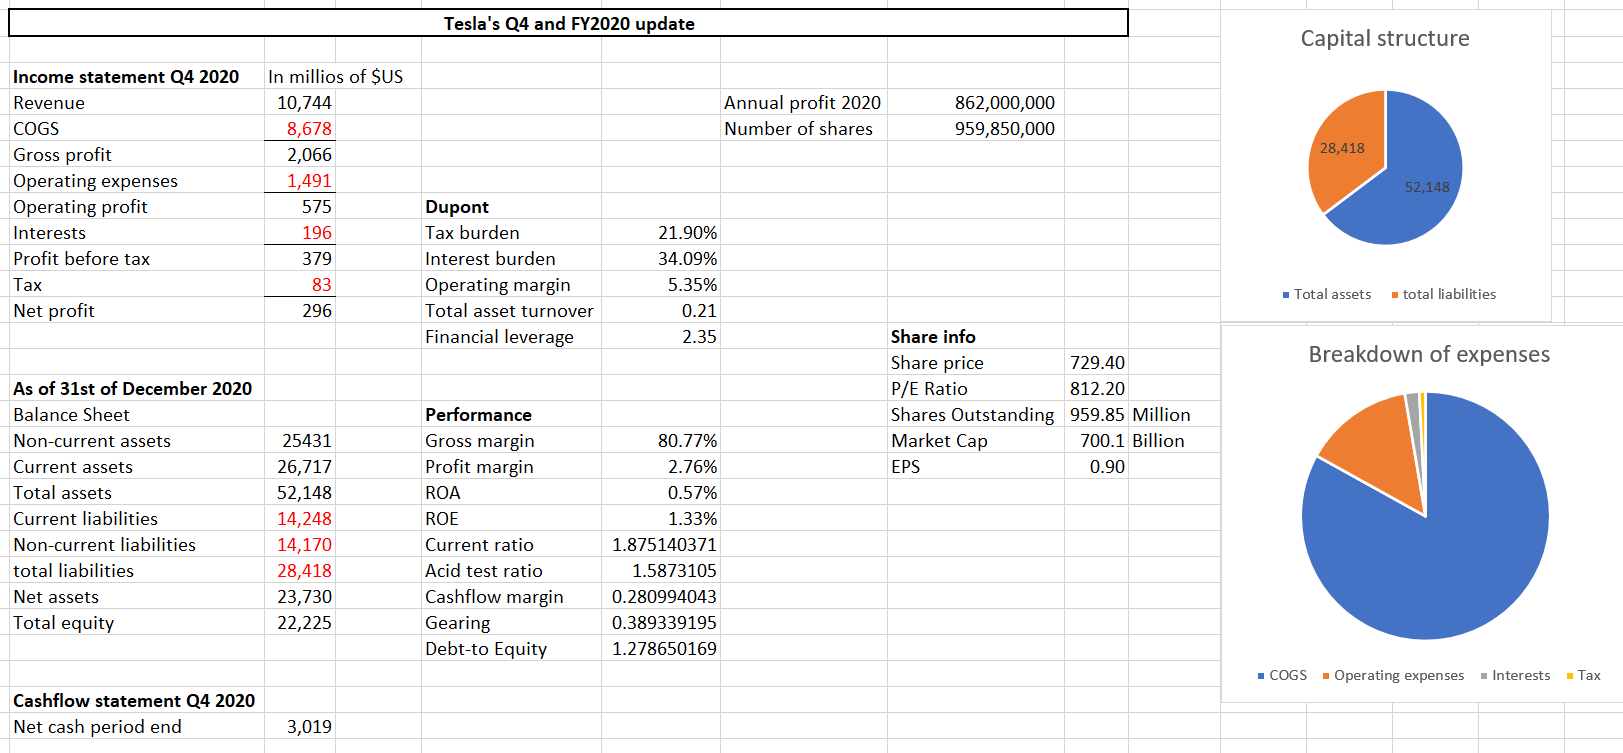
Source: Tesla’s press release 4Q and financial year 2020 – see appendix for more details
Strengths: High barriers to entry in the industry, product differentiation (electric cars), low bargaining power or clients, good reputation.
Weaknesses: High suppliers’ bargaining power, many potential substitutes for their products.
Opportunities: Disruption of the industry as it switches to sustainable energy.
Threats: Full transition to electric cars in the industry not achieved (unlikely).
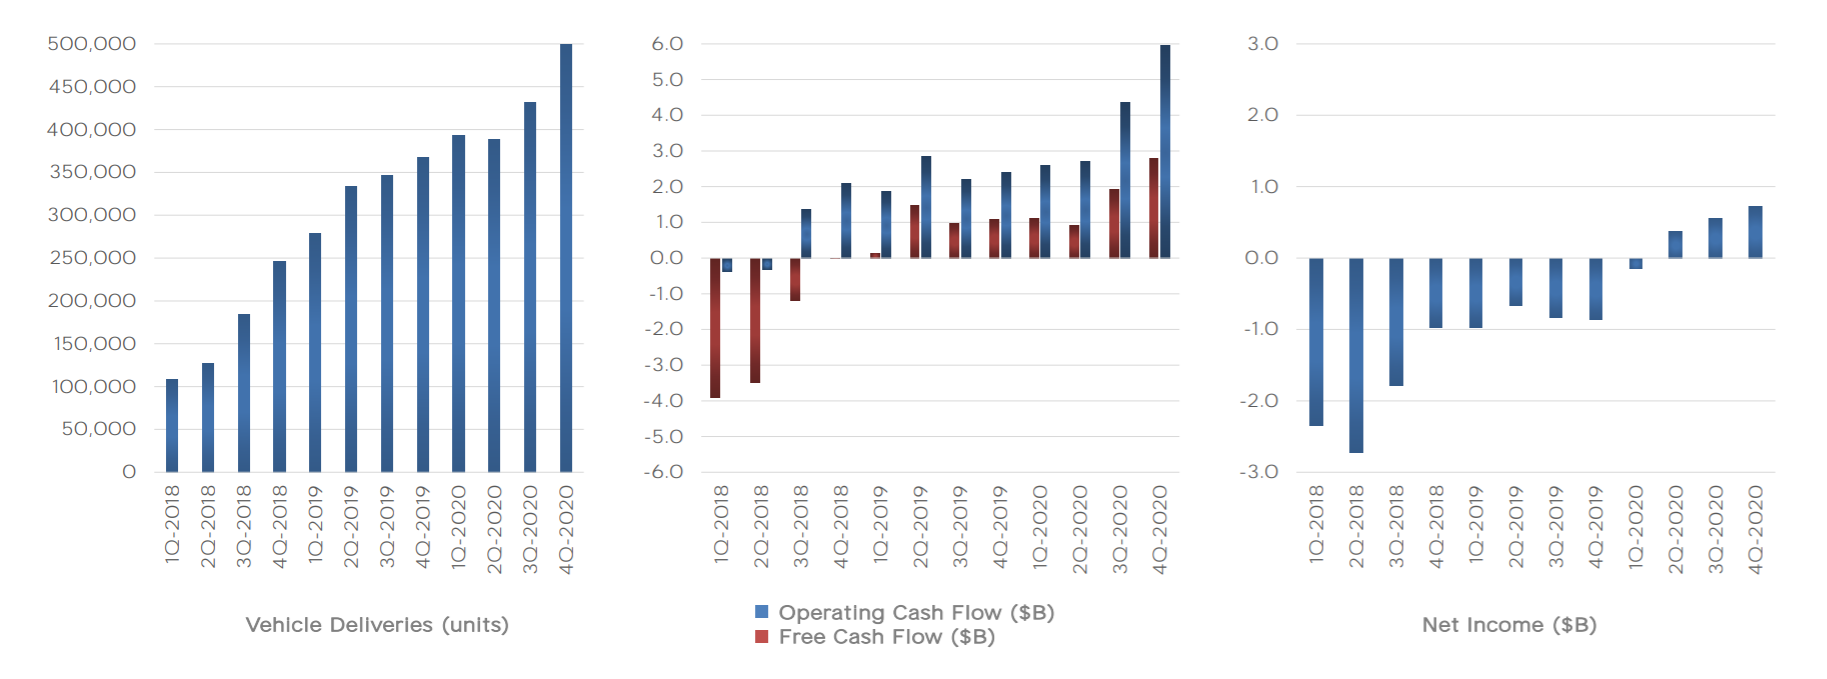
Tesla is the leading electric vehicle producer in the world. As shown in the chart above, the delivery of vehicles has been increasing every quarter since 2018 and this is expected to be sustained into the future as price of oil increases and the industry shifts to renewable energy (governments expect net zero carbon emissions by 2050). This share has been picked for its high growth potential.
The breakdown of equity by DuPont shows that 21.9% of the profit before tax goes away in taxation, 34.09% goes towards interests and the operating margin stays low (expected due to big overheads) at 5.35% of sales. For every $1 of assets only 0.25 cents of profit are produced. Financial leverage of 2.32 times equity.
The current and acid test measures look strong at well over a ratio of 1 over current liabilites, showing strong liquidity. The cash generated from operating activities is 28.1% of sales, the gearing ratio shows a moderate level of leverage and the debt to equity ratio concludes with the debt being 1.28 times the equity.
Most of the measures indicate strong performance except for the price-to-earnings ratio, which suggests that Tesla shares are extremely evervalued and, according to financial theory, a crash is imminent. However, on trader floors, this is an indication of very high quality profits as expectations of the future performance of the firm keep on getting better.
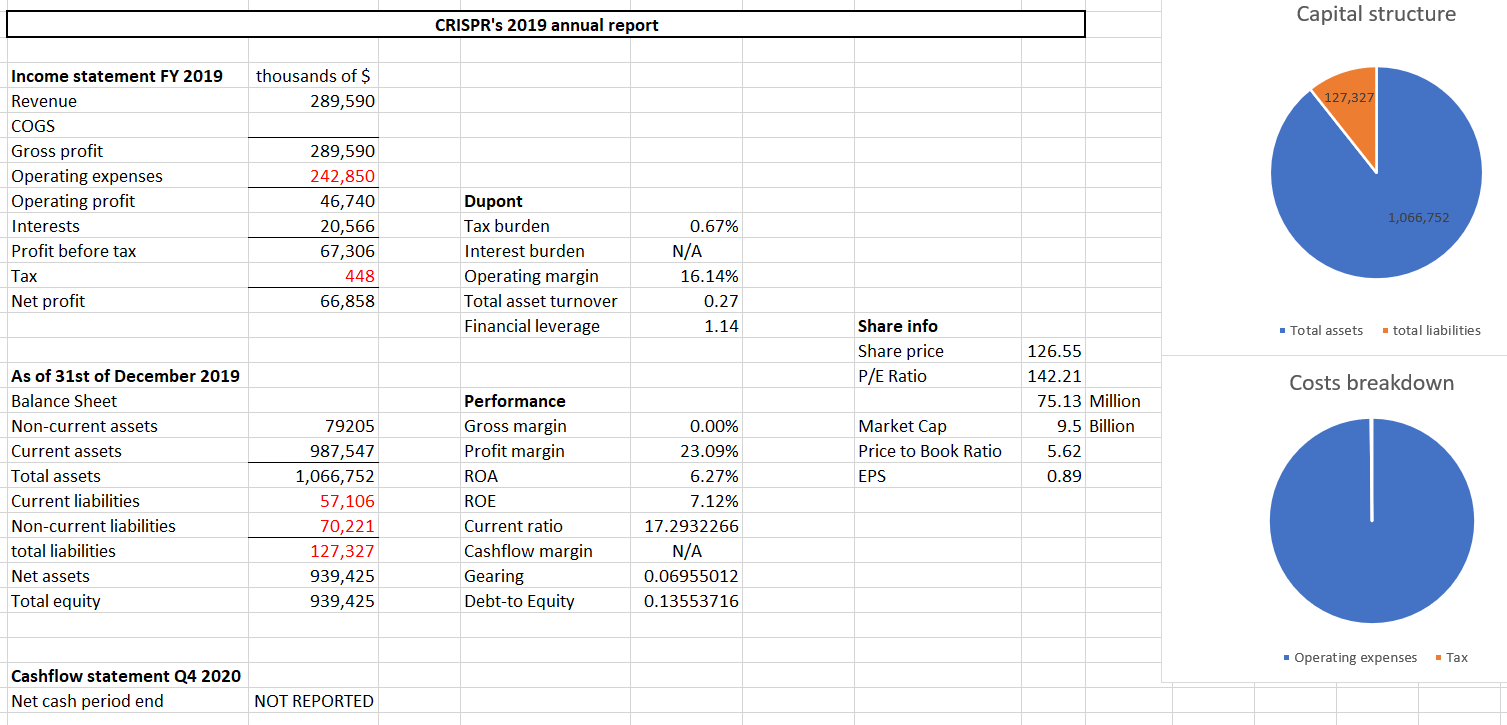
2.2 CRISPR Therapeutics
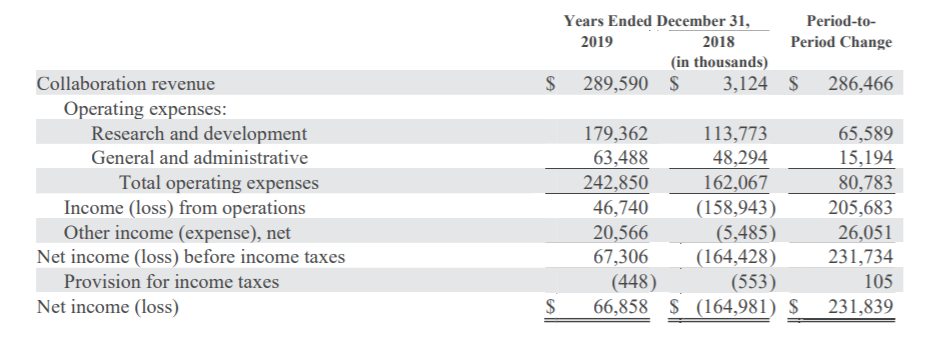
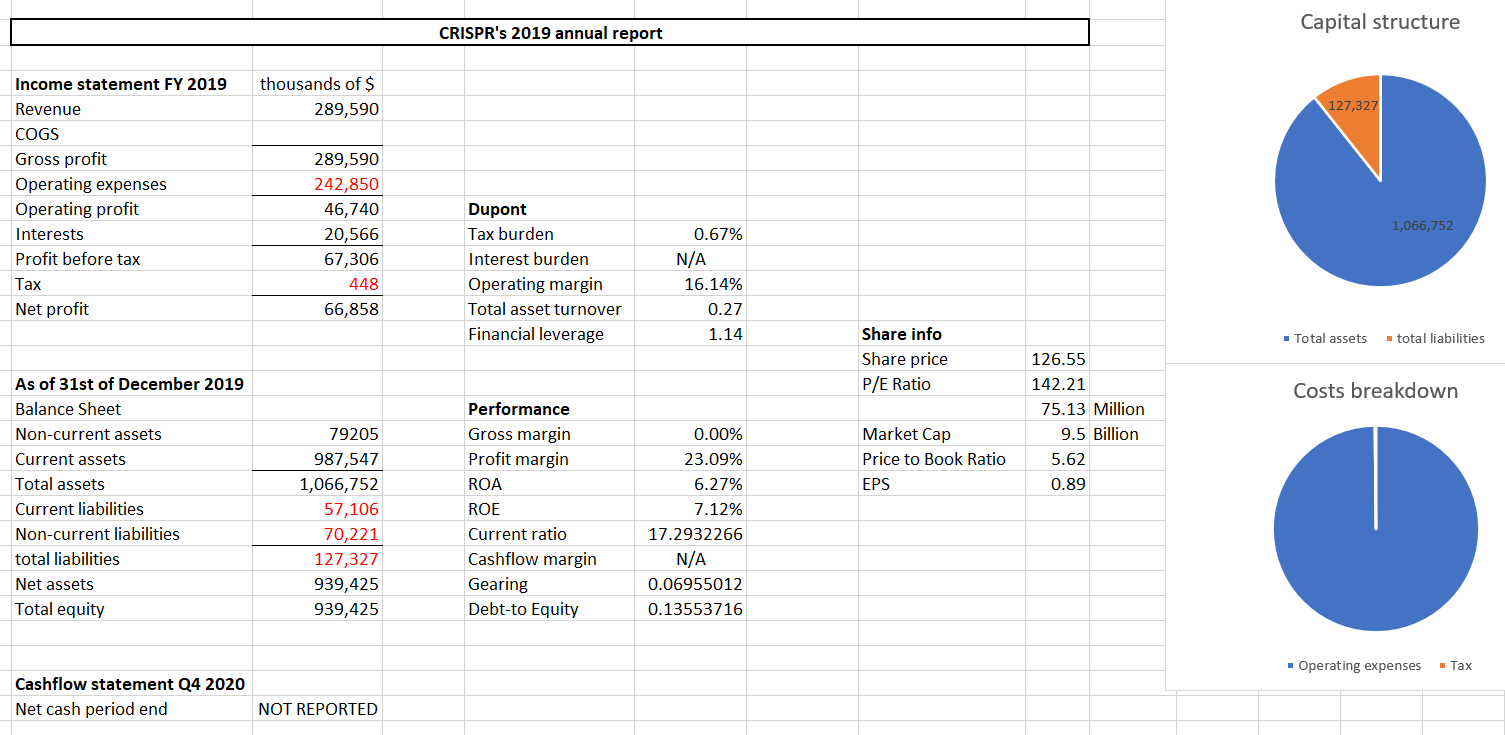
Source: CRISPR 2019 annual report
Strengths: Research of genetic medicine which will benefit people with diabetes and several types of cancer. Product differentiation, high barriers to entry.
Weaknesses: Not very frequent cashflows.
Opportunities: unique opportunities in the field of diabetes and cancer.
Threats: Other companies taking over (unlikely).
Expected exponential growth in the near future as groundbreaking research for the pharmaceutical industry is released. High demand of the products coming out of the research as cases of diabetes keep on increasing every year (when looking at the charts, bear in mind that the interest expense was positive during the period).
The firm does not generate cashflows often as its revenue comes mainly from partnerships with other companies. Nevertheless, it is expected that their research generates brilliant treatments for patients with chronic diseases.
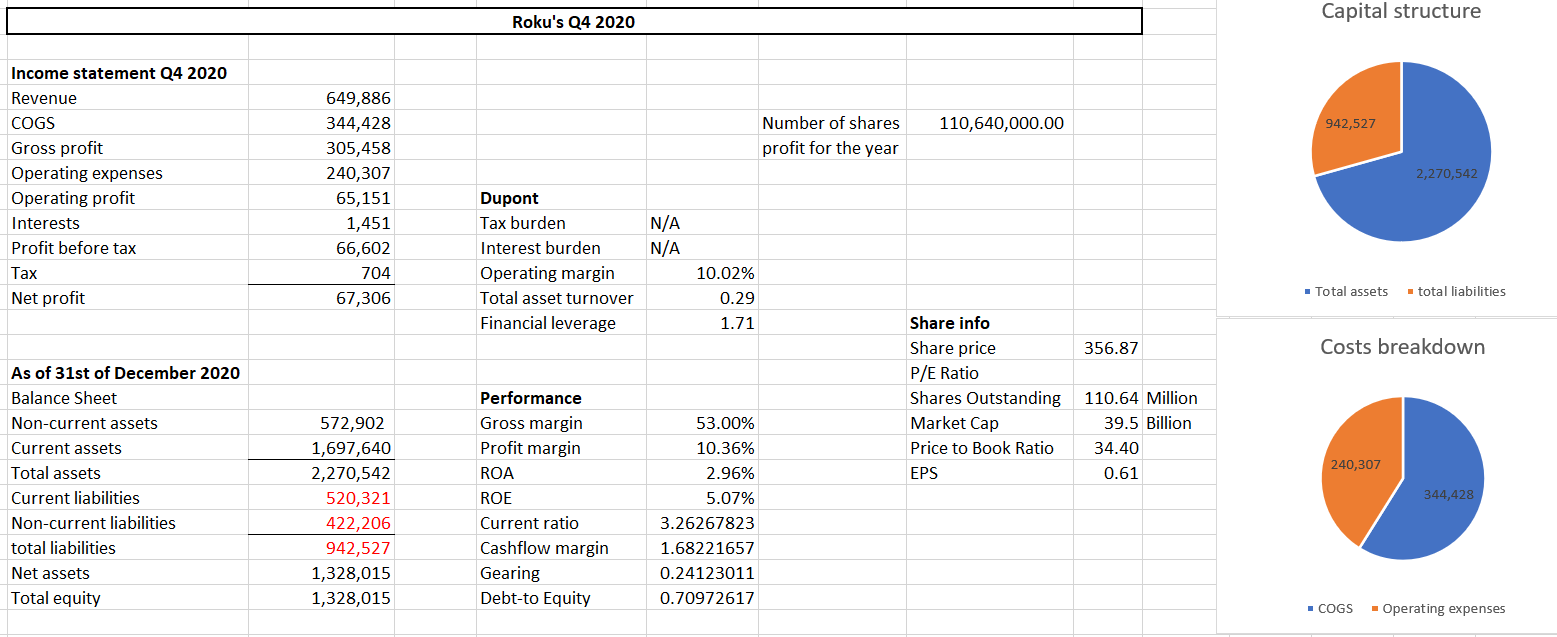
2.3 ROKU
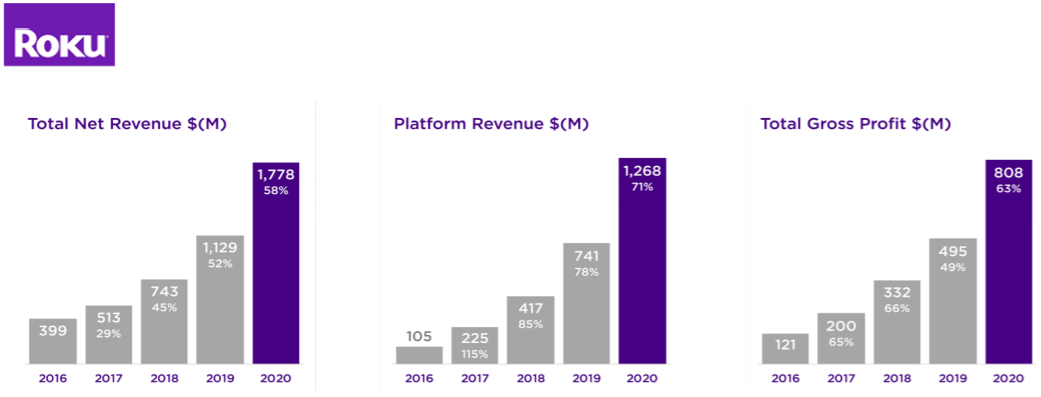
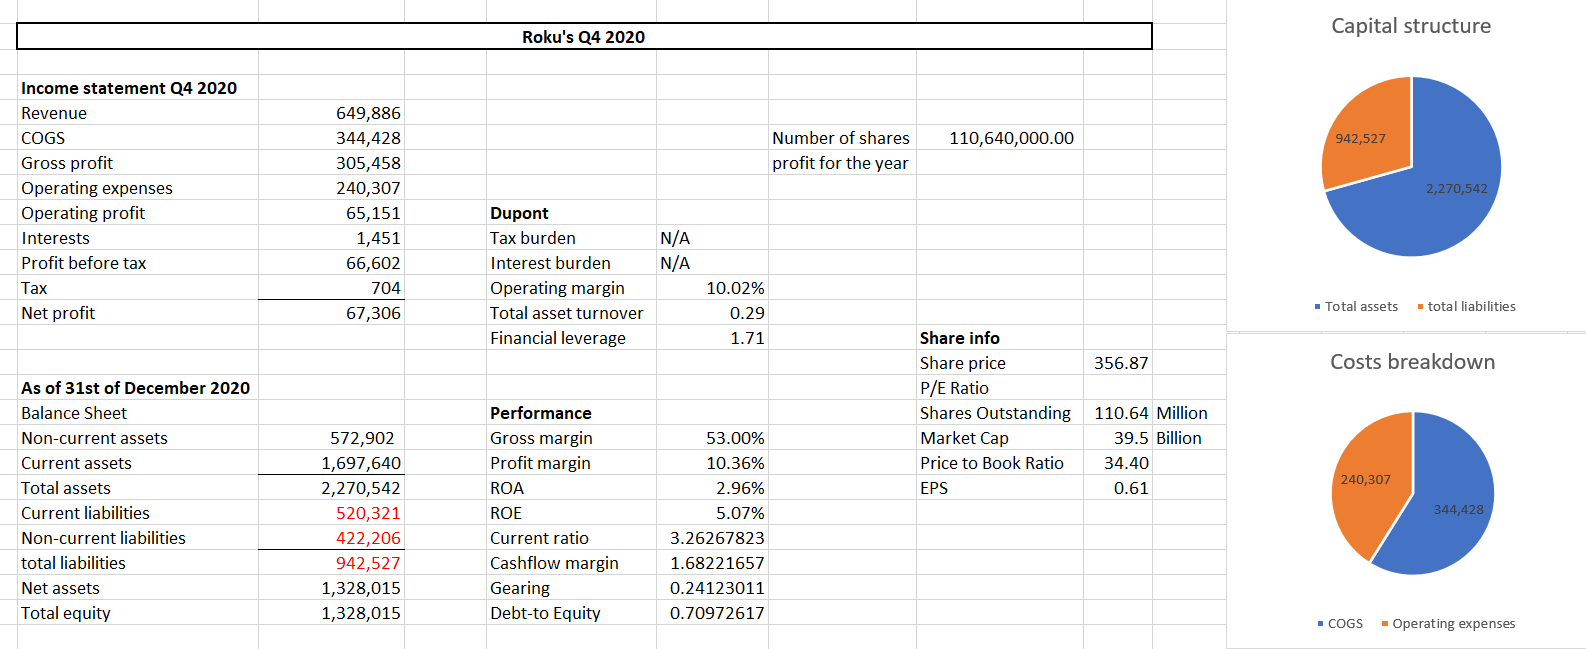
Source: Roku’s shareholder letter Q4 2020
Strengths: Product differentiation, easy-to-use products, versatility, number one in the field.
Weaknesses: Existence of possible substitutes.
Opportunities: They have an opportunity to seize market and become the standard portal for video streaming.
Threats: Existence of similar services (of lower quality).
Roku offers devices and services of household convenience. Their platform serves as a portal to any video or film that customers may want to watch from home. They are currently expanding, and high returns are expected in upcoming years.
During the three months ended on the 31st of December 2020, the firm received positive interests and also tax benefits due to previous net losses, but it’s coming out of the tunnel now ready to expand.
Very decent gross, operating and profit margins. The current ratio shows very decent level of liquidity in the short term and a low level of gearing and debt. The shares seem a bit overpriced, but future growth is expected as they expand.
2.4 PROTO LABS
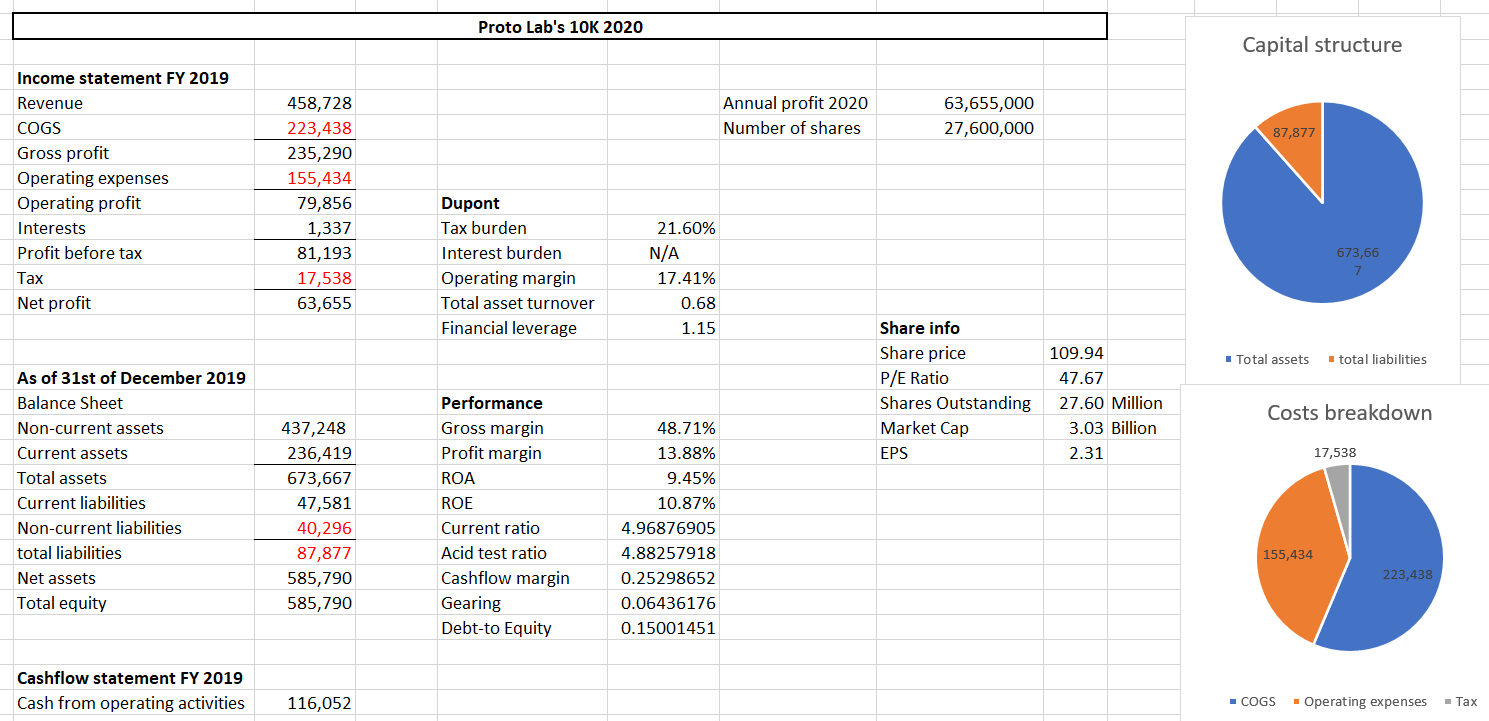
Source: Proto Labs’ 20120 10K
Strengths: Product differentiation, economies of scale, unique product.
Weaknesses: high overheads.
Opportunities: Still growing and opportunity of becoming really big in upcoming years.
Threats: High costs of production.
Many of the industrial structures used in manufacturing will be produced by Proto Labs in upcoming years, rendering the previous means of production obsolete. Very good opportunity for disruption. Excellent performance measures, ready to take over the market. Brilliant liquidity levels, goods EPS, amazing gross margin and good profit margin, positive interest during the last financial year.
2.5 FTSE-100 index fund
All four equities chosen for the portfolio are high-growth, high-risk securities, selected for their strong performance potential in upcoming years.
An index fund that tracks the value of the market benchmark has also been included for two reasons; 1, it serves as a great diversification tool (about 100 companies of many different industries) and 2, it will reduce the risk of the equity weight of the portfolio considerably. The idea is to benefit from the great growth of these individually picked shares and bring risk down to a minimum by adding the market returns of the benchmark and virtually remove unique risk.
This approach will allow for potential almost stratospheric returns while holding value if any of these companies does not perform as expected.
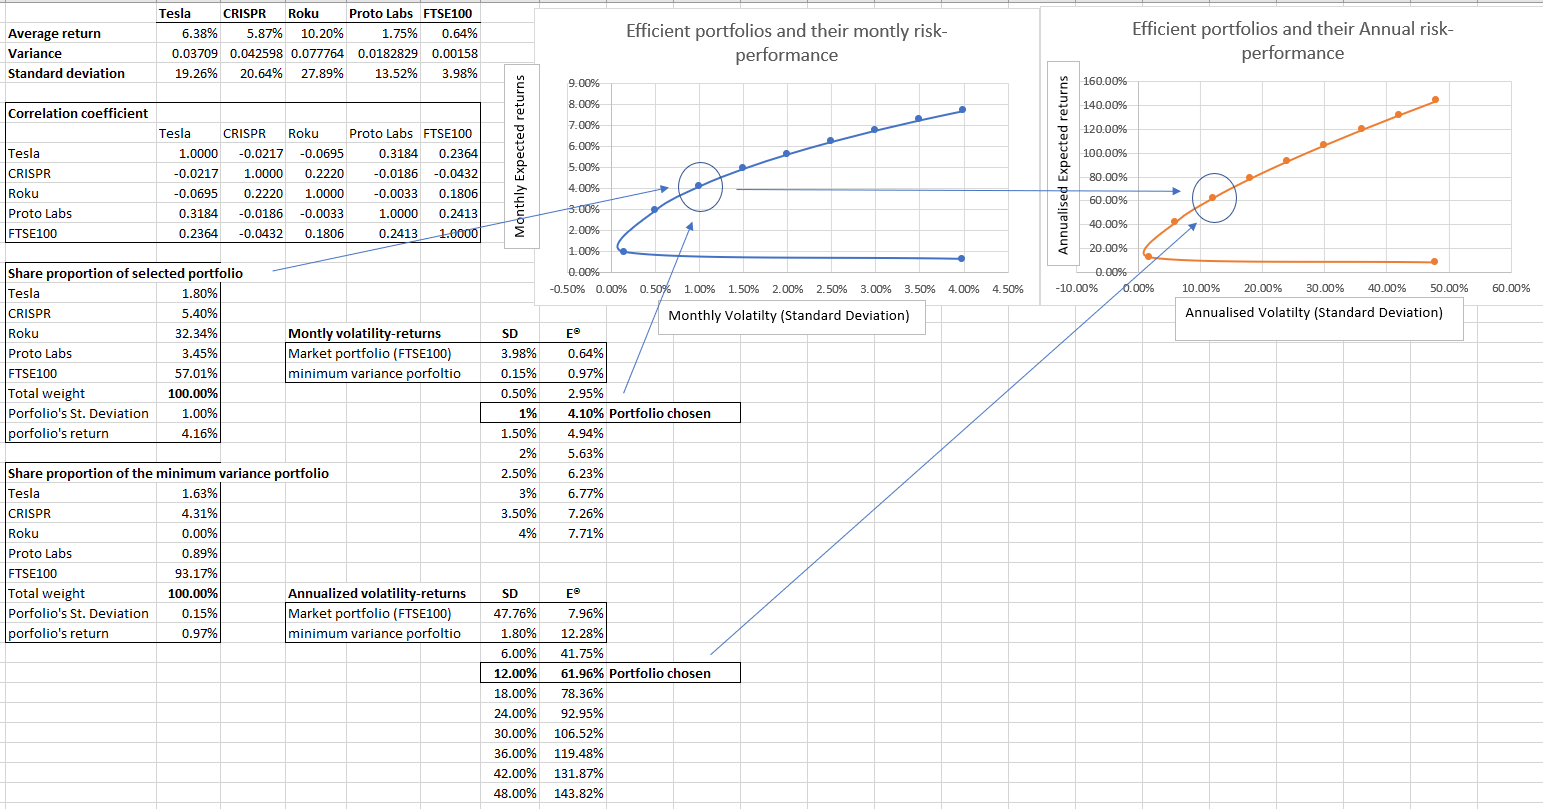
2.6 Efficient portfolios and the ‘chosen one’
Following modern portfolio theory, the following combination of equity has been chosen (see appendices for more details). Out of the portfolios in the efficient frontier, the one with volatility of 12% a year has been selected.
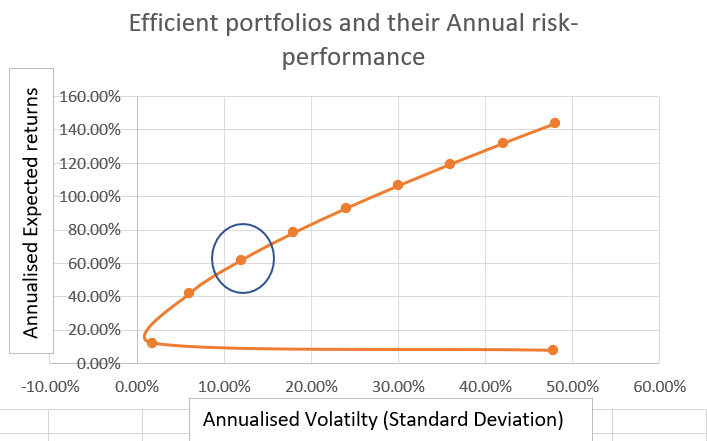
As it is shown above, the equity portfolio does what it is intended to; yield very high returns with a minimum of risk. The portfolio in question has been chosen over the minimum variance portfolio with an annual volatility of 12% and could yield returns as high as 61.96% a year, which efficiency is way higher than the market portfolio benchmark with SD of nearly 48% and returns of only 8% (for the purposes of this report, we assume expected market returns of 8% a year with its standard deviation taken from the actual fluctuations over the past five years).
The combination of shares with their capital invested at these proportions allows for high growth from the four hand-picked firms while the market index fund drags volatility down.
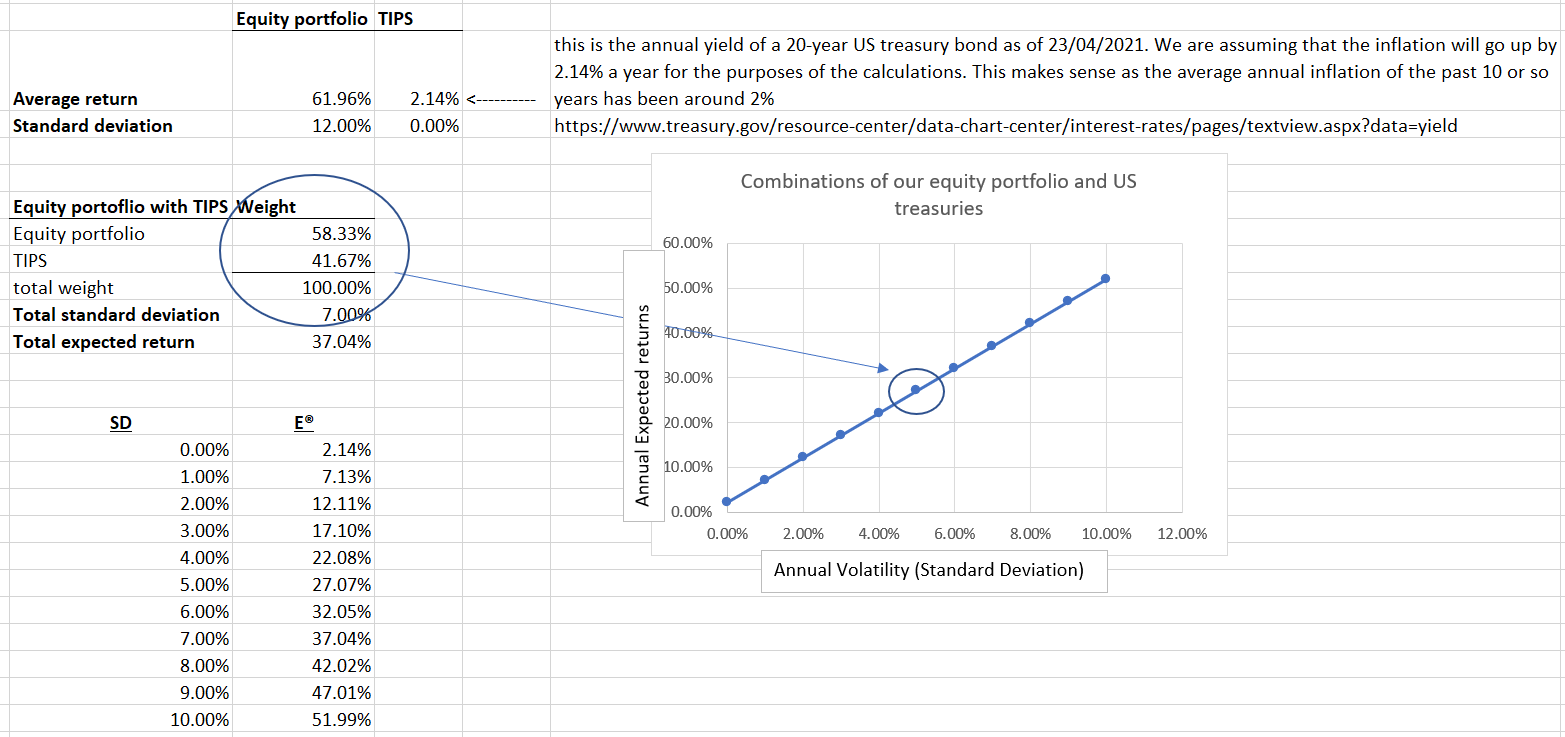
In order to further reduce risk, we could combine this equity portfolio with US treasuries like TIPS. Below, there is a graph with efficient portfolios using this combination.
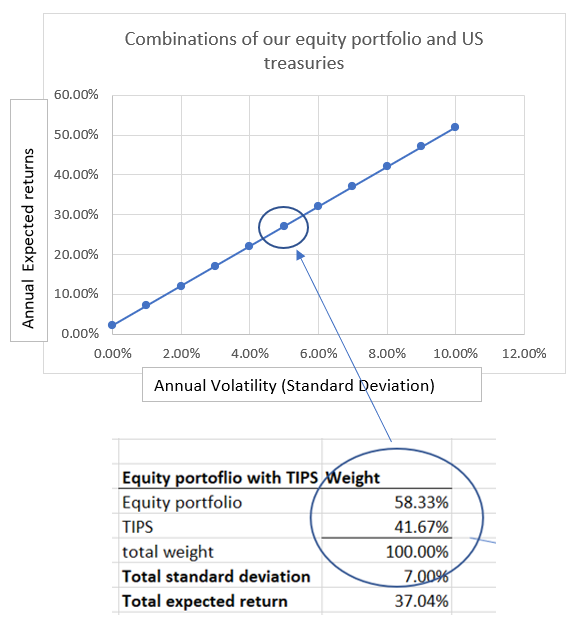
If investors chose a volatility tolerance of 7% a year, they could potentially yield annual returns of 37.04% (see appendix for details).
2.7 Measuring the performance of the equity portfolio
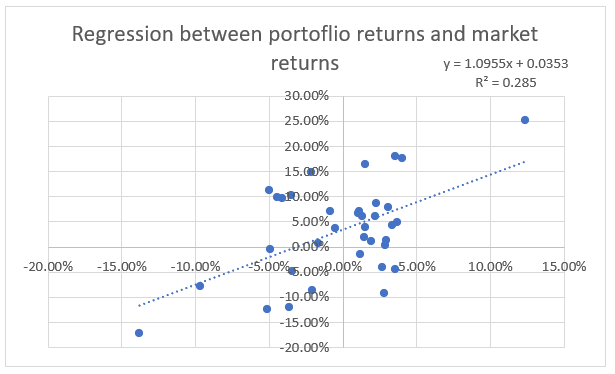
Regression analysis (monthly market returns on the X axis, monthly portfolio returns on the Y axis) indicates that, during the past three years, 28.5% of the monthly changes of our portfolio are explained by movements of the market index. It also shows a Beta value of 1.01, suggesting that the portfolio moves along the market (just slightly more sensitive) but with a constant of 3.40%, which would mean that when the market does not move, the portfolio should theoretically move up by 3.40%. The Beta value will be needed to calculate the following performance measures (see appendix for more details).
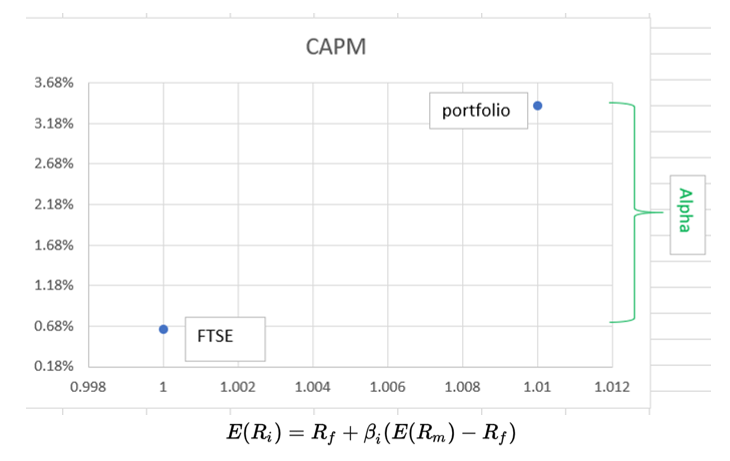
0.0018+1.01(0.0064-0.0018) = 0.64%. According to the capital asset pricing model (CAPM) and the security market line, a return of a security/portfolio is equal to its Beta sensitivity to market returns. In other words, if Beta is equal to 1, like it is in our portfolio, we should be getting the same returns as the market index.
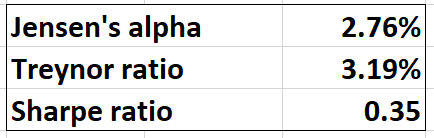
However, our calculations have found that if we had held our equity portfolio as it is for the last three years, the monthly returns would have been 3.40% on average, given us a Jensen’s alpha of 3.40-0.64 = 2.76%.
The Treynor ratio shows a premium of 3.19% over the expected CAPM return (realized return minus the risk-free rate divided by the portfolio’s beta). On the other hand, the Sharpe ratio shows a premium over total volatility of only 0.35%, as the portfolio’s realized monthly volatility ended up been 9.25%, which is much higher than the expected 1% set by the efficient portfolios.
Some of the most common measures in the industry (EDHEC, 2008)
All of the performance measures used show excellent performance by the equity portfolio, outpacing the market’s returns by a remarkable difference (122% up in three years). However, modern portfolio theory seems to have failed to give an approximate level of risk for our supposedly efficient portfolio. A solution to this problem would be to add an appropriate number of risk-free treasuries.
If we had held the suggested portfolio of equity and risk-free assets suggester earlier, its performance would have been as shown below.
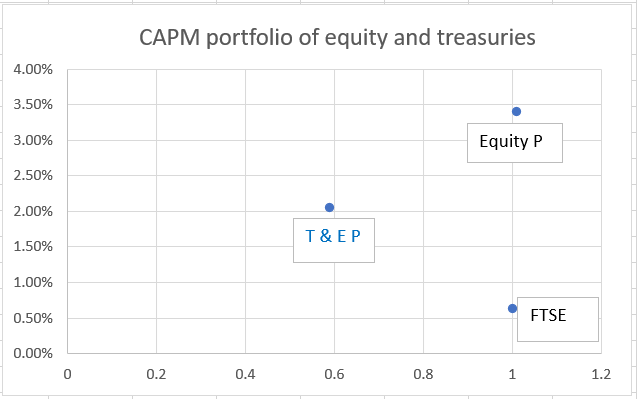
The risk would have gone down to 5.4% a month and the returns would have been of 2.06% (T & E P). The volatility would have been reduced by about 40%, effectively performoing more efficiently that the only equity version.
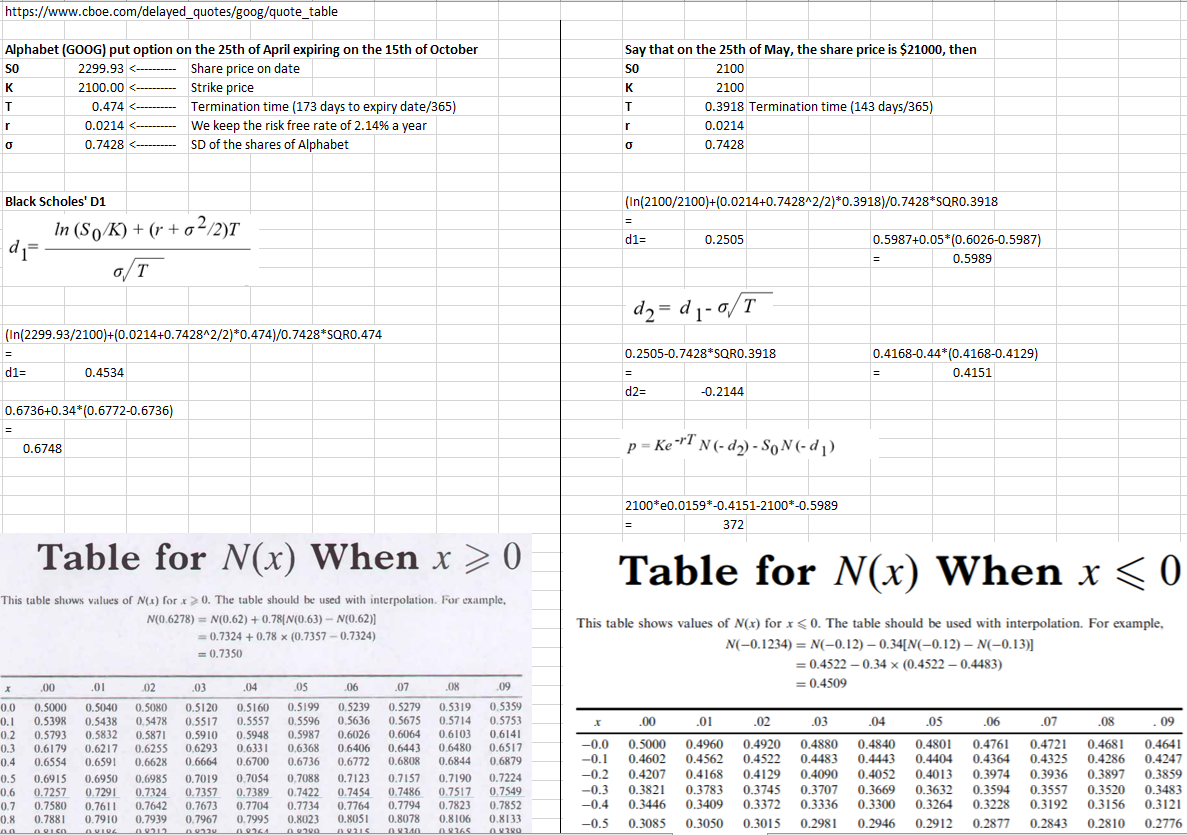
3. One million dollar traders
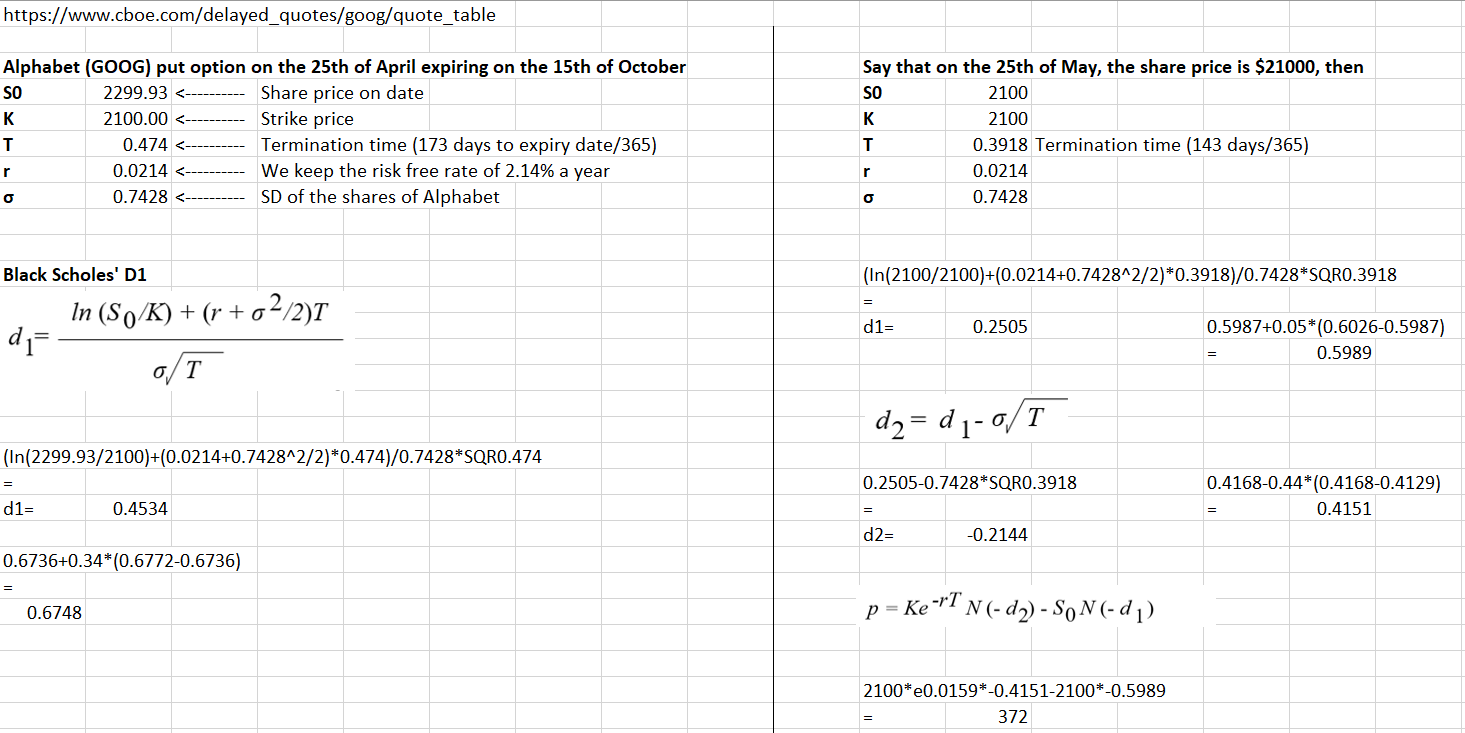
It is understood that the investor intends to put one million dollars in Alphabet shares. In order to hedge risk againts putting all the eggs on one basket, it has been advised to hedge risk by purchasing put options. For the purposes of our calculations, the Alphabet (GOOG) put option on the 25th of April expiring on the 15th of October with a strike price of $2100 has been chosen for the hedging startegy.
If one were to hedge the whole position and be risk neutral, according to the black-scholes model (Hull, 2015), one would need to buy 47 of these options (they have a volume of 5 shares per option).
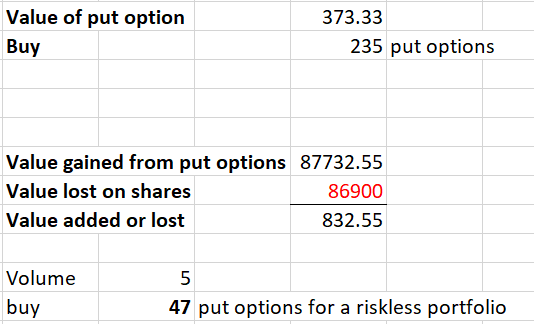
For the investor to have an exposed portfolio with reduced risk, the hedging could be as follows.
The number of put options to purchase would depend on the risk tolerance of the investor.
References
EDHEC (2008) ‘Performance measurement practices: Call for reaction’, The EDHEC European investment practices survey, https://risk.edhec.edu/
Hull, John C. (2015) Options, Futures and Other Derivatives (ninth edition, Pearson):
Appendix

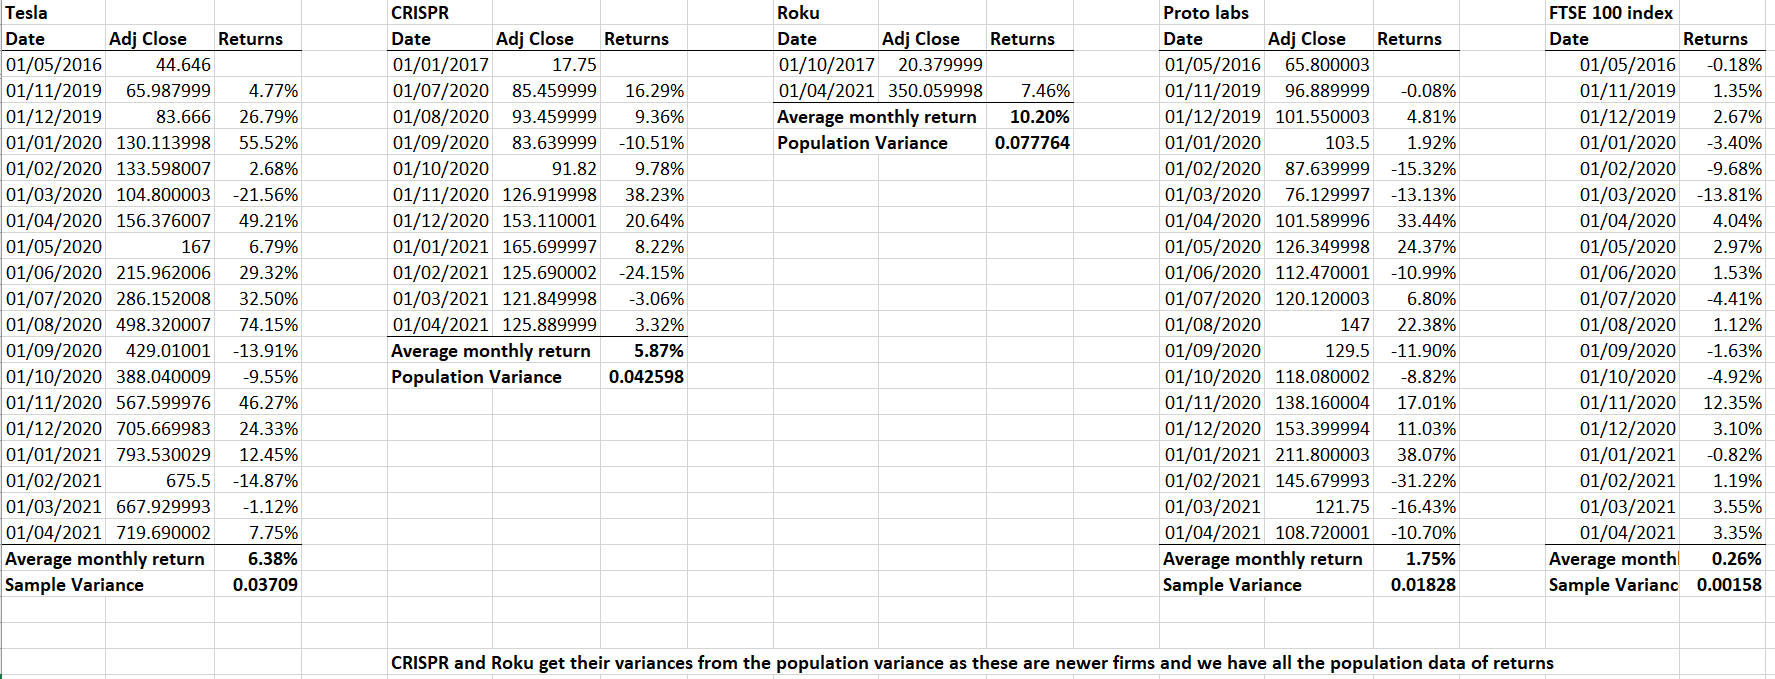
Monthly returns for the past five years have been used to calculate the expected return and variances of the shares and the market benchmark index.