Corporate Finance Paper
Number of words: 5013
Introduction
The retail sector refers to the component of the economy that comprises of businesses that sell their products through the internet. Generally, there are countless numbers of retailers, as no single entity can be a monopoly in the retail sector (Khan, 2017). The retail sector has one key feature that differentiates it from other sectors. Precisely, the retailers do not manufacture any product, but instead, buy the commodities in bulk from the manufacturer and then sell at a profit. The retail sector is characterised by a high degree of rivalry between the operating companies since the consumers are not loyal (Khan, 2017). Besides, manufacturers are usually not obligated to work with specific retailers. In this regard, most retailers invest heavily in advertising and marketing to lure customers. Some of the examples of retailers in the UK include Sainsbury’s, Tesco, Walmart (Asda), and Morrisons, among others (Khan, 2017). In this paper, we will focus on Walmart, as it is the largest retailers in the world in terms of both size and revenues.
Sam Walton, a retailer, launched Walmart in 1962. Previously, he had a small franchise store. Walton was guided by a vision of earning profits online through volume (Neebe, 2020). Notably, he would buy goods in bulk from the manufacturers and then sell to the customers at a mark-up. At the time, this was a radical shift from what other retailers used to do. Specifically, the existing retailers never changed the prices of the goods even after the manufacturers had offered them discounts (Neebe, 2020). Through this, Walmart grew steadily. In the 1970s, Walmart started using computers to connect with its warehouses (Neebe, 2020). This resulted in the company becoming increasingly efficient as its inventories reduced.
Walmart has four main segments in which it operates: International, USA, online retail and Sam’s club. As of 2020, Walmart had circa 11,000 stores in 27 countries in the world. The stores operate in 56 different names (Neebe, 2020). The company trades as Walmart only in USA and Canada, while it operates as ASDA in the UK. As of 2020, Walmart was the largest private employer by employing close to two million people in the world (Neebe, 2020; Ellickson, 2016). Besides, in 2020, Walmart registered the highest revenues of any company by recording £ 394.97 billion as revenues (Neebe, 2020). The company is listed in the New York Stock Exchange market, where it trades under the ticker symbol WMT. In the international sphere, Walmart has only been successful in the UK, Canada, South and Central America (Neebe, 2020).
This report will provide a robust assessment of Walmart’s financial performance to determine its financial health. In the first section, a performance analysis of Walmart will be performed by evaluating vital financial ratios such as gross profit margin, operating profit, and ROCE. In the subsequent section, an investor analysis of Walmart will be performed by looking into key ratios such as share prices, interest coverage ratio and long term debt to capitalisation ratio, among others. In the two years, Walmart’s performance will be compared to preceding years and its competitors. Lastly, a robust assessment of the impacts of Covid 19 on Walmart will be conducted.

Figure 1.0 One of Walmart’s outlets
Performance Analysis
Gross Profit Margin
Gross profit is a metric that is commonly used to evaluate the financial health of companies (Alexander et al., 2017). It represents the percentage of revenue, which exceeds the cost of goods sold (COGS). As a financial ratio, the gross profit margin provides useful insights on whether a company is making enough sales or its operations are efficient (Alexander et al., 2017). Usually, the gross profit margin is expressed as a percentage.
| Year | Gross Profit | Revenue | Gross Profit margin |
| 2016 | £121.1 B | £ 370.45 B | 25.1% |
| 2017 | £ 93.06 B | £ 373.37 B | 25.6% |
| 2018 | £ 97.51B | £ 384.44B | 25.4% |
| 2019 | £ 99.20B | £ 395.27 B | 25.1% |
Table 1: Walmart’s gross profit for the last 4 years (Dybek, 2020)
From Table 1 above, it can get observed that Walmart’s Gross profit and revenue have been slowly and steadily increasing from 2016 to 2019. Essentially, this means that the company is increasingly becoming more efficient and making enough sales each passing year. Notably, between 2018 and 2019, Walmart experienced a 2.89% increase in its total revenues. Further, in 2019, Walmart’s gross profit margin stood at 25. 1%. However, this was a slight decline from the preceding year.
In the retail industry, the average gross profit margin in 2019 was 23.98% (Macrotrends, 2020). Subsequently, this means that Walmart’s gross profit margin in 2019 was higher than the industry averages.
| Name | Gross Profit margin |
| Amazon. com | 40.3% |
| Ebay.com | 77.3% |
| Kohl Corporation | 36.8% |
| PriceSmart Inc. | 16.6% |
| Costco Wholesale Corporation | 13.2% |
| Target Corporation | 29.2% |
Table 2: A summary of Walmart key competitor’s Gross profit margin (Dybek, 2020)
From table 2 above, it can be observed that Walmart’s gross profit margin, although greater than the industry averages, it is less than that of its key competitors such as Amazon and E bay. However, this can be because the two are essentially e-commerce platforms, which means that they have relatively lower operating costs (Brigham & Daves, 2012; Brigham & Houston, 2012). Nonetheless, Walmart is still the largest retailer. If Walmart is to retain its position as the largest retailer, it should invest in technology and innovation to rival Amazon and eBay’s e-commerce platforms.
Operating Profit
The operating profit margin refers to a company’s profit, excluding taxes and interests (Alexander et al., 2017). When calculating the operating profit margin, operating expenses and costs are normally deducted from the gross profit. In this regard, the operating profit and EBIT (Earnings Before Interest and Taxes) essentially mean the same thing (Alexander et al., 2020). For the company’s stakeholders, especially managers, the operating profit margin is a crucial metric as it shows revenues and expenses, which they have control over.
As a financial metric, the operating profit margin shows the profits earned by an enterprise in its businesses and operations. The strength of the operating profit margin as a ratio arises from the fact that it does not consider taxes and interests (Alexander et al., 2017). Notably, taxes have no relation whatsoever on how a business is being run. Also, interest expenses depend on the financing model used by a company, either debt or equity. Furthermore, the financing structure of an enterprise does not tell how efficient a company is being run. For outsiders, an enterprise’s operating profit margin shows the aggregate demand for its products and services and its efficiency in delivering the services and products.
| Year | Operating margin |
| 2019 | 4.09% |
| 2018 | 3.98% |
| 2017 | 4.48% |
| 2016 | 4.79% |
| 2015 | 5.25% |
Table 3: Walmart’s Operating profit margin from 2015 to 2019 (Dybek, 2020).
In the last five years, Walmart has maintained a profit margin of over 3.9%. However, from 2018 to 2019, Walmart experienced an increase in its operating margin from 3.98% to 4.09%. This demonstrates that the company is increasingly becoming efficient in its operations. It also demonstrates that the demand for Walmart products and services increased between 2018 and 2019.
In 2019, the operating profit margin for the retail sector was 5.66% (Dybek, 2020). In this regard, Walmart can be considered as being inefficient and not making adequate sales relative to its competitors.
| Name | Operating Profit margin |
| Amazon. com | 5.18% |
| Costco Wholesale Corporation | 3.17% |
| Dollar General Corporation | 8.26% |
| Lowe’s Cos Inc. | 5.63% |
| Home Depot Inc | 14.35% |
| Target Corporation | 5.52% |
Table 4: A summary of Walmart key competitor’s operating profit margin (Macrotrends, 2020)
From table 4 above, it can be inferred that Walmart’s operating margin is inferior to most of its competitors. This can be attributed to the fact that some of Walmart’s competitors, such as Amazon are e-commerce platforms, which means that they have low operational costs (Alexander et al., 2017). Besides, most of Walmart’s competitors operate in a single market. Walmart, on the other hand, is multinational. Arguably, this raises the operational costs of the entity.
ROCE
ROCE (Return on Capital Employed) refers to the aggregate pre-tax profits an enterprise generates from the capital invested in its operations (Brigham & Houston, 2012). Usually, a higher ROCE is desirable. The ROCE measures the annual pre-tax profits relative to the amount of capital invested in its operations. In 2019, Walmart had a ROCE of 14%. The consumer retailing industry, on the other hand, had a ROCE of 7.3%. Principally, this means that Walmart was using the capital employed in its operations more efficiently than its competitors were. For Walmart’s shareholders, the high ROCE margin signifies higher earnings per share (Alexander et al., 2017). Arguably, this is because Walmart is generating high profits with its current level of capital. Therefore, if some of the generated profits can get reinvested as extra capital, this will result in higher returns and growth in the earnings per share. However, it is essential to note that the ROCE is not always predictive as it is backwards-looking (Brigham & Daves, 2012).
Furthermore, when analysing Walmart’s ROCE, it is essential to note that the company’s relatively high level of current liability contributes to its high ROCE. As of 2019, Walmart’s current liabilities represented circa 33% of its total assets.
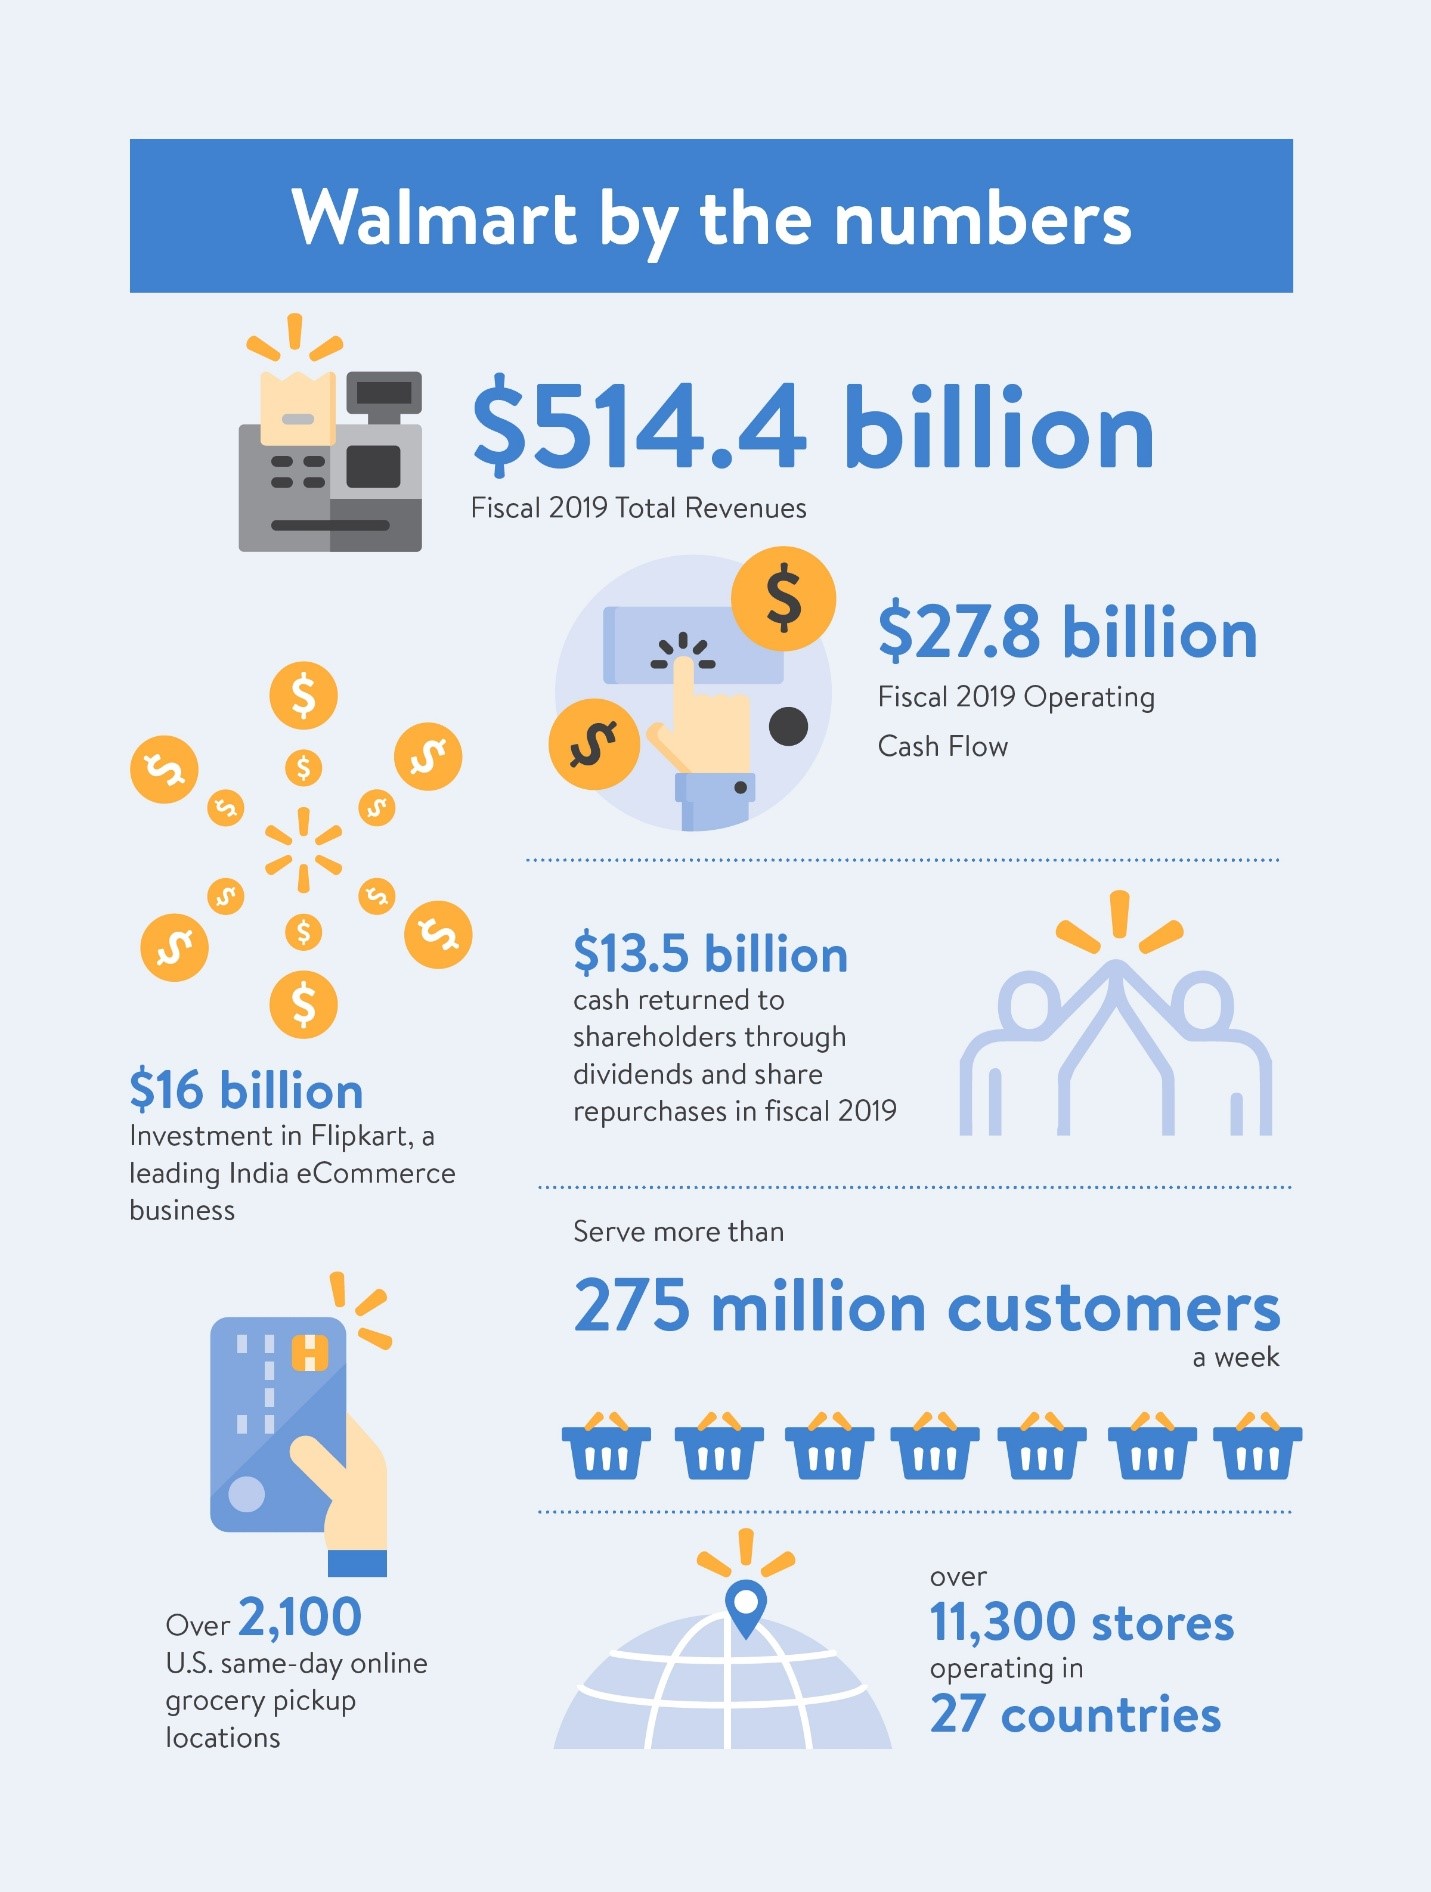
Figure 2.0 Walmart’s revenues breakdown
Investor Analysis
Gearing Ratio
Long-term debt to capitalisation ratio
The long-term debt to capitalisation ratio is principally a variation of the debt to equity ratio (Alexander et al., 2020). It shows the level of financial leverage of an enterprise and is computed by dividing the enterprise’s long-term debt by its total capital. For investors, the long-term debt to capitalisation ratio shows the level of investment risk. High long-term debt to capitalisation ratio indicates that a company is at a high risk of insolvency as debt is the primary source of financing (Alexander et al., 2020). Generally, long-term debt to capitalisation ratio of less than 1.0 is desired. Long-term debt to capitalisation ratio of more than 1.0 means that a company has more debt than equity.
| Year | Long term debt to capitalisation ratio |
| 2019 | 0.363 |
| 2018 | 0.295 |
| 2017 | 0.322 |
| 2016 | 0.329 |
Table 5.0 Walmart’s long-term debt to capitalisation ratio between 2016 and 2019 (Dybek, 2020)
From table 5.0, it can be inferred that in the last four years, Walmart’s long-term debt to capitalisation ratio has been less than 0.40. Arguably, for investors, this is desirable as it shows that the enterprise is not highly leveraged. Walmart is not financed using debt as the primary source and therefore, its risk of going insolvent is low.
In the retail sector, the average long-term debt to capitalisation ratio is 0.60. Therefore, this means that Walmart is a less risky investment choice when compared to its competitors in the retail sector (Macrotrends, 2020).
Interest cover ratio
The interest coverage ratio (ICR) evaluates how well an enterprise can pay interest on its outstanding debt obligations (Alexander et al., 2020). Investors, lenders and creditors often use the ICR to determine the level of risk when lending capital to firms. The ICR is also known as the times earned ratio. A lower ICR shows that a company has a higher debt burden and therefore is more likely to default on its interest payments. A lower ICR also indicates that a given enterprise is highly vulnerable to an increase in the interest rates. Generally, an ICR of 2 is desirable, as it means that the company can seamlessly pay its interest obligations from its operational earnings (Brigham & Daves, 2012). However, a very high ICR is not desirable as it means that a company is risk-averse and is not looking to leverage its opportunities to maximise earnings.
| Year | ICR |
| 2016 | 9.49 |
| 2017 | 9.66 |
| 2018 | 7.49 |
| 2019 | 5.88 |
Table 6.0 Walmart’s ICR from 2016 to 2019 (Macrotrends, 2020)
From table 6.0 above, it can get inferred that Walmart has had a relatively high ICR ratio in the last five years. In this regard, Walmart is in a better position to meet its interest payments from earnings from its operations. Although the ICR decreased between 2018 and 2019, Walmart is still in a better position.
| Name | ICR |
| Dollarama Inc. | 8.45 |
| Costco Wholesale Corporation | 33.97 |
| Dollar General Corporation | 26.09 |
| Avenue Supermarkets Limited | 21.43 |
| B&M European Value | 3.95 |
| Target Corporation | 10.57 |
Table 7.0 A summary of Walmart’s key competitors ICR (Dybek, 2020)
The average ICR in the retail industry is 15.64. Notably, as can be observed in Table 7.0, other companies in the retail sector have managed to attain high ICR. However, this should not because of alarm, as Walmart’s ICR is still considerably high, meaning that the company can continue meeting its interest payments on its debt obligations.
P/E ratio
The price to earnings ratio shows the relationship between a firm’s stock price and its EPS (earnings per share). For investors, the P/E ratio gives a better picture of the company’s value (Alexander et al., 2017). It shows the expectations of the market on the stock of a given enterprise. The P/E ratio shows how profitable a company currently is and how profitable it will be in the future.
| Year | P/E |
| 2016 | 13.93 |
| 2017 | 21.83 |
| 2018 | 55.45 |
| 2019 | 23.00 |
Table 8.0 Walmart’s P/E ratio between 2016 and 2019 (Macrotrends, 2020)
From table 8.0 above, it can be inferred that Walmart’s P/E ratio decreased from 2018 to 2019. Conceivably, this shows a decline in investors expectation of the likelihood of the company to remain profitable in the future. In the retail industry, the trailing P/E ratio is 18.64, which is lower than Walmart’s. Therefore, this means that investors expect Walmart to remain more profitable in the future compared to its competitors in the retail sector.
Dividend yield
The dividend yield shows how much an enterprise pays each year as dividends compared to its stock price. The yield from dividend rises when the stock price falls, and decreases when the stock price rises (Brigham & Houston, 2012). High dividend yields often get paid by mature companies that are not growing at a relatively high rate. However, it should get noted that high dividend yield does not necessarily mean more attractive investment opportunities since the dividend yields of a given stock may be raised when its stock price is falling.
| Year | Dividend yield |
| 2016 | 3.05% |
| 2017 | 2.91% |
| 2018 | 2.05% |
| 2019 | 1.50% |
Table 9.0 Walmart’s Dividend yield between 2016 and 2019 (Dybek, 2020)
From table 9.0 above, it can be observed that Walmart’s dividend yield raised from 2018 to 2019. For investors, the increase in the dividend yield is attractive as it demonstrates improved financial performance of the company.
| Name | Dividend yield |
| Dollarama Inc. | 0.35% |
| Costco Wholesale Corporation | 0.72% |
| Dollar General Corporation | 0.65% |
| Avenue Supermarkets Limited | 0.00% |
| B&M European Value | 1.64% |
| Target Corporation | 1.66% |
Table 10.0 A summary of Walmart’s key competitors dividend yield (Dybek, 2020)
In 2019, the average dividend yield in the retail industry was 1.50% (Macrotrends, 2020). This shows that Walmart performance, in this regard, is in line with its competitors in the retail sector.
Dividend coverage ratio
Dividend coverage ratio (DCR) is a financial ratio that measures the amount of times an enterprise can pay dividends to its shareholders (Brigham & Daves, 2012). For investors, a high dividend coverage ratio is desired. A high dividend coverage ratio implies that a company can sustain its dividend payments even when its continued profitability is threatened.
| Year | DCR |
| 2016 | 9.14 |
| 2017 | 8.59 |
| 2018 | 6.31 |
| 2019 | 4.43 |
Table 11.0 Walmart’s DCR between 2016 and 2019 (Dybek, 2020)
From table 11.0, it can be observed that Walmart’s DCR has been decreasing. For investors, this is a cause of concern. In 2018, Walmart could pay out circa six times what it paid as dividends. In 2019, it could only pay out circa four times what it paid out as dividends.
For investors, this can be construed as indicating that the company cannot sustain its current dividend payments.
Share Price
From 2016 to 2019, it can get observed that Walmart’s share prices have remained relatively stable. In this regard, Walmart, as a stock, is not a risky option.
| Year | Walmart Share Price | Annual % Change |
| 2016 | £ 53.11 | 12.76% |
| 2017 | £ 75.88 | 42.87% |
| 2018 | £ 71.58 | -5.67% |
| 2019 | £ 91.40 | 27.58% |
Table 12.0 Walmart’s share price between 2016 and 2019 (Dybek, 2020)
Impact of Covid 19
Undoubtedly, the retail sector was one of the industries affected most by the Covid 19. Notably, different retailers were forced to shut their physical stores during the lockdown. Also, most of the retail employees were fired as they could not work from home. Besides, the supply chains of most of the retailers were affected by the various lockdown measures imposed by multiple countries during the peak of the pandemic (Hall et al., 2020). Nonetheless, at the same time, online sales peaked during the pandemic. Generally, there was an increase in online shopping throughout the lockdown period. Partly, this explains why most of the retail stores are investing in the bolstering of their e-commerce platforms.
Firstly, the main impact of Covid 19 on the retail sector is that it resulted in a loss of revenue for most of the traditional retail stores. As previously stated, the lockdown measures imposed by various states resulted in the closing of several physical stores of multiple retailers. With the physical stores closed, most retailers could no longer sell their products as they used to; as such, this resulted in a substantial reduction in their revenues (Hall et al., 2020). Further, the Covid-19 pandemic resulted in most people losing their job and therefore losing their purchasing power. Thus, a significant proportion of consumer spending was on essential goods. Overall, this contributed to a decline in the revenues in the retail sector.
The Covid 19 pandemic also influenced the retail sector by accelerating the growth and adoption of e-commerce. For instance, during the pandemic, Walmart experienced a 74% increase in its total online sales (Seetharaman, 2020). The increased demand for online shopping resulted in some of the significant retailers converting their warehouses to be fulfilment centres. Principally, the increased demand for online shopping also influenced how most of the retailers were using their employees (Seetharaman, 2020). Some of the retailers began using their employees to help in fulfilling online deliveries.
The Covid 19 pandemic has also affected the retail sector by forcing companies to look for new and ingenious ways of generating revenues. Previously, most of the retail companies only relied on the sale of products as their primary source of revenue (Hall, 2020). However, the Covid-19 pandemic has led to some of the retail companies offering logistic services to customers. Walmart, however, did not have to resort to such strategies as it has a well-developed online system that can complement its physical stores.

Figure 3.0 Walmart’s online retail system
Conclusion
To sum it up, the paper has presented a robust assessment of Walmart Inc, which is the largest retail store in the world. The essay has presented an overview of Walmart Inc and in particular, its sister organisation Asda in the UK. Subsequently, the article has presented performance and investor analysis of Walmart Inc. The company’s past financial ratios and industry averages have been used to assess Walmart’s financial health. Lastly, the article has looked at the impacts of Covid 19 on the operations of Walmart. The retail sector was one of the severely affected industries by the Covid 19 pandemic in the UK.
References
Alexander, D., Britton, A., Jorissen, A., Hoogendoorn, M. & Van Mourik, C. 2017, International financial reporting and analysis, 7th Edition, Cengage Learning, Andover. https://books.google.com/books?hl=en&lr=&id=Z8skEGBkqYQC&oi=fnd&pg=PR8&dq=,+International+financial+reporting+and+analysis,
Brigham, E.F. and Houston, J.F., 2012. Fundamentals of financial management. Cengage Learning. https://d1wqtxts1xzle7.cloudfront.net/61207082/epdf.pub_fundamentals-of-financial-management-eleventh-edit20191113-119089-1i6ldfi.pdf?1573678061=&response-content-disposition=inline%3B+filename%3DFundamentals_of_Financial_Management_Ele.pdf&
Expires=1603733010&Signature=dbwbjaad1MOp6JbyCtJmfrQnzGlfiFZoG5EKzetzRa8mCPOXIj5XIIxQ4ISapJhKpJvoIzOs6ZcS3vUM-EDtTrFdmoz4FYDj1uL7QtSIpflR-PB0p4wFhe0dMfmB0oJo1D8ctab8ERytpkyWai9Q9VC74DfOySfl7wj8r7LZJ-oTIjiEdI7OOif2eMrk9zZAcqXiqkA9FwGPd2gj11QFtGkSJcwgrHSw0CZ766aEzyMmIW8g48hqVsU1I04Z-lYEAKWhR74lvcaK6ClBRkWv2OdyRBLnol1KIcSxuTrU6HKWolkzlHvnfMJqmzBNAtpT~rmknmsigdTyA~~EyFK-vQ__&Key-Pair-Id=APKAJLOHF5GGSLRBV4ZA
Brigham, E.F. and Daves, P.R., 2012. Intermediate financial management. Nelson Education. https://d1wqtxts1xzle7.cloudfront.net/61073717/Intermediate-financial-management-ninth-edition20191030-39252-y2lz9t.pdf?1572490449=&response-content-disposition=inline%3B+filename%3DIntermediate_Financial_Management_9e.pdf&
Dybek, M., 2020. Walmart Inc. (NYSE:WMT): Liabilities and Stockholders’ Equity. [online] Stock Analysis on Net. Available at: https://www.stock-analysis-on.net/NYSE/Company/Walmart-Inc/Financial-Statement/Liabilities-and-Stockholders-Equity [Accessed 24 Oct. 2020].
Ellickson, P.B., 2016. The evolution of the supermarket industry: from A & P to Walmart. In Handbook on the Economics of Retailing and Distribution. Edward Elgar Publishing. https://www.semanticscholar.org/paper/The-Evolution-of-the-Supermarket-Industry%3A-From-A%26P-Ellickson/fcdae032bdd0771309edc8ab32c7f1746839e607?p2df
Hall, M.C., Prayag, G., Fieger, P. and Dyason, D., 2020. Beyond panic buying: consumption displacement and COVID-19. Journal of Service Management. https://doi.org/10.1108/JOSM-05-2020-0151
Khan, M.W., 2017. Corporate Governance and its Effect on Earnings Quality in Retail Industry of the United Kingdom. Asian Journal of Applied Sciences, 5(5). https://python.zzx.us/index.php/AJAS/article/view/5029
Macrotrends, 2020. Walmart Operating Margin 2006-2020: WMT. [online] Macrotrends. Available at: https://www.macrotrends.net/stocks/charts/WMT/walmart [Accessed 24 Oct. 2020].
Neebe, K., 2020. Sustainability at Walmart: Success over the Long Haul. Journal of Applied Corporate Finance, 32(2), pp.64-71. https://doi.org/10.1111/jacf.12405
Seetharaman, P., 2020. Business models shifts: Impact of Covid-19. International Journal of Information Management, 54, p.102173. https://www.ncbi.nlm.nih.gov/pmc/articles/PMC7323683/