Analysing and presenting data properly is one of the most important parts of any research project. Remember that if your dissertation includes weak analysis, your overall grade will be negatively affected.
That said, it’s important to analyse qualitative data carefully and accurately. But how do you write an analysis for qualitative data? Well, qualitative data comes from a range of sources (words, observations, images and even symbols), so there is no ‘one-size-fits-all’ approach.
In this article, we will take you through everything you need to know about qualitative data analysis. So, let’s get started!
Methods of Qualitative data
| Content Analysis | Narrative Analysis | Discourse Analysis | Grounded Theory |
| Used for documented information (texts, media) Usually gathered from interview respondents | Used for data from a range of sources (interviews, observations, surveys – examines stories and shared experiences | Used for examination of social contexts and interactions as well as environmental factors | Examines phenomenon through examination of similar cases in a range of settings |
Whichever method of data gathering used, the preparation and analysis follow the same stages:
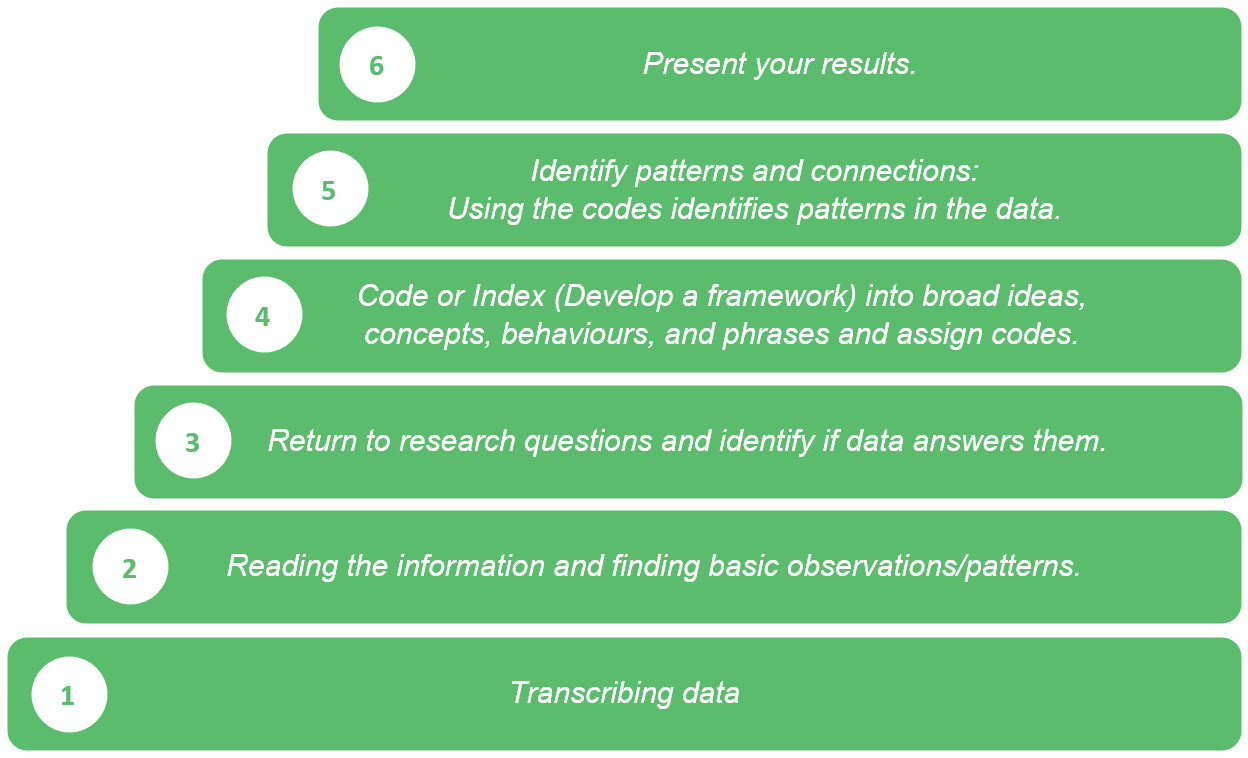
Good Practice for Qualitative Data Analysis
- In the initial stages of reading the information and identifying basic observations, you can try writing out lists so you can then add in the sub-themes as the analysis progresses. This helps to understand the data and key outcomes better.
- Keep your research questions to hand so you can refer back to them constantly and keep that all-important focus.
- Make sure your data is trustworthy and meets the following criteria:
- Credibility: the validity of conclusions achieved through extended engagement, checking with peers, and reviewing with interviewees as well as multiple data sources
- Transferability: how well the results can be applied in similar situations / settings
- Dependability: whether similar outcomes would occur if the study were repeated
- Confirmability: how objective the researcher (and survey instruments) was in gathering the data.
Once the data has been successfully interpreted and you are confident that the results achieved are trustworthy, you are good to go on writing up your findings!
Writing up your qualitative data
Introduction
Your introduction should start with an overview of your respondent profile. Narratives can be one good way, but a table is often an effective way to provide your readers with key information such as gender, age, socio-economic status, or other areas relevant to your work. Your introduction should also include an overview of key themes.
Body Text
To make sure your work is clear and of the highest quality, the body text for qualitative data, irrespective of the analysis process followed, should be broken up into sub-sections for each theme. We suggest having a main heading of a key theme, with sub-headings for each of the sub themes identified in the analysis.
The content of each paragraph or topic theme should identify the codes used for the analysis, followed by the conclusions you have drawn. Note: it is a good idea to include quotations from the raw data to illustrate the points you have made.
But be careful not to use overly long quotes and only use the parts which reinforce your findings. It is also, subject to confidentiality, sensible to identify the source of the quotation (e.g., “respondent 1, female, age 25) as this provides the reader with some context for the views expressed. Hint: Code different respondents with a number so that it is clear when using quotations that they come from a range of sources.
Plus, instead of indicating a number of respondents, it is better to give in fractions rather than percentages e.g., 7/10 respondents indicated, rather than 70%. We also recommend, where possible, to avoid the use of the word “significant” as this can suggest statistical significance which would be inappropriate in qualitative data.
As part of the presentation of the results it is also good practice to refer back to research questions and previous research. Whether the results back up or contradict previous research, including previous works shows that you have undertaken a wider level of reading and understanding of the topic being researched and gives a greater depth to your own work.
Using graphs or figures of key words and themes and how frequently they occurred during the data collection makes your work stand out as this provides illustrative evidence of your analysis process and findings.
Summary of results
Rather than a conclusion, when presenting qualitative results, remember that you at this stage you are giving an overall summation of the key findings, ideally with a conceptual framework. This could be an illustration, diagram, or existing framework, for example a strengths, weaknesses, opportunities, and threats (SWOT) analysis, or a conceptual framework that is original and emerged from your results. This shows that you have understood your data, and that your interpretation has led to some firm outcomes.
Key Phrases for use in writing up qualitative research.
“ A strong theme that emerged was…. with the term “x” being used by (%) of respondents.
“5/20 felt that the issue under discussion was…”
“ A high number of respondents (give fraction) felt that…”
“Underlying this main theme, a number of sub-themes emerged, suggesting some variation”.
“Indications from the core themes are that… but through examination of the sub-themes it was found at…”
“From these quotes, it can be inferred that…” which is in line with work by …”